![]()
![]()
feature
GENERATE: The Game of Energy Choices
Promoting energy literacy while cultivating systems thinking
The electric grid is the system of power generators, power lines, and other equipment that transports electricity from where it is generated to where it is used. As pointed out by author and cultural anthropologist Gretchen Bakke, “[the grid] is the world’s largest machine and the twentieth century’s greatest engineering achievement and we are remarkably oblivious to it” (Bakke 2016). Electricity and its distribution are crucial to the functioning of modern society, yet its dynamics often go unseen and unnoticed by the public. Teaching about the sources used to generate electricity in the context of the electrical grid offers an opportunity to promote energy literacy while cultivating systems thinking among students.
The structure and composition of the evolving electric grid poses complex, real-world questions that are important to examine alongside discussions of our energy sources and their comparative environmental impacts. While science curricula task students with learning about the range of energy sources that can be used to generate electricity, this is just one aspect of the complex problem of providing affordable and reliable electricity to all people. Generate: The Game of Energy Choices, is a competitive board game that places student teams in the role of utility company executives tasked with providing electricity to customers under a range of scenarios, from lowest cost to lowest carbon emissions. Students use a simple, data-based simulation along with mathematical thinking to create a model electric grid by taking into account the cost to build and maintain different electricity-generating facilities over a 30-year period.
The game creates a competitive learning environment to foster student engagement in the decision-making process as they work in teams to battle amongst each other to create an energy portfolio that costs the least while also considering trade-offs about cost, carbon emissions, water use, aesthetics, and public perception. This article describes how this game can enhance your energy instruction and engage students in critically evaluating the range of energy sources used to power their lives and incorporates anecdotes from teachers who have used the game in their classrooms.
When to play
Generate can be used in many ways to enrich instruction about natural resources, including having students use a mathematical model of the electric grid to optimize costs of generating energy over a thirty-year period. Students can play this game effectively without knowledge of the science behind any of the energy sources; the game is mathematical and all the numbers for startup cost, maintenance, and carbon emissions are given on each board piece. When used as a preassessment or before starting an energy unit, Generate allows students to discover constraints such as cost and carbon emissions that influence the energy sources used to generate electricity. When used at the end of a unit about energy sources, Generate can provide opportunities for students to apply their knowledge about each energy source to build an optimized grid, and they can support their model design with scientific reasoning.
Development of the game
This game was developed around 2010 by researchers at the US EPA in Research Triangle Park, North Carolina as part of that facilities’ STEM outreach program to local schools. In consultation with classroom teachers and informal science educators, it was piloted with students in both formal and informal settings. The game utilizes actual cost data (capital and operating costs) and carbon emissions data for both fossil fuel–based and renewable energy power plants in the United States. The game continues to be refined by Rebecca Dodder, Senior Physical Scientist with the EPA, who updated it in 2017 to include battery storage options that better reflect the evolving energy landscape. The costs used in the game are periodically assessed and updated to reflect changes in the US energy landscape. The EPA website hosts the most current version of the game.
Description of the game
Setup
All materials for playing this game, including an instructor’s manual and accompanying PowerPoint, are available for free on the EPA website (see Online Connections). There are five game boards and five sets of energy pieces, all of which need to be printed, cut, and divided among the teams. This can be time-consuming—teachers report spending an average of 45 to 60 minutes on setup—but it only needs to be done once, as the game materials can be reused.
Each team, ideally consisting of two to five students, is provided a set of energy pieces, one game board, and one score card. The teacher will need a computer and projector to show the introductory slide presentation that explains the rules, and then to project the spreadsheet that will compute team scores at the end of each round. As the game can be played at a variety of levels, teachers may decide that students need more preparation to play more complex rounds. The game can be played in one 90-minute block period or two 45-minute periods.
Introduction of the game
To introduce the game, present students with the following problem: “You are an electricity company, and you are tasked with providing affordable and reliable electricity to your customers.” Explain that the game is based on a simple simulation of the US energy system, using values derived from actual costs of building and operating electricity-generating units. The purpose of the game is to help students understand the challenges and trade-offs involved in making energy and policy decisions.
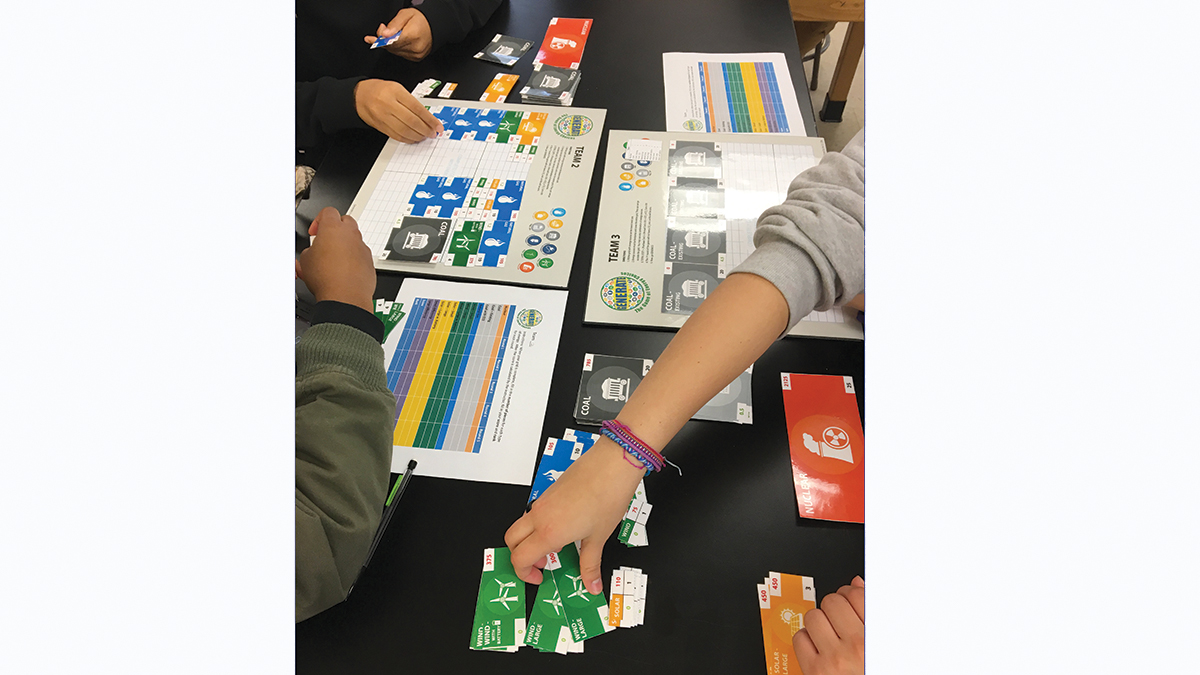
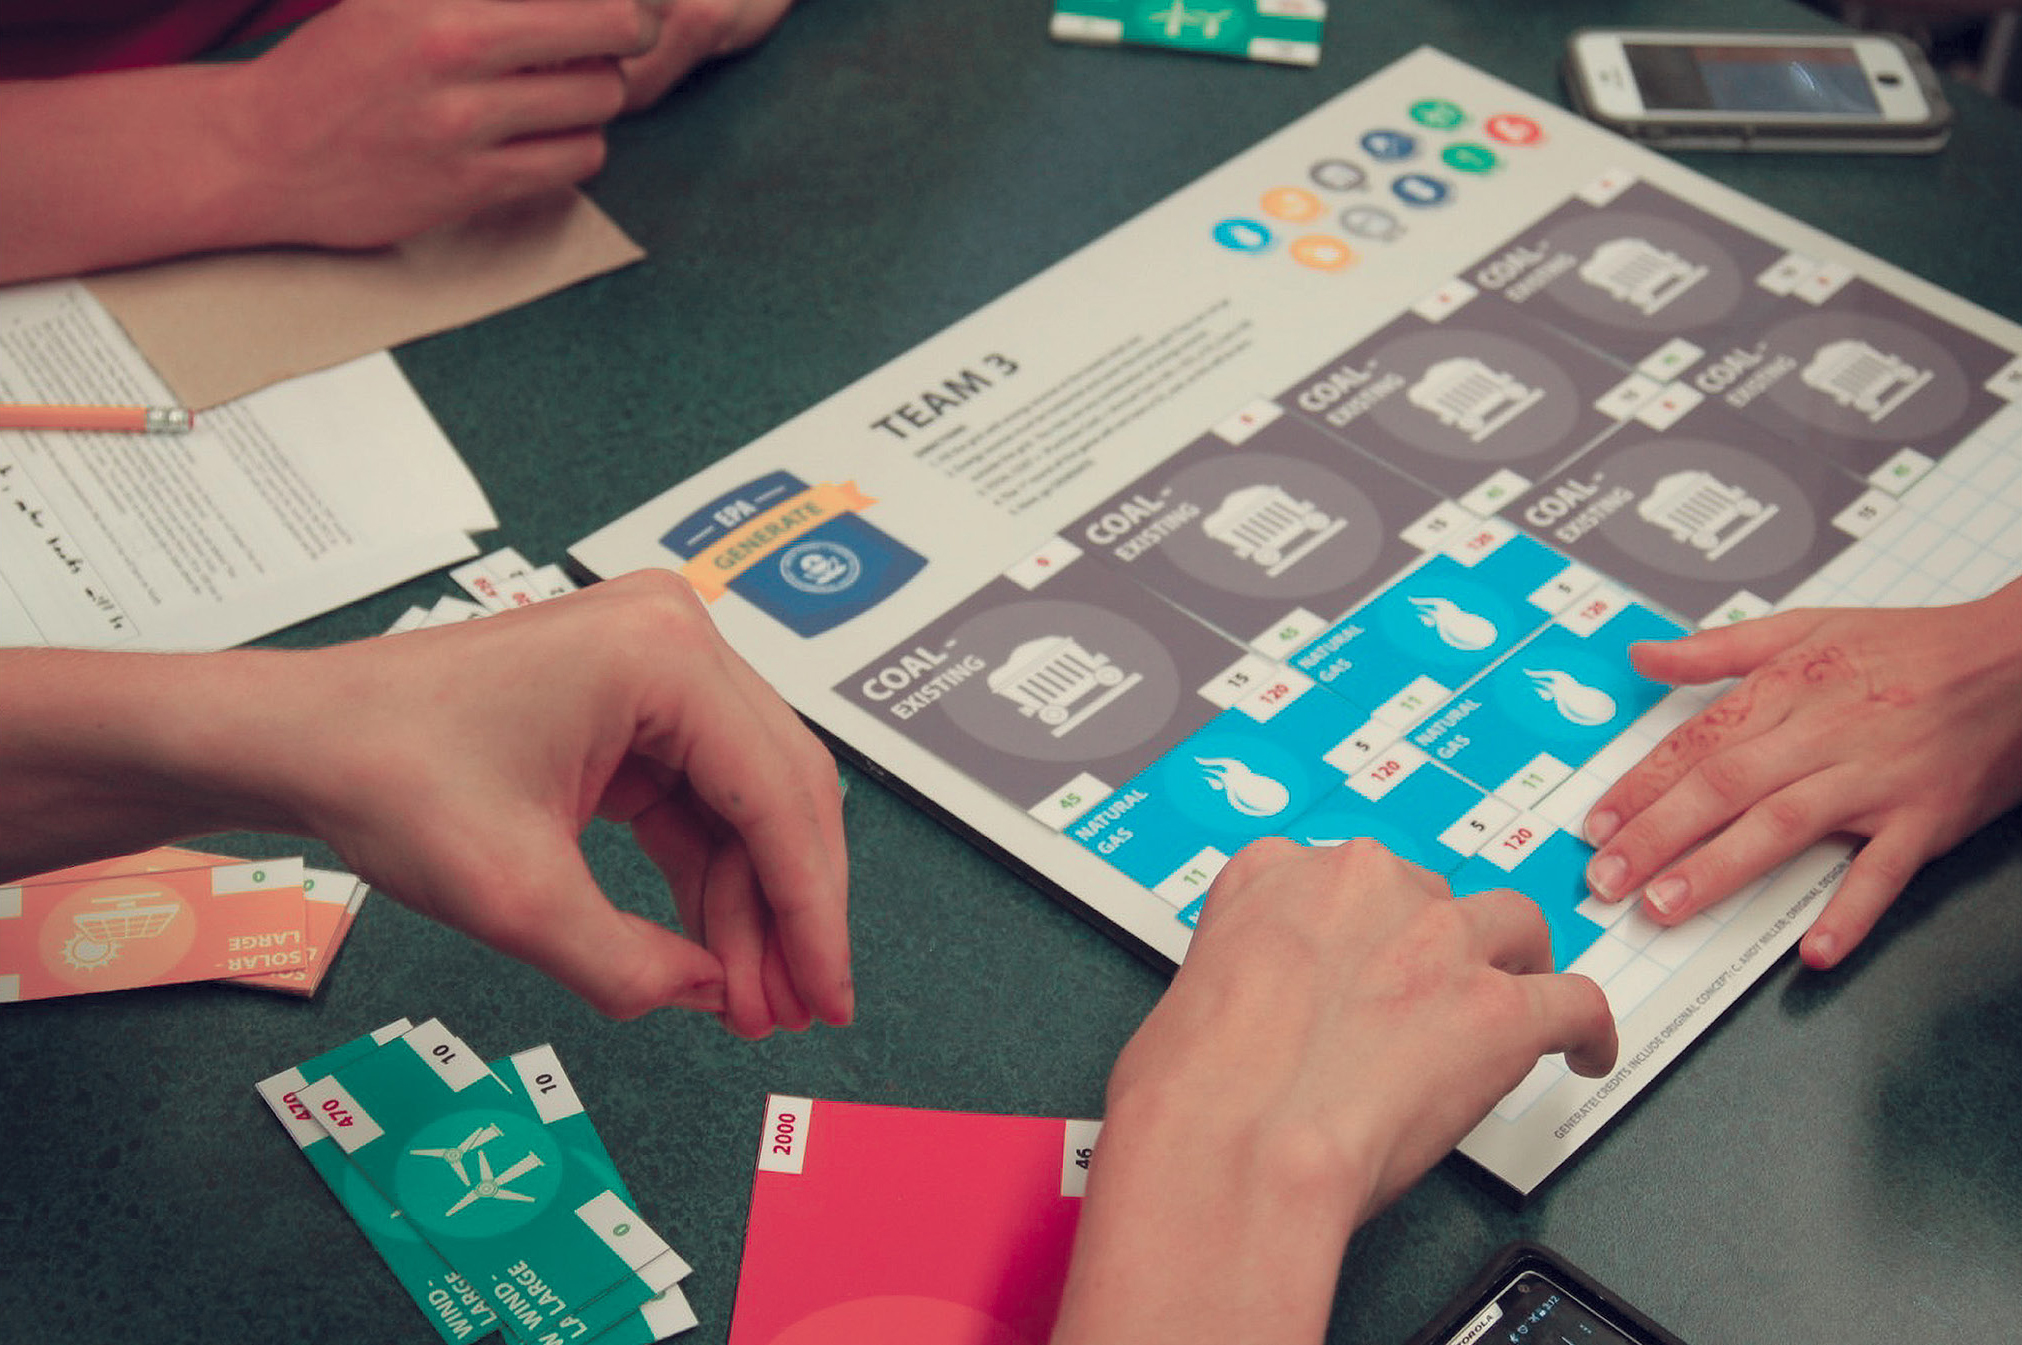
The game board. Each team has a game board that represents the electric grid; the same amount of total energy is needed to fill each board (Figure 1). The goal for each round is for students to completely fill the board (grid) with energy pieces to achieve the lowest score (cost) while fulfilling the parameters of that round. Game pieces may not overlap, and pieces may not extend past the grid or be placed sideways. A team’s score is determined by adding the one-time purchase cost, 30 years of annual operating costs, and 30 years of total CO2 costs (if applicable) for all the pieces on the board.
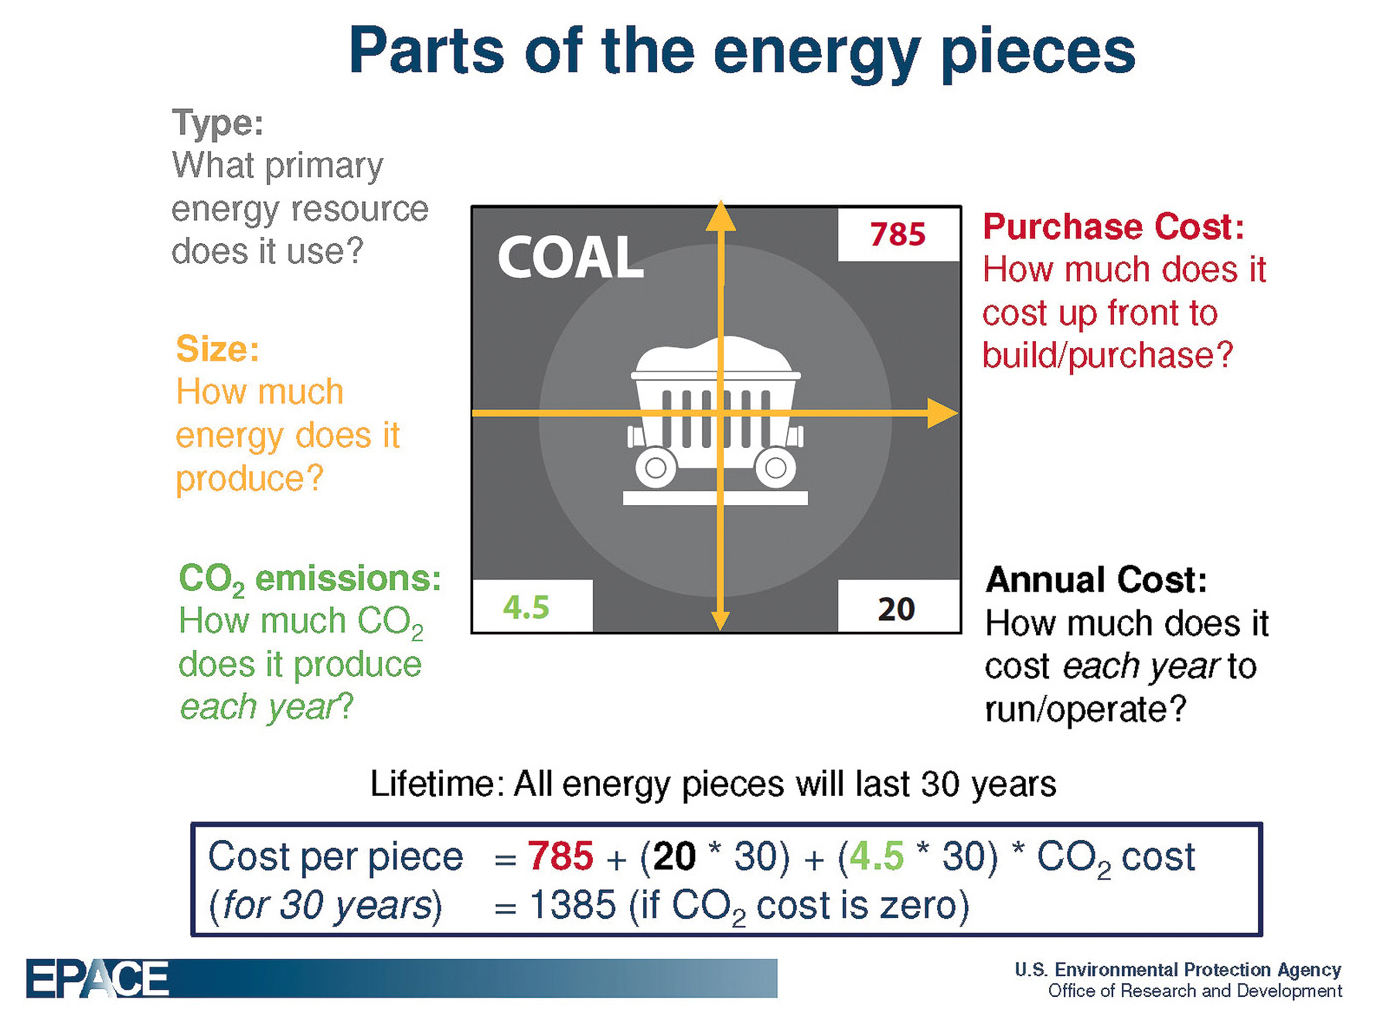
The game pieces. Teams do not have the same mix of energy sources, represented by energy pieces (Figure 2). The size of each energy piece is based on the amount of energy generated by the power plant represented on the card—for example, the nuclear piece is much larger than a solar energy piece. Each piece shows a one-time purchase cost, in red, located on the upper right-hand corner of the piece. This is the up-front, or capital, cost and is only counted once. The annual cost is noted in black in the bottom right-hand corner of each piece. This represents the costs for fuel and maintenance, and students will need to consider operating costs for 30 years. Finally, each piece has a green number in the bottom left corner to represent CO2 emissions. This number, like the annual cost, is multiplied by 30 years to calculate the CO2 cost. The CO2 cost represents a “carbon tax” and is used in rounds where the teacher has provided a CO2 multiplier.
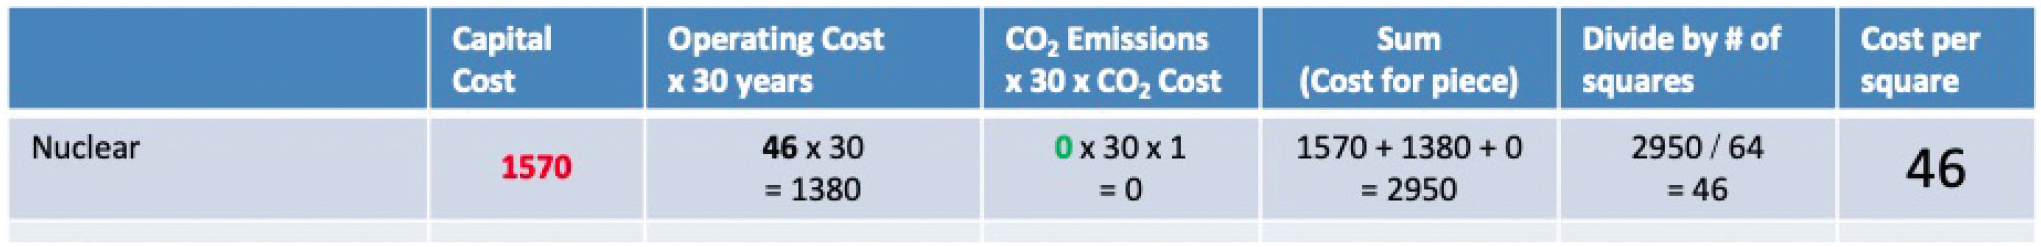
Though students do not need to explicitly calculate these costs in order to play the game, as it can be automatically computed in the scorekeeping spreadsheet, they are engaged in mathematical reasoning nonetheless. If more mathematical structure is desired, an extension is available in the form of a worksheet that gives students the chance to engage in formal mathematical calculations (Figure 3). Teachers should keep in mind that these calculations take time and would add to the overall time allowance for the game.
Playing the game
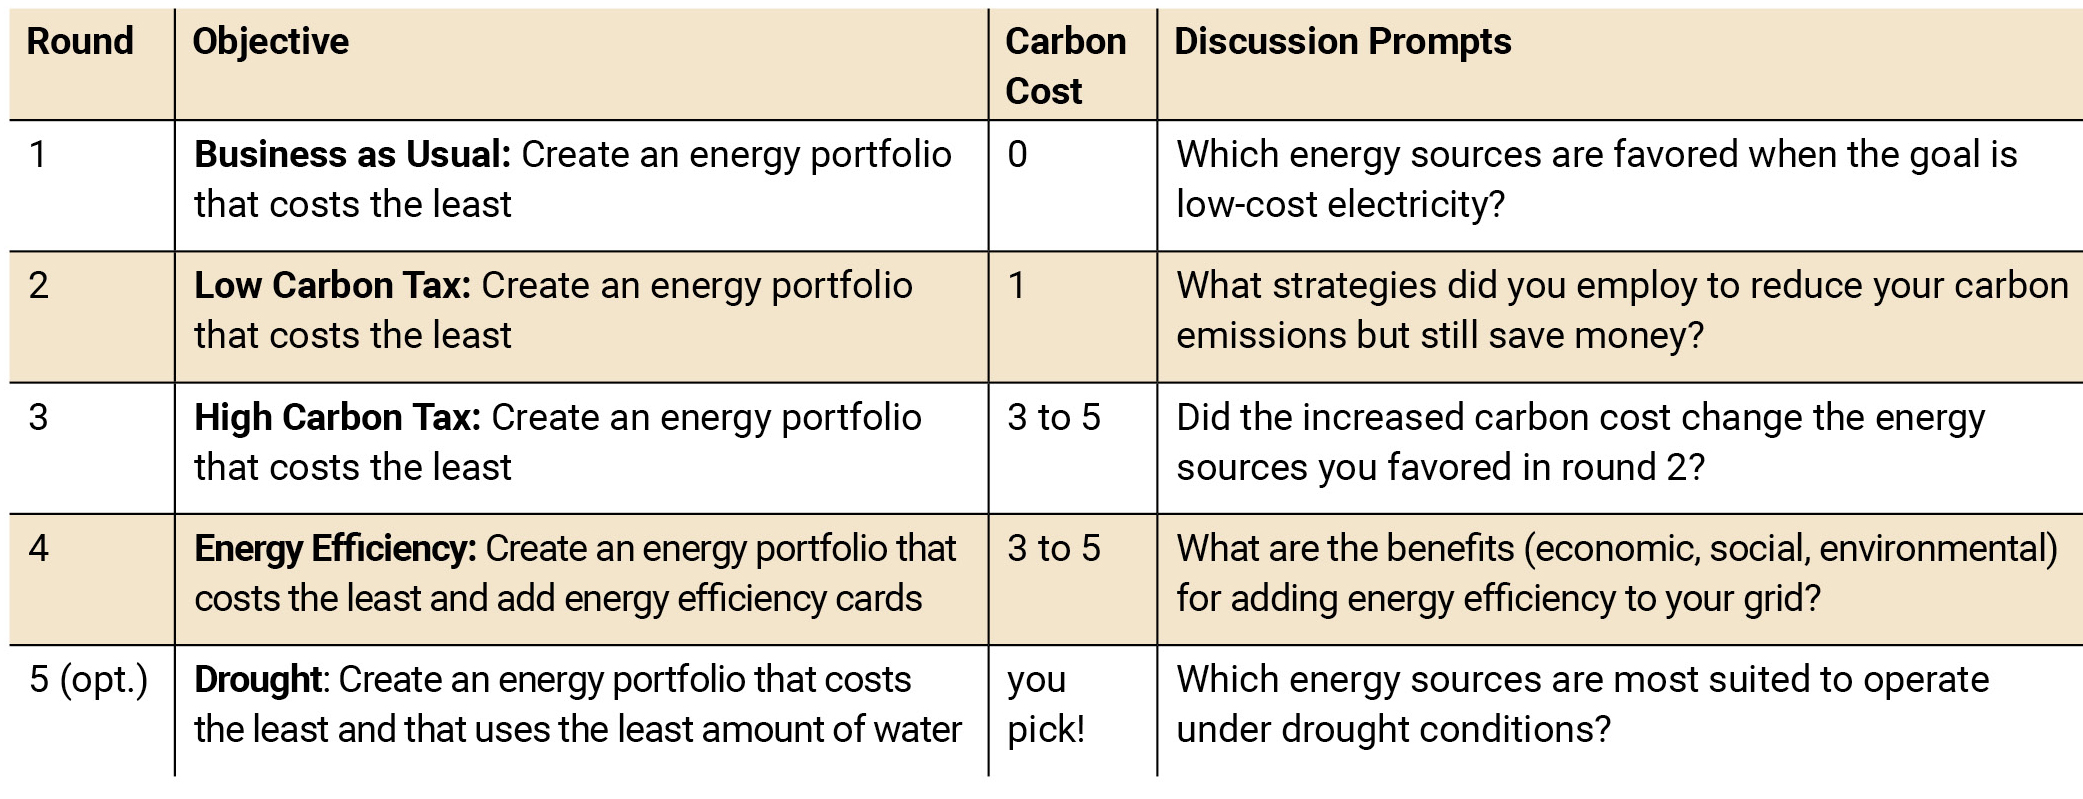
The goal of each round is to create an energy portfolio that costs the least, given the constraints of the round provided by the teacher. The different scenarios that can be offered to teams are outlined in Table 1. For each round, teams record how many pieces of each energy source they used to fill their board. The teacher inputs data from each team onto a spreadsheet that will compute total costs and rank each team by their overall score. Teams will be able to see how their grid model compares to others on the spreadsheet projected at the front of the class, and this visual will serve as the basis for discussion after each round.
Tips for debriefing after each round
Students should be able to support the energy choices they made either verbally or in writing so they can be prepared to contribute to discussions at the end of each round. Since teams have a different mix of energy sources, some teams might find it impossible to win certain rounds. At the conclusion of each round, teachers can prompt a discussion by asking the class which energy sources were utilized by the top scoring teams, which energy sources resulted in high costs or high carbon emissions, and which sources were not utilized and why. If this is a new topic for your class, consider giving students a reflection sheet to write out their reasoning for composing their grid for that round, and then start the discussion round by allowing each team to present their grid and justify their choices.
While each team has a different mix of energy sources to choose from, the size of their model grids are identical, enabling them to compare their grids in terms of cost, carbon emissions, etc. This variation provides teachers an opportunity to discuss how sources used to generate electricity vary in different regions of the country depending upon natural resource availability, energy policy, or public perception. For example, North Carolina has a disproportionately high number of solar energy facilities because of government policies such as renewable energy portfolio standards.
With round 1 challenging students to create a model grid at the lowest possible cost, the debrief should reveal to students that the cheapest energy sources are those that are carbon-intensive such as coal and natural gas. Once carbon costs enter the game in rounds 2 and 3, discussions can center around strategies teams used to reduce their CO2 emissions and which energy sources were selected to keep costs low. Existing coal power plants are still the cheapest option in round 2, but the addition of even a slight carbon cost makes nuclear power cheaper than coal and wind power more cost-effective than natural gas. The larger the carbon cost, the more beneficial it is to choose available renewable resources to make up the cheapest grid. As investing in energy efficiency is always cheaper than building a power plant, discussions during round 4 can expand upon the benefits (economic, social, environmental) of adding energy efficiency options to their grid.
Round 5 is an optional round that can be used to connect energy use with water consumption. Some power plants utilize water in the generation of electricity; in the spreadsheet each power plant has been given a water-use metric. It does not impact the price in the same way as the carbon tax, but the teacher can set a water limit to simulate drought situations, which can force students to make decisions about the energy sources they are currently using in hopes of designing a grid that is more resilient to drought.
How teachers are using the game
In spring of 2019, we surveyed 11 classroom teachers to gather insight into how they are integrating the game into their instruction. High school teachers report the game is most frequently used in Earth/Environmental Science courses, ranging from introductory to AP Environmental Science. It is also being used in physics and physical science courses, as well as in some middle school and college-level courses. Most teachers reported using the game successfully once per semester in class sizes ranging from 15 to 30 students. All of the teachers reported their students were more engaged in this activity than they were in their typical day-to-day classroom activities, with two-thirds of teachers reporting much higher student engagement.
When asked why they enjoy using the game, teachers noted that the game provides an engaging, hands-on competition that provides a break from the normal routine of their class. According to an Earth science teacher who regularly uses the game, “students enjoy the game, engagement is high, and without realizing it they learn a lot of information about different energy sources.” The game-based format allows for a competitive activity that draws students into an incidental learning experience.
As mentioned earlier, the grid is a complicated topic that can become cumbersome for students to understand. This game allows teachers to illustrate a difficult concept so that students can have an opportunity to engage in and experience this complexity. For example, one physics teacher noted that “Honors physics has a unit on energy, work, power, and impulse. The game takes the class away from the hard-core formulas and math for one class period, after we have completed the content of the unit, to apply energy concepts to real life energy choices.”
This engaging avenue to illustrate a complex topic also allows students to make nuanced connections to real-world issues. “Students often learn about renewables and get the impression that we should just switch over completely to one or two of these types of energy production. This game lets them see that generating electricity is much more nuanced and requires a very diverse energy portfolio. [...] they can see how cities, counties, and states might struggle to determine what type of energy production is best for their residents.” Connecting the grid to students’ actual experiences allows them the chance to engage in brainstorming how best to serve their communities, while understanding the costs inherent in such decisions.
Assessment
Formative assessment can be included during gameplay by leading a class discussion or by allowing each group to describe their decision-making out loud to the class after each round. Students should be expected to share their justifications for choosing the energy sources they did. They should be able to explain which aspects of their energy source made it ideal for that round, whether this was the low startup cost, low maintenance cost, or low cost of carbon taxes due to lower carbon emissions. Since teams are given variations on the types of energy sources to choose from, this time gives each group a chance to compare their choices and think about whether they’d have made similar choices if given the chance. This assessment allows teachers to evaluate what students know and are learning about the energy sources and the grid, and gives students the chance to verbally process their knowledge and learn from their peers along the way.
The most common form of summative assessment reported by teachers is collecting student scorecards and asking students to reflect on the energy choices they made through a writing assignment. Both formative and summative assessment strategies present opportunities for students to engage in the science and engineering practices of using models, computational thinking, and communicating information. Students are using the mathematical model they’ve refined to support their explanation of how the grid can be optimized, and in general to analyze and support the best design choices for the energy sources comprising the electric grid. While explaining the benefits of their design system and discussing with classmates, students are learning to communicate their scientific and technical knowledge.
Extensions
The instructor’s guide provides extension activities and options for differentiation that can be used to adapt the game to each teacher’s instructional goals. To connect the game to the dynamics of the local electric grid, students can investigate the energy sources used in their state or region (see Online Connections).
Conclusion
This interactive board game effectively engages students in the often-complicated decision-making process as they start to understand the trade-offs involved in providing affordable electricity while protecting the environment. Thus, this game provides an opportunity for students to begin to visualize the electric grid that is the undercurrent of modern society. ■
Acknowledgments
The authors would like to acknowledge Rebecca Dodder for her work on developing the game and reviewing this manuscript and the NC Energy Literacy Fellows who shared how they use Generate in their classes.
Online Connections
Game materials, including instructor guides: https://www.epa.gov/climate-research/generate-game-energy-choices
Energy sources by state/region: https://www.eia.gov/beta/states/overview.
Emma Refvem (ejrefvem@ncsu.edu) is a Science Education PhD Student at NC State University in Raleigh, NC, and Dana Haine is the K–12 Science Education Manager for the Center for Public Engagement with Science at the University of North Carolina at Chapel Hill’s Institute for the Environment and Director of the NC Energy Literacy Fellows Teacher Professional Development Program.
Environmental Science Instructional Materials Lesson Plans Mathematics Science and Engineering Practices STEM High School