
Research Worth Reading
Cycles in Motion: Visualizing Change With Spatial Thinking
By Katie Stevenson, Becky Dupuis, Ben Gold, and Kristin Gagnier
Posted on 2025-11-14

Disclaimer: The views expressed in this blog post are those of the author(s) and do not necessarily reflect the official position of the National Science Teaching Association (NSTA).
Understanding cycles, from the flow of matter and energy through ecosystems to carbon exchanges between Earth’s spheres, is essential across all areas of K–12 science education. Yet for many students, these abstract, dynamic processes are difficult to grasp. That’s when spatial thinking skills can make a powerful difference. Spatial thinking refers to one’s skill at visualizing, describing, and reasoning about how things are arranged, move, and transform in space and time. These skills help students comprehend and make sense of complex scientific processes that are otherwise hard to observe.
The carbon cycle, for example, involves movements and transformations that span space, time, and multiple Earth systems. Because students can't directly observe carbon moving from a tree to the air or sinking into the ocean, they need tools to visualize and mentally track these changes. Spatial thinking helps students organize this complexity. When supported by well-designed visual models and paired with science and engineering practices like developing explanations or analyzing data, spatial thinking empowers students to build accurate mental representations of how elements like carbon move and transform, deepening their understanding of cycles and the core science ideas behind them. In this blog post, we’ll explore practical ways educators can integrate spatial thinking tools and strategies into cycle-focused instruction to support student engagement and conceptual learning from elementary through high school.
We use spatial thinking every day: whether we’re packing a bag, searching for something inside it, navigating with a map, using a diagram to understand a process, or imagining how to rearrange furniture. These everyday skills are also essential in science, technology, engineering, and math (STEM), when students often need to reason about spatial relationships to make sense of complex ideas. Research shows that students with strong spatial thinking skills are more likely to choose STEM majors in college and succeed in STEM careers (Wai et al. 2009). Even by age 13, students with higher spatial abilities tend to enjoy STEM classes more, stick with STEM subjects, and go on to make meaningful contributions, like earning patents or publishing research (Shea et al. 2001; Kell et al. 2013). Importantly, these outcomes hold true even when accounting for other academic skills like math and verbal reasoning, showing that spatial thinking plays a distinct and powerful role in long-term STEM success.
The good news is that spatial thinking can be taught. Research shows that spatial skills are malleable: Training can lead to lasting and transferable improvements (Uttal et al. 2013). Students have improved their spatial reasoning through both direct practice, like mentally rotating objects or judging depth, and indirect experiences, such as building 3D models in class or playing spatially rich video games like Tetris. Stronger spatial skills, in turn, lead to better STEM outcomes, from early elementary students to adults (Cheng and Mix 2014; Sorby et al. 2013).
The following sections offer practical strategies for supporting spatial thinking while teaching about cycles across grade levels, from lower- and upper-elementary to middle and high school.
If You’re a Preschool or Lower-Elementary Teacher
Butterfly life cycles are a standard topic for young learners from preschool to second grade. The butterfly life cycle is often introduced through literacy lessons and may include linear diagrams or simple cut-and-paste sequencing activities. Two common examples are shown below.
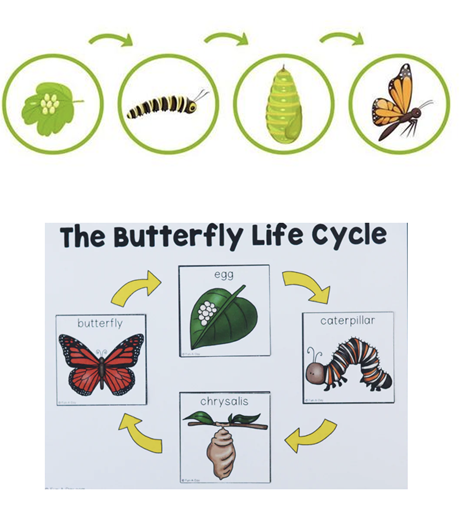
A typical explanation might sound like this: “Here is the life cycle of a butterfly. First, you start with an egg, then it becomes a caterpillar, then a chrysalis, and finally, a butterfly.” While this is accurate, it omits important spatial language, like where things happen, how the stages are connected, or how the organism changes physically, which can lead to confusion or shallow understanding.
By adding spatial thinking strategies, teachers can give a richer, more visual explanation. For example,
“An adult butterfly lays a tiny white egg on the surface of a green leaf. That’s the starting point of the life cycle. When the egg hatches, a caterpillar crawls out and begins to eat the leaf around it. As it eats and moves, it grows larger and longer. When it’s fully grown, the caterpillar forms a chrysalis around itself, hanging from a branch. Inside the chrysalis, it transforms into a butterfly. When it’s ready, the butterfly emerges and flies off to lay eggs of its own, starting the cycle all over again.”
Using spatial language, like on the leaf, around itself, inside, and emerges from, helps students picture the process and understand how each stage connects to the next. This turns the life cycle into a meaningful story, encouraging both scientific understanding and spatial thinking.
If You Teach Upper-Elementary Grades
As students build a deeper understanding of food chains and food webs, it’s important that they move beyond simply knowing who eats whom. To meet science standards, they need to understand how matter and energy move through ecosystems, and that requires spatial thinking.
Diagrams, like the food chain one below, are often used to support this understanding.
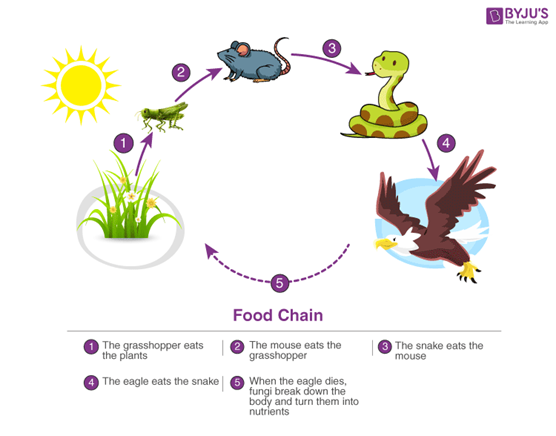
A typical explanation might sound like this: “The grasshopper eats the grass, the mouse eats the grasshopper, and the snake eats the mouse.”
While this shows the sequence of consumption, it misses the critical scientific concepts of matter and energy flow, which are essential for helping students think about how living things grow, survive, and interact within ecosystems.
By using spatial descriptions, teachers can make this concept clearer and more meaningful. For example, “In this food chain, matter moves from one organism to another. The grasshopper gets matter from the plant to help it grow and survive. When the mouse eats the grasshopper, it takes in that matter. The arrows in the diagram show the direction the matter is moving. If we follow the arrow from the mouse to the snake, we can see that the snake takes in matter from eating the mouse. This movement of matter helps keep ecosystems balanced and living things growing.”
Using spatial language, such as from, to, through, and direction, helps students visualize and understand how matter flows in an ecosystem. This makes complex diagrams and scientific ideas more accessible, especially for multilingual learners or those who may feel less confident in science.
If You Teach Middle School Science
- In middle school, students begin exploring complex scientific cycles that explain how the world around them works. One such process, photosynthesis, can be especially challenging to grasp. To support student understanding, it’s essential to pair clear, intentional language with an understandable visualization, two of which appear below.

A typical explanation of these visuals might sound like this: “Plants take in carbon dioxide and give off oxygen, and animals breathe in the oxygen and give off carbon dioxide.” While this is partially accurate, it oversimplifies the process and omits an important concept: the transformation and storage of energy within the plant.
By using spatial language paired with visuals, teachers can guide students through a more complete explanation. “In the air, carbon is found in the form of a gas called carbon dioxide. During photosynthesis, plants take in carbon dioxide and use it, along with water and sunlight, to make a type of sugar called glucose. This glucose serves as food for the plant and a way to store energy. When animals or people eat the plant, they use the carbon in the glucose for energy. Then, through respiration, they release carbon dioxide back into the air. That carbon can then be used again by plants, continuing the cycle.”
This kind of explanation, supported by well-labeled diagrams and spatial language like into, within, through, and back to, helps students visualize where carbon moves, how energy is stored, and how the cycle continues. It also makes the abstract nature of photosynthesis more concrete, especially for students who struggle with scientific vocabulary or who benefit from visual learning.
If You Teach High School
High school students are expected to integrate complex concepts across scientific disciplines and reason across scales, systems, and time. A key topic at this level is the carbon cycle, which connects processes such as photosynthesis, respiration, decomposition, and combustion across ecosystems and Earth systems. Students are expected to trace carbon atoms as they move through the atmosphere, biosphere, geosphere, and hydrosphere, an interdisciplinary task that draws on biology, chemistry, and Earth science.
To do this effectively, students must use spatial thinking to visualize how matter changes form and moves across different locations and scales. These abstract ideas can be especially challenging, which is why visual representations (as shown above) are essential tools for supporting student understanding. However, common instructional prompts, such as “Carbon is found in our ecosystem and is constantly changing from one form to another. Look at the diagram and explain how the carbon cycle works," often oversimplify the process. This kind of explanation may skip over critical ideas, such as where carbon is stored, how it moves, and in what forms. As a result, students may rely on surface-level vocabulary from the diagram without developing a deeper conceptual understanding of the cycle itself.
Using spatial language, teachers can enhance student understanding of the diagram by explaining the following. “Carbon is found all over Earth, in the air, in plants and animals, and in soil, as well as deep underground in fossil fuels like coal and oil. While the total amount of carbon on Earth stays the same, it constantly moves and changes form. This is called the carbon cycle. We can track where carbon is found and how it moves by using this diagram:

• Carbon exists in the atmosphere as carbon dioxide (CO₂).
• Plants take in CO₂ during photosynthesis. When animals eat plants, the carbon moves into their bodies.
• When organisms die, decomposers break them down and return carbon to the soil and atmosphere.
• Over millions of years, some dead organisms become fossil fuels like coal, oil, and natural gas.
• Burning fossil fuels releases stored carbon as CO₂, adding more carbon to the atmosphere.
When too much carbon accumulates in the atmosphere, it traps heat and contributes to climate change. Understanding where carbon goes, and how it moves, helps students see how Earth’s systems are deeply connected. This spatial explanation helps students understand how carbon moves through Earth's systems by highlighting where it's stored, how it moves, and in what form. Using spatial language like into, out of, stored, and released allows students to better trace carbon’s path through the atmosphere, oceans, land, and living things. Encouraging students to use gestures and drawings, like hand motions or sketches showing movement, helps students visualize the cycle and connect abstract processes to real-world actions. This deepens understanding of both short- and long-term carbon storage and shows how human activities impact the system locally and globally.
Cycles are central to science learning at all grade levels, but they can be hard for students to grasp. Spatial language that describes where things are, how they move, and how they relate in space, paired with visualizations, can make these complex processes clearer by showing how things move and change across time and space. When teachers use visual models and spatial language to teach about cycles, from butterfly life cycles to the global carbon cycle, they help students build deeper, more lasting understanding.
Send questions and/or comments to Kristin Gagnier (kgagnier@anlar.com).
Note: This post is part of Research Worth Reading, our quarterly blog series highlighting recent science education research with practical, classroom-focused applications. Stay tuned for future installments.
The mission of NSTA is to transform science education to benefit all through professional learning, partnerships, and advocacy.