
iPad Science Exploration: Visualizing Brainwave Entrainment
By Martin Horejsi
Posted on 2012-10-24
Brainwave entrainment or “brainwave synchronization,” is any practice that aims to cause brainwave frequencies to fall into step with a periodic stimulus having a frequency corresponding to the intended brain-state (at least according to Wikipedia).
I have a fascinating App on my iPad called simply Headache. It’s introduction in the App Store reports, “Advanced Brainwave Entrainment is used to synchronize your brainwaves to deeply relaxing low-frequency alpha, theta and delta waves to help provide headache relief through deep relaxation. “
For $0.99, I downloaded the App to play with it.
Right away I could tell it was tapping into something inside my head. It was hard to explain, but perhaps a picture would help. Visualization is an important variation of communication, and as they (whoever they is?) say, a picture is worth a thousand words.
The Wikipedia entry provides two graphics of interest in my exploration; Monaural beats and Binaural beats.
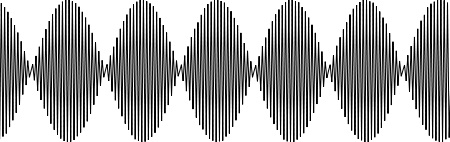 Monaural Beats
 Binaural Beats
Monaural beats, again according to Wikipedia, are derived from the convergence of two frequencies within a single speaker to create a perceivable pulse or beat.
On the other hand, Binaural beats are “perceived by presenting two different tones at slightly different pitches (or frequencies) separately into each ear. This effect is produced in the brain, not in the ears as with monaural beats.”
So if I understand this correctly, monaural beats are heard with the ears, while binaural beats are heard with the brain. WOW! I guess that explains why I could feel the sound in my head, not just heard it with my ears.
In order to “picture” the sound (I bet there’s no noun I can’t verb), I needed to be able to capture an image of the sound both as a traditional recording of compression and rarefaction of air, as well as the sharper vibrations moving through solid materials.
The movement of air was easy. I just propped up a mic next to the Bluetooth speaker I had paired to my iPad and used GarageBand to record the audible sound. Garage Band gave me both a picture and a sound file that you can listen to here: brainwave entrainment.
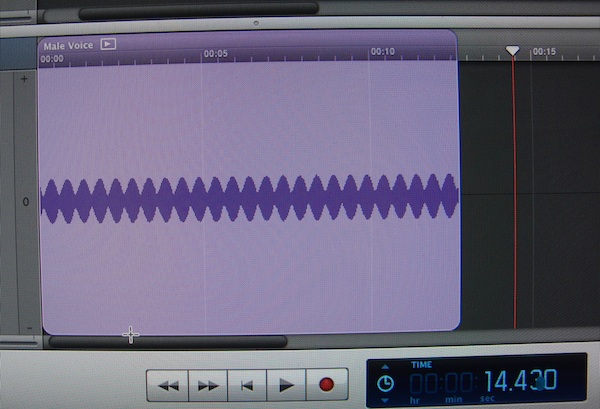
A visualization from GarageBand of the sound file available above.
But I wanted something more dynamic. Something that gave me more of a real-time image of what was happening at the exact moment I was hearing/feeling it. Not that there is a delay with GarageBand, but I wanted something more like how a seismograph presents a graphic showing the subtleties of vibrations as I was hearing them (or not hearing them since subsonic frequencies are part of the Headache App’s equation. As “they” say, there’s an App for that, and it’s called iSeismometer. And it’s free.
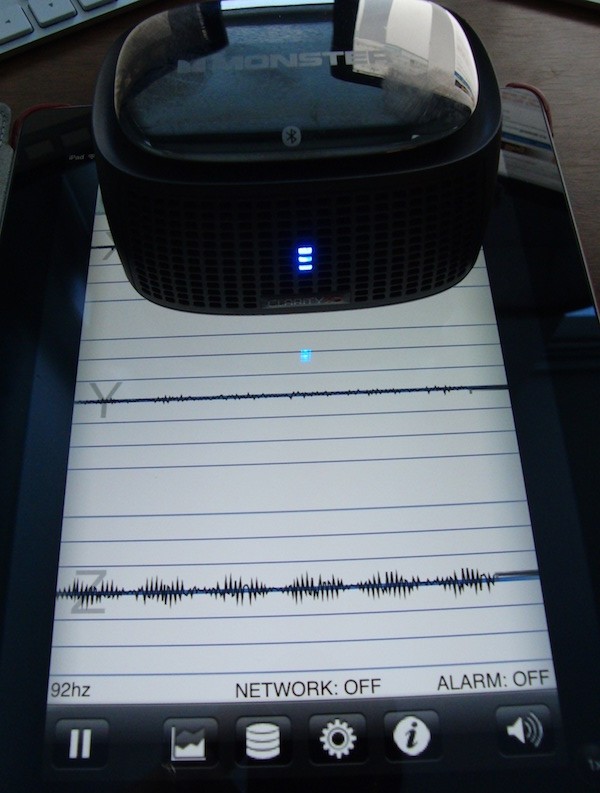
The iPad screen shows the visualization that the App iSeismometer shows for the signal. The bluetooth speaker is sitting directly on the iPad screen thus vibrating the iPad and its built-in accelerometers. Note that only the z-axis contains the beats.
With Headache running through the speaker, and the speaker sitting on the iPad screen, iSeismometer displayed the sound, which, interestingly, was almost all in the Z-axis of motion (but I suspect that is just a function of the interaction of the speaker and its placement on the iPad’s glass screen).
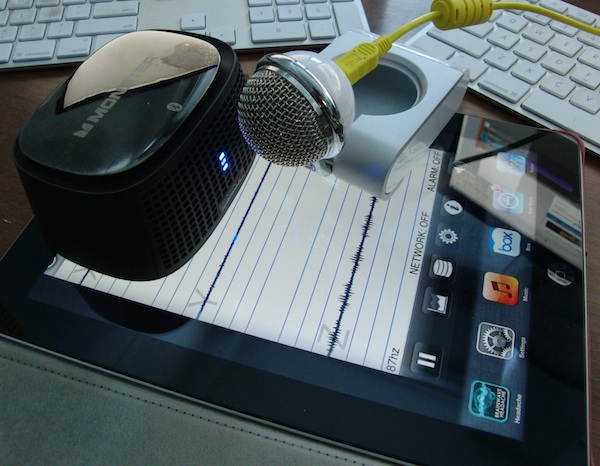
The speaker on the left emits the audio signal from the Headache Relief App (icon visible in the lower right) while a microphone records the sound from the speaker for import into GarageBand.
As usually happens, more questions were generated then answered. Right now, I’m wondering if I could match light output and frequency cycling with the sound to create a stronger inner-brain visual effect. But what if the light and sound were slightly out of phase? Could a seizure be induced? I once had a dog that would have a seizure about six hours after being exposed to flashing police or fire engine lights. And we all remember the famous scene in the movie The Andromeda Strain. But I digress.
A big unknown here is the stereo vs. mono issue. Headphones are distinctively stereo. Although a single speaker may project in stereo, the App iSeismometer might only be able to detect a single channel sound thus combining both of the signals that make stereo into a single mono visualization. Unless, the z-axis phenomenon is involved. Hmmm. More questions.
In the end, however, I think the main takeaway from this 30 minute desktop science exploration is that devices like the iPad have tremendous potential in the science classroom. Far beyond the keyboards and covers that often dominate tablet discussions in education.
Disclaimer: The views expressed in this blog post are those of the author(s) and do not necessarily reflect the official position of the National Science Teaching Association (NSTA).