

 Join
JoinFrom Chalkboards to AI
From Scatterplots to Stories: Uncovering Patterns in Messy, Real-World Data Sets
By Christine Anne Royce, EdD, and Valerie Bennett, EdD, PhD
Posted on 2026-07-21
Disclaimer: The views expressed in this blog post are those of the author(s) and do not necessarily reflect the official position of the National Science Teaching Association (NSTA).
For generations, the traditional science classroom included a process for organizing data. Teachers either had students collect data, which is still an important process to learn, or handed students a carefully curated and potentially sanitized table of numbers. The variables were tidy, anomalies were conveniently scrubbed, and the resulting line graph was likely a predictable straight path that confirmed a law of physics or a known chemical reaction.
But scientists who have done fieldwork, managed a laboratory, had a seemingly infinite number of rows of data on a spreadsheet, or looked at the natural world know a fundamental truth: Real science is messy.
When we protect students from that messiness, we inadvertently short-circuit the most vital element of the Next Generation Science Standards: Sensemaking is the active, sometimes frustrating, but deeply rewarding process of figuring out how the world works.
The sheer scale of real-world data, of course, has always presented a logistical nightmare. If you hand a classroom full of high school biology students a spreadsheet containing 300,000 rows of raw citizen-science observations, the process of analyzing the data can stop learning before it starts. The cognitive load shifts entirely to fighting with spreadsheets, fixing broken cell formulas, and chasing formatting errors. The actual science gets buried under a mountain of data management.
This situation is exactly where artificial intelligence (AI) transitions from being a novelty into becoming a cognitive partner. By offloading the mechanical, tedious tasks of data cleaning and code writing to an AI assistant, students can free up their mental bandwidth for evaluating trends, asking deep questions, and uncovering the scientific “story” hidden within the numbers.
The Sensemaking Framework: Moving Beyond the “Cookbook” Graph
When students use AI as a computational assistant, they are no longer just passive graph-makers—they become lead investigators. They are applying the Science and Engineering Practice of Analyzing and Interpreting Data as well as engaging with the Crosscutting Concept of Patterns. In this approach, the learning experience can be divided into a distinct three-step instructional scaffold.
Step 1: Confront the chaos and deal with the data.
The routine begins with letting students experience the sheer scale of authentic field observations. When they open a raw, unedited .csv or .txt file containing thousands of rows of environmental monitor data, they are immediately confronted with the reality of professional science. They see missing data points, mixed formatting, and an overwhelming volume of numbers. What becomes the criteria for handling and being confronted with real data that are not perfect? This initial exposure can lead to a great discussion and establishes a genuine need to organize, sort, and look for structure.
Step 2: Use AI as the computational partner.
Instead of spending three class periods learning about advanced Excel formatting, students use an AI data-analysis engine (such as Claude’s Projects, ChatGPT’s Advanced Data Analysis, or Google Gemini’s Data Analyst). By engineering specific, structured prompts, students instruct the AI to act as their data technician. The AI can inspect headers, clean up missing inputs, aggregate variables by specific parameters (like season or location), and render a clear and multi-axis visualization.
Step 3: Engage in the sensemaking process and share the story of the data.
Once the AI delivers the visualization, the true scientific work begins. The AI does not tell students why a trend exists or what environmental crisis is occurring. The students must analyze the resulting scatterplot, trace the anomalies, and bring their own scientific knowledge to the table. They evaluate whether the patterns represent a true cause-and-effect relationship or a simple correlation, using the visual narrative to construct a robust, evidence-based scientific argument.
Curated, Open-Access Repositories to Use in Your Classroom
To bring this strategy alive in your classroom tomorrow, you don’t need to generate mock data. The internet is filled with incredible, open-access repositories of raw data that professional scientists use every single day.
Here are four curated sources that are perfectly suited for AI-driven student sensemaking.
Citizen Science and Biodiversity Dynamics
For life science and environmental science classrooms, citizen-science networks provide unparalleled windows into ecosystem changes, population dynamics, and the impacts of human activity.
- eBird basic data set and Global Biodiversity Information Facility
- What they are: Massive, crowd-sourced repositories tracking bird sightings across the planet, comprising millions of rows of data that record specific species, counts, precise locations, observation dates, and localized environmental descriptors.
- The sensemaking opportunity: Students can download raw bird-count files for their specific state or county spanning the past 20 years. By passing these data to an AI, they can instruct the tool to filter for migratory species and isolate arrival dates over time. The students can then evaluate whether regional warming trends are shifting avian migration windows or altering localized biodiversity distributions.
- Note: Access to eBird requires a free eBird account and a quick submit request for research or educational data access.
- iNaturalist research-grade observations
- What it is: A verifiable, community-driven database of global plant, insect, fungi, and wildlife sightings, complete with accurate timestamps and GPS coordinates.
- The sensemaking opportunity: This resource is ideal for studying phenology (the timing of biological events). Students can isolate a raw regional data set to track the first flowering dates of native plants or the emergence dates of specific pollinating insects over a 10-year span. Sensemaking occurs when students use AI to cross-reference insect emergence data with plant flowering times, analyzing whether shifting climate patterns are creating ecological mismatches in their local community.
- Note: Access to iNaturalist requires you to sign up for a free account. The site has an iNaturalist Educator’s Guide.
Environmental Change and Weather History
For Earth science and physical science courses, tracking long-term climate cycles and water systems allows students to see how local micro-changes point to macro-level global transitions.
- National Oceanic and Atmospheric Administration’s National Centers for Environmental Information
- What it is: The premier repository for historical weather and climate observations, offering access to raw local climatological data gathered from municipal airports, marine buoys, and regional weather stations.
- The sensemaking opportunity: Students can pull an uncurated history file for a nearby weather station dating back 50 to 100 years. Instead of looking at a premade global warming chart, they can use an AI to parse their local data to calculate the exact number of days per year when temperatures exceed 90°F or to track the shifting date of the first killing frost of autumn. This approach makes climate science deeply personal, localized, and undeniable, grounded entirely in data from students’ own backyards.
- U.S. Geological Survey Water Data for the Nation and Historical Streamflow
- What it is: A comprehensive real-time and historical database tracking river discharge rates (cubic feet per second), gauge heights, water temperatures, turbidity, and chemical pollutants across thousands of U.S. waterways.
- The sensemaking opportunity: Students can access historical streamflow tables for a local river or creek during a major historical storm event. By instructing an AI to plot gauge height alongside total precipitation data, they can analyze the “lag time” of a watershed. Students must then make sense of why certain rivers rise rapidly while others take days to crest, directly connecting concepts of soil permeability, urban runoff, and watershed topology to the data curve.
Macro-Ecological and Planetary Scales
When studying large-scale planetary systems, students often struggle to comprehend events that occur over continents or decades. Planetary data interfaces help make these massive systems tangible.
- NASA Earth Observations and Giovanni
- What they are: Extensive archives of raw satellite telemetry matrices capturing atmospheric pressure, ocean chlorophyll concentrations, sea surface temperature anomalies, and aerosol optical depth.
- The sensemaking opportunity: The raw files from these portals are often presented as immense grids of geographic coordinates and numerical values that can look entirely incomprehensible to the naked eye. When students feed these raw satellite text matrices into an AI, they can ask the model to extract and plot a 20-year timeline for a specific latitude and longitude. Students can then look for massive cyclical patterns, such as the recurring signature of El Niño–Southern Oscillation cycles, and map those oceanic changes directly to shifting rainfall anomalies on land.
Designing the Right Guardrails
To ensure students remain the lead investigators rather than passive bystanders, teachers must establish firm pedagogical guardrails when integrating generative AI into data analysis. This is achieved by using structured prompt recipes that explicitly restrict the AI to technical assistant tasks, such as data cleaning and plot generation, while preserving the critical work of scientific reasoning and sensemaking for the student.
As AI continues to be a topic that is discussed and a tool to use, the primary goal must remain clear: The technology should never diminish the active role of student reasoning. AI should not be used to bypass the hard work of thinking; it should be used to clear away mechanical obstacles so deep thinking can happen.
When we pair AI with messy, authentic data sets, we give our students a new, real-world approach to sensemaking: the chance to work like real scientists. They learn to navigate ambiguity, look past statistical noise, and discover the elegant and interconnected narratives of the natural world.
The following video and audio synopsis of this blog were generated using Google NotebookLM's features. They have been reviewed for alignment to the blog and accuracy.
 Christine Anne Royce, EdD, is a past president of the National Science Teaching Association and currently serves as a professor in teacher education and the co-director for the MAT in STEM education at Shippensburg University. Her areas of interest and research include using digital technologies and tools within the classroom, global education, and the integration of children’s literature into the science classroom. She is an author of more than 140 publications, including the Science and Children “Teaching Through Trade Books” column.
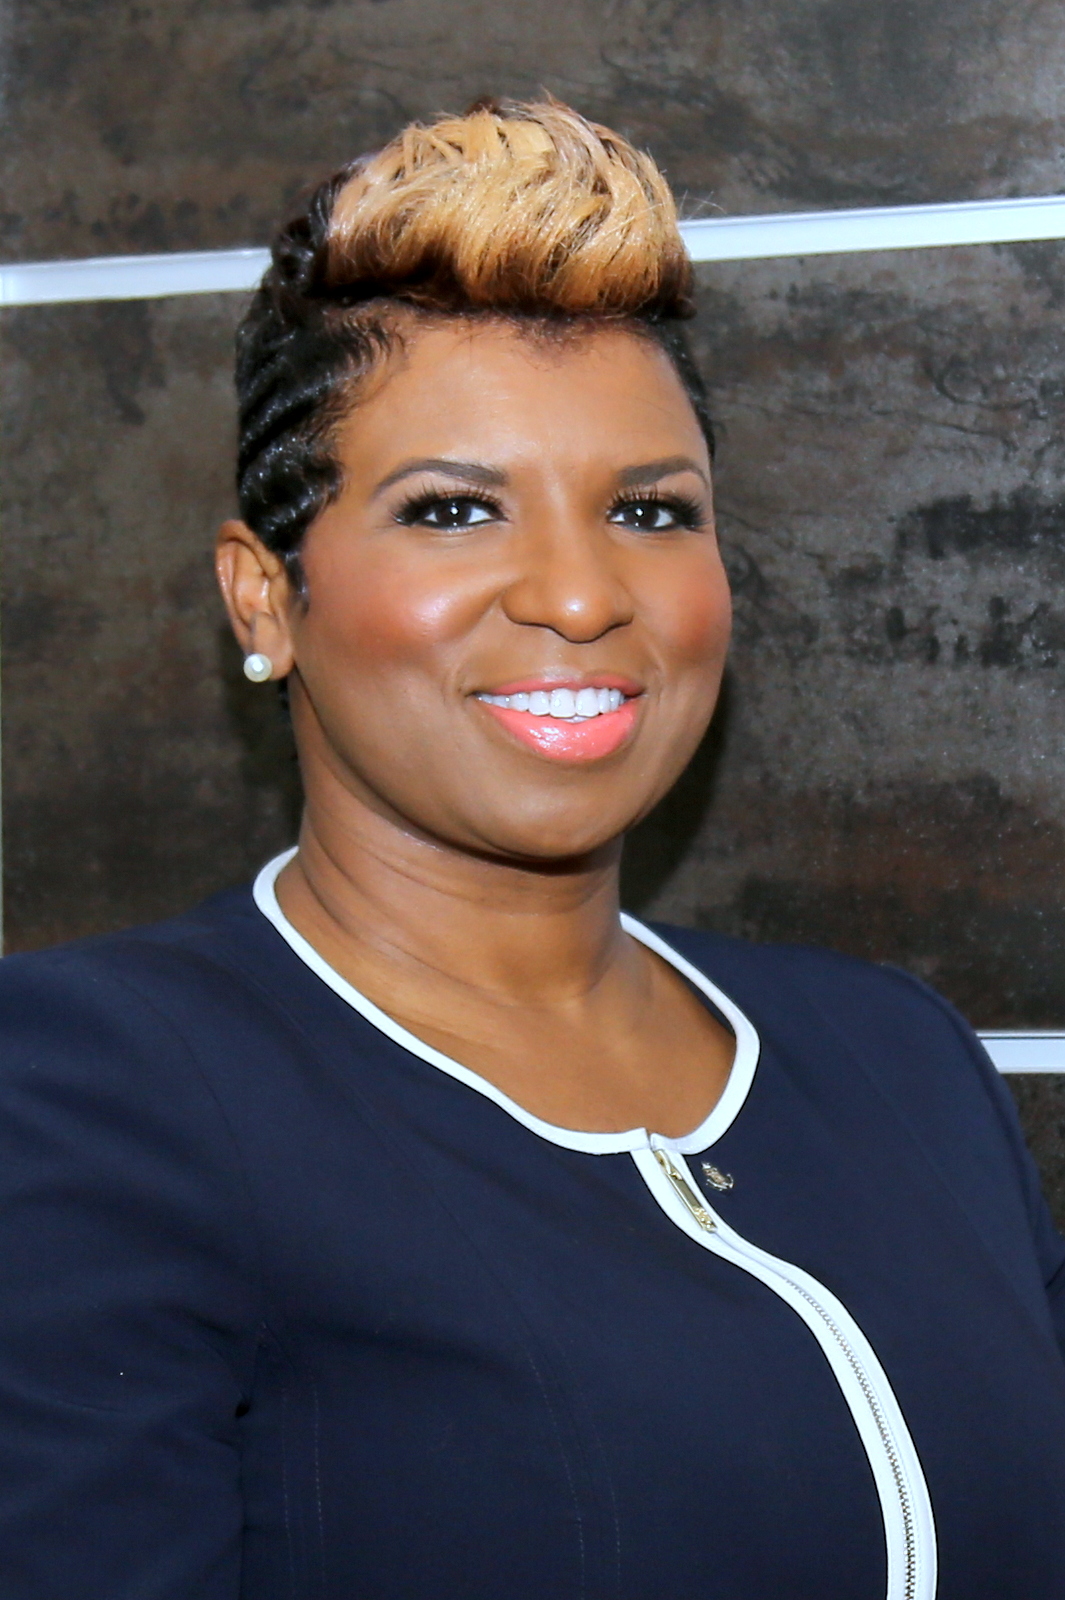 Valerie Bennett, PhD, EdD, is an assistant professor in STEM education at Clark Atlanta University, where she also serves as the program director for graduate teacher education and the director for educational technology and innovation. With more than 25 years of experience and degrees in engineering from Vanderbilt University and Georgia Tech, she focuses on STEM equity for underserved groups. Her research includes AI interventions in STEM education, and she currently co-leads the National Science Foundation Noyce grant, works with the Atlanta University Center Consortium Data Science Initiative, and collaborates with Google to address workforce diversity and engagement in computer science in the Atlanta University Center K–12 community.
This article is part of the blog series “From Chalkboards to AI,” which focuses on how artificial intelligence can be used in the classroom in support of science as explained and described in A Framework for K–12 Science Education and the Next Generation Science Standards.
The mission of NSTA is to transform science education to benefit all through professional learning, partnerships, and advocacy.