
STEM Sims: Data Visualization
By Edwin P. Christmann
Posted on 2017-05-04
STEM Sims: Data Visualization
Introduction
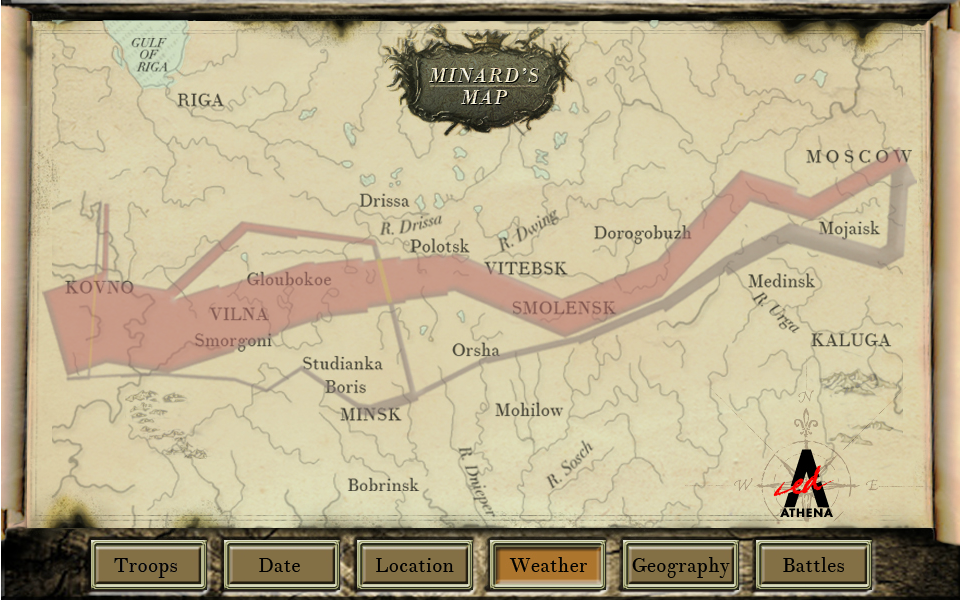
STEM Sims provides over 100 simulations of laboratory experiments and engineering design products for integration into STEM classroom instruction. One particular simulation found on this site, Data Visualization, stimulates the imagination of students by having them analyze a graphic representation of Napoleon’s 19th Century invasion of Russia. Using data provided in a 1869 graphic representation by Charles Minard, students are able to make decisions and investigate Napoleon’s military campaign. Moreover, Data Visualization is aligned with national (NGSS) standards (see below) and is compatible with state standards as well.
- MS-PS4.C – Information Technologies and Instrumentation
- MS-ESS2.D – Weather and Climate
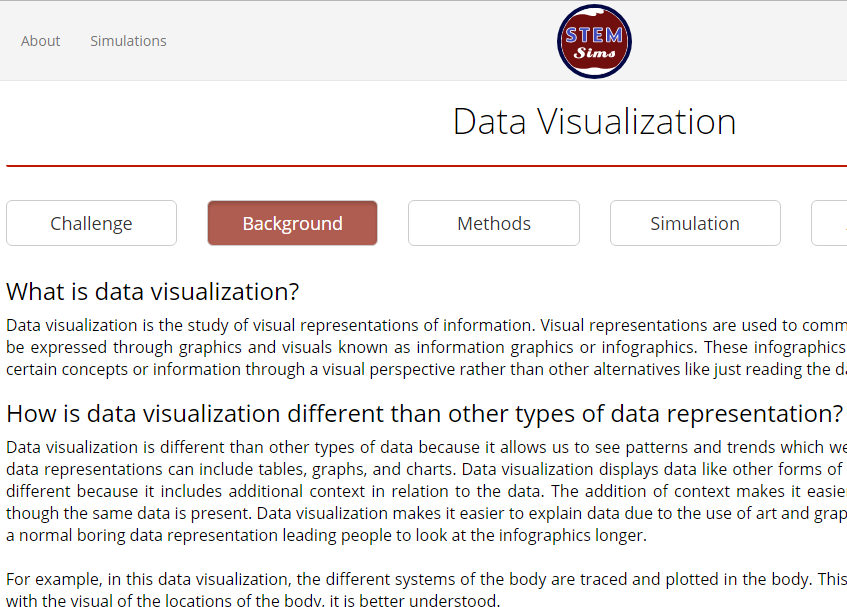
The simulation provides students with a brochure (see link below), a pre-assessment quiz, and introductory background information about the concepts of data visualization. The simulation offers students the opportunity to use data analyzation skills integrates mathematics/science and social studies content. Therefore, this activity allows science teachers to simulate Napoleon’s conquest via a problem-solving approach that evaluates ” how and why” his campaign failed. As has been the case with other STEM Sims activities, we found that higher levels of Bloom’s Taxonomy are applicable (i.e., Analysis and Evaluation), which makes this activity worthwhile for teachers who like to emphasize critical thinking in their classrooms.
Brochure: https://stemsims.com/simulations/data-visualization/brochure/brochure.pdf?version=2017-01-10
STEM Sims provides four separate lesson plans for this simulation (see links below); once again providing an excellent learning opportunity for students while minimizing the planning needed by teachers.
Lesson 1: https://stemsims.com/simulations/data-visualization/lessons/lesson-1.pdf?version=2017-01-10
Lesson 2: https://stemsims.com/simulations/data-visualization/lessons/lesson-2.pdf?version=2017-01-10
Lesson 3: https://stemsims.com/simulations/data-visualization/lessons/lesson-3.pdf?version=2017-01-10
Lesson 4: https://stemsims.com/simulations/data-visualization/lessons/lesson-4.pdf?version=2017-01-10
Conclusion
Data Visualization, much like the other STEM Sims activities, gives students the opportunity to learn authentic STEM instruction. Moreover, this simulation provides science teachers with an interdisciplinary approach for instruction that is motivating and exciting for students. Sign-up for a free trial and evaluate this simulation and determine where this simulation fits into your classroom.
For a free trial, visit https://stemsims.com/account/sign-up
Recommended System Qualifications:
- Operating system: Windows XP or Mac OS X 10.7
- Browser: Chrome 40, Firefox 35, Internet Explorer 11, or Safari 7
- Java 7, Flash Player 13
Single classroom subscription: $169 for a 365-day subscription and includes access for 30 students and 100 simulations.
Product Site: https://stemsims.com/
Edwin P. Christmann is a professor and chairman of the secondary education department and graduate coordinator of the mathematics and science teaching program at Slippery Rock University in Slippery Rock, Pennsylvania. Anthony Balos is a graduate student and a research assistant in the secondary education program at Slippery Rock University in Slippery Rock, Pennsylvania
Disclaimer: The views expressed in this blog post are those of the author(s) and do not necessarily reflect the official position of the National Science Teaching Association (NSTA).