
Research & Teaching
Exploring the Role of Student Seating Preference and Performance in a Large Introductory STEM Course
Where to Sit?
Journal of College Science Teaching—March/April 2023 (Volume 52, Issue 4)
By Chloe Wasendorf, Audrey McCombs, and Nancy Boury
Most introductory courses are held in large lecture halls, with students typically sitting in either the front, middle, or back of the classroom. In a mixed-methods study of student attendance, performance, and seat choice, we found that students who chose to sit behind their peers performed nearly a full grade level worse than their peers who sat in the middle and front of the classroom. They also attended class significantly less often than students in the front and middle of the room. Although students sitting in the back had worse performance in all five categories measured (attendance, unit exams, in-class work, final exam, and final course grade), these differences were eliminated by the mediating effect of attendance in all cases but those involving in-class work and unit exams. Students chose to sit where they did for diverse reasons. The results of this study demonstrate the relative importance of attendance and seat position on student performance in a large general biology course.
Several research groups have investigated the impact of location on student performance (Armstrong & Chang, 2007; Benedict & Hoag, 2004; Meeks et al., 2013; Perkins & Wieman, 2005; Pichierri & Guido, 2016; Tagliacollo et al., 2010). These studies vary greatly with respect to the course’s subject matter, the size of the classroom, and study design. Given this variation, it is no surprise that the literature regarding the effects of a student’s position on academic performance has inconsistent and sometimes contradictory results. Students sitting in the front of a large introductory physics class performed better than students in the back when the students were randomly assigned seats (Perkins & Wieman, 2005). Similarly, when students who preferred to sit toward the back of an economics class were moved closer to the front, they were 33% more likely than the students seated in the back of the room to receive an A (Benedict & Hoag, 2004). These studies support the advice that students should sit up front, regardless of their preference.
There is some evidence that seat position does not contribute significantly to student performance (Armstrong & Chang, 2007; Hammonds & Mariano, 2015; Kalinowski & Taper, 2007; Meeks et al., 2013). However, the majority of studies that report no relationship between seat position and student performance were conducted using smaller class sizes (fewer than 50 students), which is not representative of introductory science, technology, engineering, and mathematics (STEM) courses with large enrollments taught in large lecture halls. In a smaller class of 45 introductory biology students, the differences in performance between the front and the back of the room were negligible when students were able to choose their seating positions. Another study using many sections of similarly sized senior capstone classes in business demonstrated no difference in performance based on where a student sits in relation to the lecturer (Meeks et al., 2013). In a large (approximately 300 students) introductory biology course, students in the back of the room had lower test scores when they were able to choose their own seats. However, in sections where students were randomly assigned seats, this effect disappeared (Armstrong & Chang, 2007). The contradictory findings in the literature suggest that factors other than seating, such as attendance, may have an influence on student performance.
Students sit in the front, middle, and back of the classroom for a variety of reasons, including based on their friend group preferences, whether they want more or less attention from the instructor, and advice from others (Losonczy-Marshall & Marshall, 2013). Students’ ability to choose their own seat is important, as it is part of their environment structuring and self-regulated learning (Neuville et al., 2007). Attendance is related to seating position, with the students sitting in the back often attending class less frequently (Perkins & Wieman, 2005). Seating position is also related to student engagement and performance, as students sitting in the back of a large introductory accounting course received lower test grades and reported feeling less engaged and attentive in the classroom (Shernoff et al., 2017).
The relationships among seating position, attendance, and student performance are complex, and we are still working to understand how these relationships might be affected by the physical environment (e.g., size) of the classroom. In this investigation, we used data from 3 semesters of a large-enrollment introductory biology course in a mixed-methods study to answer the following questions:
- Is there a correlation between students’ position in the classroom and their performance in the course?
- Does attendance influence any differences seen among the positional groups?
- Why do students choose to sit where they do in a large lecture hall?
Methods
Demographics and classroom setup
We collected position and performance data over 2 semesters of an introductory biology class in fall 2016 and fall 2017. This class was taught using interactive lecturing techniques (Lawrence, 2019), with students spending approximately 30–40% of each class actively engaging with the material and their peers and 60–70% of the period in lecture. The classroom was equipped with double projectors, and the instructor frequently moved throughout the room, during both active engagement and lecture time. Together, the semesters ended with 445 students (265 in 2016 and 180 in 2017); however, 12 students (two in 2016 and 10 in 2017) opted out of the surveys. In addition, 45 students (29 in 2016 and 16 in 2017) were removed either because they failed to report their seat location or they frequently moved around the classroom and a preferred seat location could not be determined. After removing two outlier points from the 2017 data set, our performance analysis (Research Questions 1 and 2) utilized data from 386 students (234 in 2016 and 152 in 2017). We also gathered data on seat position reasoning (Research Question 3) from 207 additional students in fall 2019. The demographic composition of each class remained consistent for all 3 years, with each class being made up of approximately 34% male and 66% female students. Each class was predominantly white (69%), with Hispanic students making up 11%, Black and Asian American students each making up 4%, and 8% of the students identifying as multiracial or preferring not to self-disclose. Approximately 30% of the students in each year reported being first-generation college students, meaning that their parents had not obtained a bachelor’s degree. The three classes also had equivalent average ACT scores and were taught by the same instructor. The data in this study were collected in accordance with Iowa State University’s Institutional Review Board approval #18-247.
Data collection
We collected seat location data from in-class responses using Pearson’s Learning Catalytics personal response system. We split the class into three groups of students corresponding to each third of students sitting in front of (“front” group), between (“middle” group), or behind (“back” group) their classmates. Because the classroom did not fill the same way from one year to the next, the borders between front, middle, and back were determined based on the position of students relative to one another. Each group was divided to include full rows, so each represents approximately one third of the students in the classroom. Data on student position were collected at least once a week over the semester on randomly chosen dates, for a total of 20 times (44% of total class periods) in 2016 and 18 times (40% of total class periods) in 2017. Student location in the classroom was determined by where each student chose to sit most frequently, as some students chose to move during the term.
Attendance and performance
Attendance was collected over 40 days in 2016 (89% of total class meetings) and 29 days in 2017 (64% of total class meetings). We measured student performance in multiple contexts using high-stakes summative unit exam scores (four tests at 100 points each), final exam scores (one test at 50 points in 2016 and 80 points in 2017), low-stakes in-class clicker response points (105 in 2016 and 93 in 2017), and extra credit points, for a total of 570 points in 2016 and 650 points in 2017. Questions on unit exams were focused more on the details of the course material, and the final exam was broader and probed more conceptual understanding. The in-class clicker points were earned both individually (approximately 70%) and collaboratively (approximately 30%) each term.
Seat choice explanation
Students in the 2019 fall semester responded to three questions in an online after-course survey. Students were asked where they prefer to sit (front, middle, or back), where they sat that term, and what factors (up to three) influenced their seat choice. We independently coded and categorized the responses using themes based on the reasons previously described (Losonczy-Marshall & Marshall, 2013). We then compared and discussed the results until we reached consensus. Table 1 defines the themes used and provides examples of student responses within each theme.
Statistical analysis
As a preliminary step, we ran five regression models to investigate the relationships among assessment scores, seat position, and attendance as binomial generalized linear models using the “glm” function in R version 4.0.2 (R Core Team, n.d.). We converted raw score to proportion correct and raw attendance to proportion of days attended out of number of days attendance was collected. Response variables for each of the five regression models were the four assessment scores and attendance, and predictor variables were year, percentage of days attended (for the assessment models), and seating position, as well as all two-way and three-way interactions. Mean attendance for all students over both years was 83%; we report estimates from the R package estimated marginal means (version 1.5.1) calculated at 85% attendance (Lenth, 2020). We conducted a Type III analysis of variance (ANOVA) to test the significance of each predictor variable individually, and a Type I ANOVA to test the significance of seating position once the effect of attendance had been accounted for in the model.
Results from the generalized linear models suggested a possible mediating effect of attendance on assessment scores, so we decomposed the total effect of seating position using a mediation model in the R package mediation (version 4.5.0; Tingley et al., 2014). We used the “mediate” function to estimate three separate effects in the mediation model: total effect, direct effect, and mediation effect. The total effect is what we observed (i.e., seating position’s relationship to assessment scores). The mediation effect is the estimated effect of attendance shown in the observed relationship between seating position and assessment score (i.e., how much of the observed effect is due to attendance). The direct effect is the effect of seat position on assessment score minus the mediating effect of attendance (i.e., what remains of the observed effect after attendance is removed). We estimated these effects for all four performance measures and all three possible seating position pairs for each assessment; we therefore report 12 results. (See Figure 1 for visualization of the mediation model.)
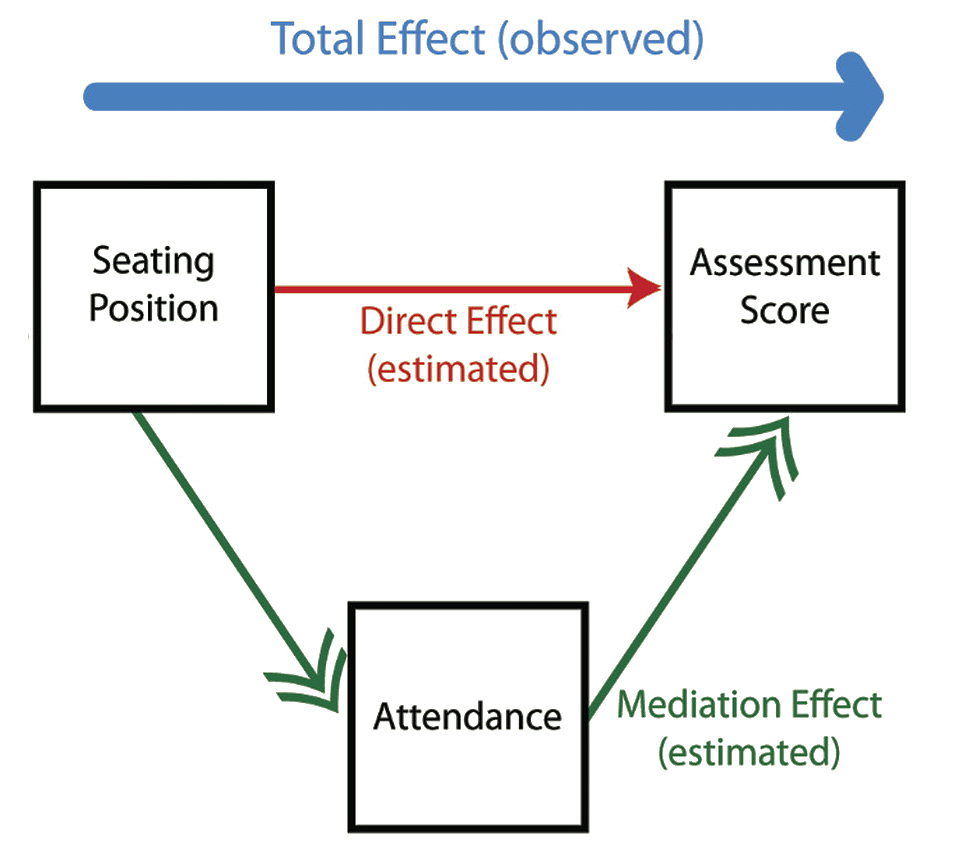
Mediation model visualization.
Note. Total effect is what we observe. Direct effect is the effect of the treatment on the response minus the effect of the mediator. Mediation effect is the effect of the mediator on the response. Direct + Mediation = Total.
Results
Lower scores for students sitting in the back
Attendance and performance values are displayed in Table 2. The students who chose to sit in the back of the class attended class significantly less frequently than students who sat in the front and middle. On average, students in the front and middle attended 86% and 88%, respectively, of the days that attendance data were gathered. By contrast, students sitting in the back of the lecture hall attended only 74% of those days. Although the performance data for all performance categories were quite variable, students in the back performed between 13% and 22% worse (odds ratios: 1.13 to 1.22) than students in the front and middle (data not shown). Students in the front and middle performed similarly in all four performance measures (Table 2).
Position effects mediated by attendance
All four assessments showed a significant mediating effect of attendance on assessment scores for students sitting in the back. The mediation model indicated that seating position was not significantly related to performance as measured by the final exam once the effect of attendance was accounted for (Table 3). Seating position did, however, have a significant effect on in-class work, even after the significant effect of attendance was accounted for in the model. Specifically, seating location contributed significantly to the change in classwork score when comparing front to back and middle to back, but not front to middle. Seat location also had a significant effect on the change in unit exam score and total course points when comparing front to back, but not middle to back or middle to front.
The strongest effects of seating position were seen in classwork scores, but attendance was more important than seat choice in all assessments. When looking at classwork points, we expected an average decrease of 15 percentage points when a student moved from front to back (e.g., if a student would have scored 90% on in-class work sitting in front, we expected that same student would score 75% when sitting in back). Of those 15 percentage points, 10 percentage points were due to the mediating effect of attendance, and 5 percentage points were due directly to the location change. The mediating effect of attendance accounted for 68% of the total score decrease. The mediation effect of attendance was significant in eight of our 12 results, with attendance accounting for between 51% and 72% of the observed difference in assessment score. Our analysis suggests that if a student sitting in the back increases their attendance from 80% to 90%, they are 53% more likely to answer a classwork question correctly; if attendance increases from 80% to 100%, the chances of a correct answer increase by 134% (odds ratio 90% to 80% attendance = 1.53, 100% to 80% = 2.34).
Different reasons for seat choice for groups
Students’ reasons for their choice of seat varied across position (Table 4), with certain themes being more prevalent for each position (Table 1). Students who chose to sit in the front did so because they were able to see and hear the professor or lecture materials (31.7%) and to ask questions and focus on the lecture (30.4%). Social connections (21.9%), pragmatic reasoning such as sitting near an exit or in a left-handed desk (16.9%), and seeing and hearing the professor or lecture materials (21.3%) were important to students who chose to sit in the middle of the classroom. Finally, students who chose to sit in the back reported peer avoidance (27.4%), pragmatic reasoning (20.7%), and seeing and hearing the lecture (17.8%) to be most important in deciding on a seat position. About 8% of students sitting in the middle and 10% of those sitting in the back reported avoidance of the professor as a reason for choosing a seat that was not in the front. The students in the back mentioned engaging with the course content (material and lectures) less than those sitting in the middle or front.
Discussion
Although previous studies have looked at the influence of seat position on performance in a variety of classrooms and subjects, many have found conflicting results. In general, studies summarizing data from large classrooms found a relationship between seat position and student performance, but studies in smaller classrooms did not (Armstrong & Chang, 2007; Hammonds & Mariano, 2015; Kalinowski & Taper, 2007; Meeks et al., 2013). Our study augments these findings by using a mediation model to examine the relationships among seat position, attendance, and student performance using both formative and summative assessments as measures of performance.
In answering our first question, our results suggest that the choice of seat position in a large, introductory biology class is correlated with differences in performance, which aligns with other studies conducted in large lecture halls (Benedict & Hoag, 2004; Perkins & Wieman, 2005; Shernoff et al., 2017). Students sitting in the back attended class significantly less often, and their observed performance was significantly worse in all four assessment categories than those who sat in the front (as measured by the total effect; Table 3).
Addressing our second question about attendance and performance, the linear regression model we used suggested a significant relationship between seating position and both student attendance and performance. Because variations in attendance could confound the effects of position, we extended the usual linear regression approach with a follow-up mediation model and found that when attendance is taken into account, the effect of seat position on performance is reduced or eliminated. Attendance had a larger effect on student performance than where students choose to sit in relation to their classmates, which may explain earlier work that eliminated the effect of seat position on performance by assigning seats (Perkins & Wieman, 2005). The use of a mediation model to investigate performance data in the context of both student position and attendance habits provides a more nuanced understanding of the overlapping factors associated with differences in student performance. Data from this mediation model demonstrate that most of the negative effects of sitting in the back are associated with differential attendance habits rather than seat position.
The level of each student’s motivation to engage with the course content, peers, and their instructor might be driving both seat choice and attendance, leading to our third question probing students’ reasoning for their seat choice. Previous research has shown that students sitting in the back are less engaged in the course, pay less attention in class, and have lower classroom self-esteem, and students in the front tend to feel less distracted (Shernoff et al., 2017). We identified several trends by qualitative analysis of responses in the front, middle, and back seating groups with regard to their reasons for their position choices (Table 1). Students sitting in the front reported wanting to understand the material and interact with the professor, and students sitting in the back were more concerned with avoiding other students and ensuring they have buffer seats around them. Students sitting in the middle did so to join their friends, making social connections a motivating factor. In short, the students in the front reported wanting to engage with the course material more than those sitting in the middle or the back.
Students who chose to sit in the front of the classroom gave more academic reasons for their choice, whereas those in the middle and back generally had nonacademic reasons. Our qualitative analysis helps contextualize the results of the mediation model and suggests that students sitting in the back are less engaged with the material. Approximately 30% of the classwork score reflects collaborative work in which students confer with peers sitting around them, and students must be in attendance to earn classwork points. It is unsurprising, then, that the strongest direct effect of seating position was on classwork scores, where students in the back may not only be less engaged with the material but also collaborate with peers who may also be less engaged or frequently absent from class.
The large classroom environment generates distinct populations of students with different motivations, and these motivations should be accounted for when faculty design course activities for in-class work. Attendance, desire to engage with the course content, and performance were all higher for the students who chose to sit in the front. Although seating position is not relevant for online courses, the student perspectives and motivating factors identified in this study may still be important in online courses, where student motivation and persistence are significant predictors of academic success (Wladis et al., 2014).
This study provides insights into how student attendance and seat position may be related to student performance, and we find these factors may be more intertwined than previously thought. The students who chose to sit in the back wanted less contact with their instructor, peers, and the course content. Given the lack of engagement, it is not surprising that these students also attended class significantly less often than their peers who sat in the front or middle of the room. More research needs to be done to investigate whether teaching interventions such as game-based learning, flipped classrooms, metacognition, and other evidence-based practices (Russell et al., 2016) can alleviate both position and attendance effects in lecture halls and if similar interventions would work in an online environment. The goal of such interventions is to encourage both attendance and engagement to maximize student opportunities for success.
Acknowledgments
This material is based on work supported by the National Institute of Food and Agriculture, USDA, Hatch project IOW04008, Accession # 1010715. We would like to thank ISU Honors student Claire Grebner for her help on this project.
Chloe Wasendorf (wasendorf@alfred.edu) is an assistant professor of biology at Alfred University in Alfred, New York. Audrey McCombs (audrey.mccombs@gmail.com) worked on this article while she was a doctoral student in the Department of Statistics, and Nancy Boury (nan1@iastate.edu) is an associate professor in the Department of Plant Pathology, Entomology, and Microbiology at Iowa State University in Ames, Iowa.
Assessment Pedagogy STEM Teaching Strategies