
Ideas and inspiration from NSTA’s April 2018 K-12 journals
By Mary Bigelow
Posted on 2018-04-17
Regardless of what grade level or subject are you teach, as you skim through the article titles, you may find ideas for lessons that would be interesting for your students or the inspiration to adapt/create your own.
For example, there are definite overlaps between the lesson ideas in Citizen Science and Real-World Connections. Many citizen science projects are appropriate for both elementary and secondary classrooms.
And take a look at NSTA’s online journal Connected Science Learning for more real-world and citizen science projects.
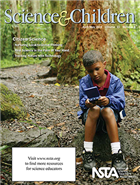 Science & Children – Citizen Science
Editor’s Note: Citizen Science “Citizen science opportunities provide real-life experiences that link what students are doing in school to what is happening in the world. They can feel a part of the effort to increase our knowledge about topics that impact their lives. This can be rigorous science reflecting what scientists do while also building solid disciplinary core ideas in the sciences…Students feel empowered with the ability to make a difference through citizen science projects and as a teacher you will likely to feel empowered as well.”
The lessons described in the articles have a chart showing connections with the NGSS and many include classroom materials, illustrations of student work, and photographs of students at work. They also include contact information on the Citizen Science projects used in the lessons.
- In addition to describing their community water quality project, the authors of Water Warriors note that “place-based environmental education and citizen science clearly work in conjunction to strengthen each other. The mix of student engagement and content mastery, while working with community partners, produces experiences that impact students’ lives for years to come.”
- Formative Assessment Probes: Uncovering Students’ Ideas About Watersheds would be a way to assess students’ prior knowledge before starting a water-quality project.
- Real Science in the Palm of Your Hand provides a framework to help teachers use citizen science resources for meaningful science learning in the three NGSS dimensions. (Take a look at a student project, too)
- Fourth graders mentor first graders through a project in Tracking Nature With Technology. The students participated in a bioblitz to study the diversity of the schoolyard using technology to record and send observations and photographs.
- Nurturing Local-to-Global Thinking demonstrates a multi-disciplinary activity in which third-graders combined environmental science, geography, reading, technology, and data analysis in comparing local and faraway places.
- Given A Global Perspective, students collect local soil samples as they share their own data, ask questions, and analyze data from different parts of the world.
- The Early Years: Introducing Children to Phenology has suggestions for experiences in which younger students make observations and collect data about their environment using cameras, drawings, and simple arithmetic. (Phenology–the scientific practice of observing and collecting information on the timing of life cycle changes in plants and animals)
- In addition to recommending trade books, Teaching Through Trade Books: Beneath Our Feet has two lessons (Engineering a City K-2) and Sketching the Sea Floor (3-5) that help students understand how changes on Earth occur over time and how humans have an impact on Earth systems.
These monthly columns continue to provide background knowledge and classroom ideas:
- Science 101: How Does a Thermos “Know” to Keep Hot Liquids Hot and Cold Liquids Cold?
- Science 102: Frozen Coke
- The Poetry of Science: Science Is Us!
- Methods and Strategies: Reading With a Purpose
- Engineering Encounters: The Giant Problem: Using design thinking to explore thermal conductivity
- Teaching Teachers: Learning From Failure
For more on the content that provides a context for projects and strategies described in this issue, see the SciLinks topics Biodiversity, Buoyancy, Conduction Convection and Radiation, Dynamic Earth, Heat and Temperature, Insects, Ocean Floor, Polar Climates, Soil, Soil and Climate, Water Erosion, Water Quality, Watersheds
Continue reading for Science Scope and The Science Teacher
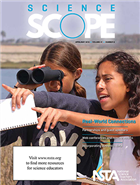 Science Scope – Real-World Connections
From the Editor’s Desk: Real-World Connections for Your Student Scientists Partnerships with scientists, real and virtual field trips, citizen science projects can make science students into student scientists. “Go beyond the typical lab and involve your students in collecting authentic data both in your own community and from all parts of the globe… Give students opportunities to be scientists and they will learn problem-solving skills, practice teamwork skills, and think outside the box. They will begin to make meaning out of their world and better understand nature, their bodies, and the universe.
Articles in this issue that describe lessons include a helpful sidebar (“At a Glance”) documenting the big idea, essential pre-knowledge, time, and cost; many follow a 5E format. The lessons also include connections with the NGSS, and many include examples of student work, assessments, and classroom materials.
- Citizen Science: Prepare an Ant Picnic for Science illustrates a real-world scenario as students explore the food preferences of ants and compare their data with that of citizen scientist around the world.
- Partnerships between scientists and student-scientists are the focus of two articles–Engineering Partnerships makes the connections between science and engineering in a study of deep-ocean hydrothermal vents. The Evolution of a Partnership shows a collaboration to use ongoing research to clarify evolutionary concepts. “Not all science takes place in a lab…sometimes scientists can sue naturally occurring ‘experiments’ to study how evolution takes place.” These articles have suggestions for finding research partners for your student-scientists.
- Bridging the Gap Between “Rocks for Jocks” and the Mars Sample Return Program has a 5E lesson to apply mineral identification process to rock samples from Mars.
- A field trip becomes An Ecosystem Experience, as student scientists apply math, modeling, and sampling to collect authentic data.
- Classic Lessons 2.0: What kind of person becomes a scientist?
- Disequilibrium: Inseparable Magazines describes a 5E lesson on friction using a discrepant event.
- Three articles this month have teacher suggestions for planning, implementing, and follow-up for guest speakers in the classroom: Science For All: Be Our Guest!, Listserv Roundup: Guest Speakers and Mentors for Career Exploration in the Science Classroom and Integrating Technology: Web Conferencing for Student Engagement
- Teacher To Teacher: Using Models to Explain Their Thinking suggests ways to overcome misconceptions students have about models and modeling in science.
These monthly columns continue to provide background knowledge and classroom ideas:
- Scope on the Skies: Gaining Insight Into Mars
- Teachers’s Toolkit: Communicate Effectively With Parents and Family Members Through a STEM Newsletter
For more on the content that provides a context for projects and strategies described in this issue, see the SciLinks topics Careers in Science, Ecosystems, Electron Microscope, Food Chains, Friction, Hydrothermal Vents, Identifying Minerals, Inner Planets, Insects, Migration, Photosynthesis, Predator/Prey
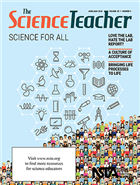 The Science Teacher – Science for All
Every April, this is the theme for The Science Teacher. As noted in the Editor’s Corner: Science for All these issues “have been providing teaching ideas and strategies to narrow the academic achievement gaps associated with ethnicity, socioeconomic status, gender, physical disabilities, limited English-language proficiency, and learning differences…The current issue adds to this literature with suggestions for engaging reluctant writers and tactics for creating a classroom culture that values LGBTQ youth.”
The lessons described in the articles include connections with the NGSS (including DCIs) and many include classroom resources and illustrations of student work.
- A Culture of Acceptance has suggestions for classroom management and language that includes LGBTQ students.
- Love the Lab, Hate the Lab Report? describes an alternative to traditional lab reports: an intervention lab report that includes mini-posters and presentations (similar to what we see at conferences!). The article has strategies to get all students participating.
- Bringing Life Processes to Life, especially for English Language Learners, is a challenge. The author provides examples of how to use models for topics such as DNA replication, transcription, translation, and other processes. Photographs illustrate the models, which can be helpful for all students.
- Students assume the role of regional planners as they investigate ways of Using the Land, looking at the pros and cons of development in terms of runoff, habitats, and environmental impact.
- Understanding Earthquakes integrates Model-Based Inquiry into a challenging study of earthquakes and related processes.
- Focus on Physics: The Slowing of Light in Glass includes a novel graphic model to help students understand a complex concept.
- Idea Bank: The Protein Résumé illustrates how to get students to create new ways to present information, rather than copy/paste from the Internet.
These monthly columns continue to provide background knowledge and classroom ideas:
For more on the content that provides a context for projects and strategies described in this issue, see the SciLinks topics Biomedical Engineer, DNA Replication, Earthquakes, Energy Transfer, Environmental Decision-Making, Land Use, Plate Tectonics, Proteins, Transfer of Sound and Light Energy, Transcription, Translation, Tsunamis
Regardless of what grade level or subject are you teach, as you skim through the article titles, you may find ideas for lessons that would be interesting for your students or the inspiration to adapt/create your own.
From Vision to Reality: Making the NGSS Come Alive in Every Classroom
By Carole Hayward
Posted on 2018-04-16
 The Next Generation Science Standards (NGSS) are ushering in an exciting new era of science education where three-dimensional learning integrates core ideas, science and engineering practices, and crosscutting concepts to deliver an education that prepares today’s students to become “effective, rational thinkers able to contribute to (and cope with) our complex and constantly changing societies,” writes Bruce Alberts in the foreword to NSTA’s new book, Preparing Teachers for Three-Dimensional Instruction.
Alberts, who serves as the Chancellor’s Leadership Chair for Science and Education at the University of California, San Francisco and is the President Emeritus of the National Academy of Sciences, acknowledges that the NGSS require substantial shifts in the way preservice science teachers are trained as well as to the professional development practicing science educators receive so that science educators can empower their students to become effective problem solvers who make wise decisions for ‘themselves, their families, and their nation.”
While the book’s primary audience is preservice education teachers, science education faculty and practicing K-12 science educators will also benefit from reading it. The instructional practices that K-12 science educators are using to unlock the vision behind the NGSS as well as the shifts being made to the entire field of science education—by higher education science faculty, science teachers, teacher education faculty, and others—are showcased in this book.
Five major sections organize the book’s 18 chapters which are written by outstanding classroom teachers and science educators at all levels:
Section 1
Shifts in Teacher Knowledge and Practice: Models of Teaching to Meet the Intent of the NGSS
Some of the nation’s most outstanding science teachers share how they are using three-dimensional strategies in their classrooms as they transition their teaching of science from inquiry to science as practice. NGSS-aligned curriculum planning and methods of assessment are also addressed in this section.
Section 2
Professional Development Strategies That Support the Implementation of the Framework and the NGSS
Examples of professional development strategies to help K-12 science teachers address specific subject matter as well as proven instructional activities that promote critical thinking and depth of understanding are covered in this section.
Section 3
Teacher Preparation Courses for Preservice Teachers
The nation’s future science teachers need to be equipped with the knowledge and tools to design lessons, assessing students, implement strategies, and evaluate outcomes. This section discusses ways higher education faculty are supporting future teachers’ understanding of three-dimensional learning by giving them opportunities to build capacities and demonstrate their knowledge as they construct explanations, analyze and interpret data, develop models, and engage in argumentation from evidence.
Section 4
Undergraduate Science Course for Preservice Science Teachers
Future science teachers cannot embrace the paradigm shift called for by the NGSS if they have never seen models of context and content in their undergraduate science courses as well as in their teacher education preparation programs. Higher education instructors, in this section, describe some of the changes they made as well as the challenges they have encountered in revamping their teaching techniques.
Section 5
Epilogue: Three-Dimensional Instruction Beyond the Classroom
Teachers know that it takes business-education partnerships to ensure that K-12 students are obtaining the skills and knowledge they need for success in higher education and the workplace. This section explores the work of East Tennessee State University’s (ETSU) Center of Excellence in Mathematics and Science Education as well as ETSU Northeast Tennessee STEM Hub. Guidance is also provided in this section for leaders to use in forming new partnerships, establishing shared goals, and encouraging ongoing contributions to meet those shared goals.
Book editor Jack Rhoton, in the preface, acknowledges the “daunting, complex, and time-consuming task” of fully implementing the vision of the NGSS.
“There is no magic wand for achieving the vision. Instead, educators will need to apply a variety of approaches and efforts over an extended period of time. We believe that the contents of this volume will serve as a motivating resource for the science education community that helps them to harness skills, expertise, and passion as they look to revitalize science instruction.”
Read the free sample chapter to learn how the authors engaged preservice teachers in evidence-based augmentation and helped them assess their own science content knowledge, augmentation skills, and ability to plan instructional activities centered on augmentation.
Making the vision of the NGSS come alive in every K-12 science education classroom will take more than teachers just reading the new standards and aligning their content to the curriculum. This book supports students in becoming true practitioners of science by supporting the transition away from formulaic classroom instruction that far too many students continue to experience.
This book is also available as an e-book.
Follow NSTA
 |
 |
 |
 |
 |
The Next Generation Science Standards (NGSS) are ushering in an exciting new era of science education where three-dimensional learning integrates core ideas, science and engineering practices, and crosscutting concepts to deliver an education that prepares today’s students to become “effective, rational thinkers able to co
Homework Conundrum
By Gabe Kraljevic
Posted on 2018-04-16

A colleague and I were wondering what type of homework works best for our students? How do we hold them accountable?
— N., California
In general, you have to be flexible and adapt to your classes. Different courses, units, and students will create different conditions for homework to be useful. Topics like balancing equations, math/physics word problems, genetics crosses, and others that follow an algorithm require practice and repetition. Projects that require more time than you can afford in class also can be done at home. Give students time in class to get their feet wet in a topic while you are there to provide support. This time is critical to ensure that the students understand what they are taking home and that you know where they are in their understanding.
Varying your approach will keep students on their toes. You can sometimes just do a check, other times collect homework papers and grade them. I often asked students to pull out their homework and I just walked around, giving them a small mark for completion. I might even give them partial credit for partially completing homework!
There are some concerns with work completed outside of class: students may copy from others; parents or siblings may ‘unteach’ your lessons; and students may have little free time outside of school. To mitigate these concerns, I rarely gave daily homework and almost never asked for work to be done in one night. This reduced pressure to copy, allowed students to plan around activities and time to ask me questions.
Hope this helps!
Photo Credit: Tony Alter from Newport News, USA
A colleague and I were wondering what type of homework works best for our students? How do we hold them accountable?
— N., California
April brings "real science," Citizen Science Day, and Earth Day
By Peggy Ashbrook
Posted on 2018-04-13
Citizen Science Day is April 14, and these projects are a wonderful way for young children to continue their science learning by being part of a larger science effort doing “real science.” (For the record, I think the observations and thinking young children do is real science, the beginning of making sense of natural phenomena.) One citizen science project is the Pieris Project, named after the Latin name of the Cabbage white butterfly, Pieris rapae.
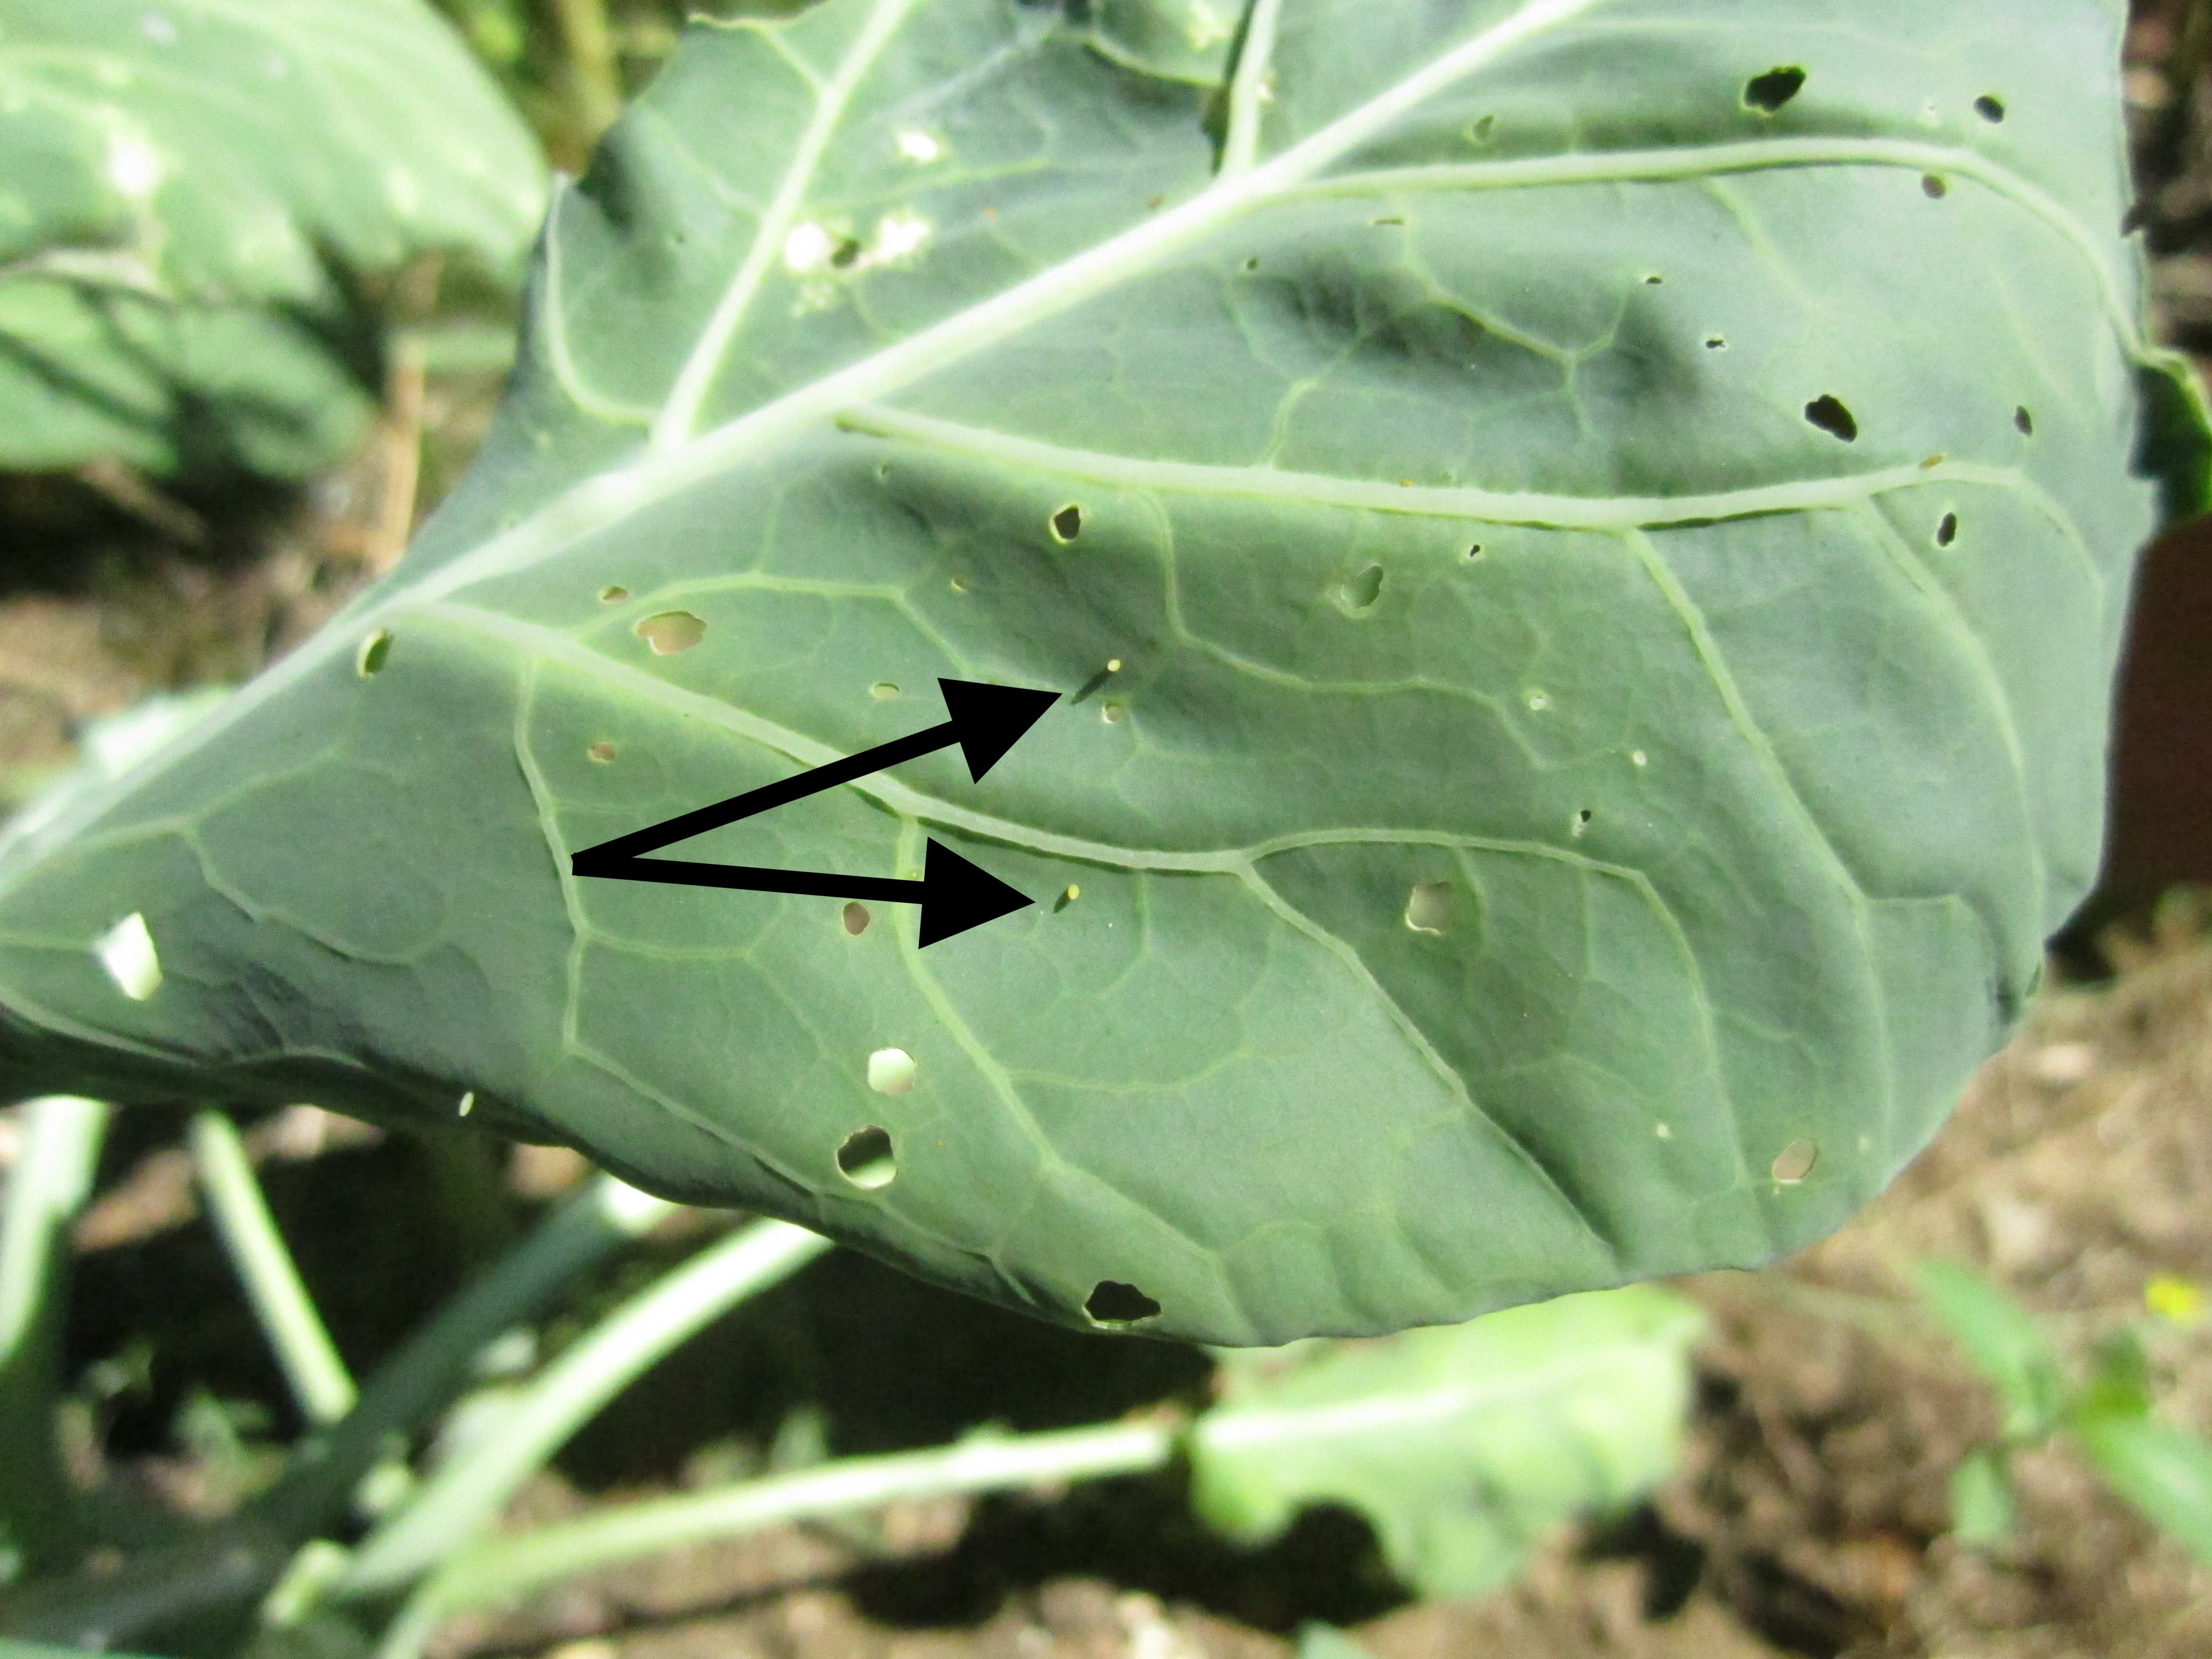
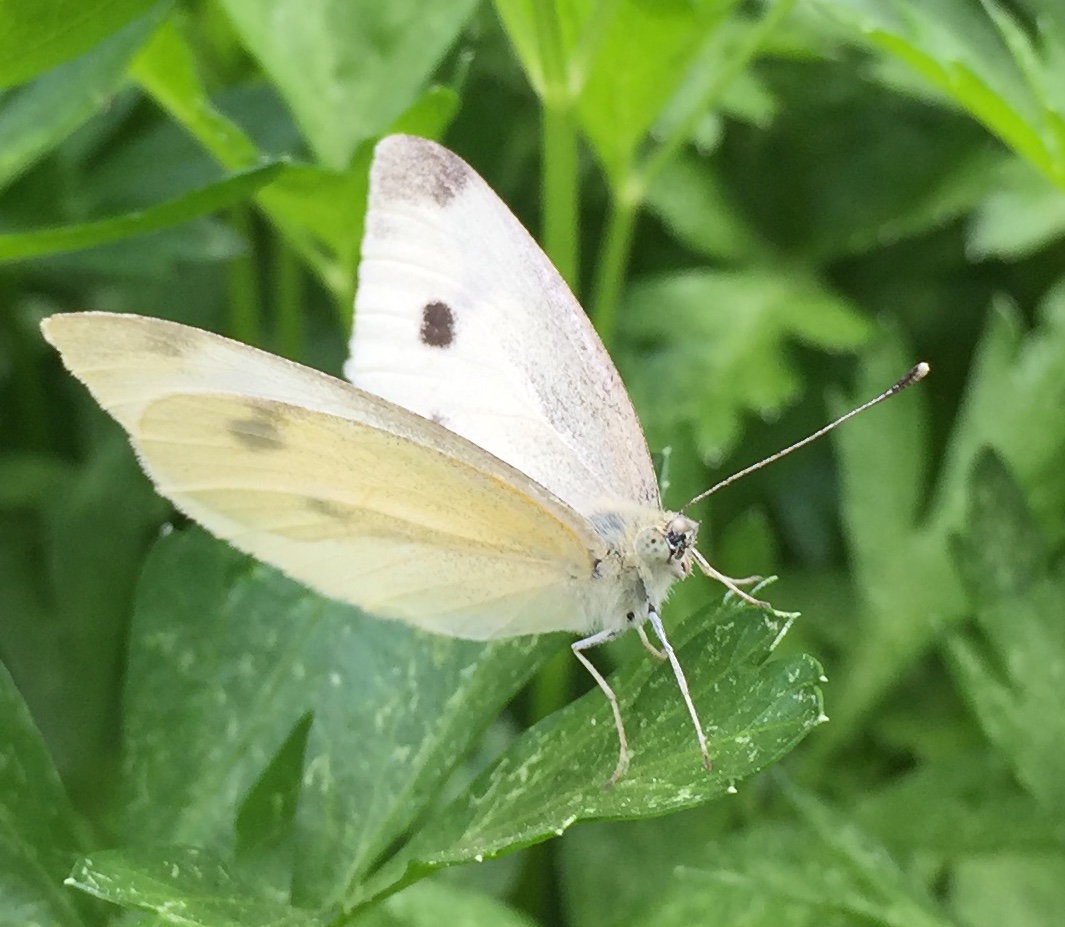 The Cabbage white butterfly is the earliest butterfly I see, cherished by preschool teachers because it is relatively easy for children to observe its lifecycle. The green larva hatch out of eggs laid by the mother butterfly on plants you may be familiar with, broccoli, cabbage, collards, and kale, all in mustard family. Collard seedlings can be planted now to attract the mother Cabbage white butterfly to lay her eggs where children can see them. You will notice when the babies hatch because they eat holes in the leaves, the reason why this species is an agricultural pest.
 Plant the collard seedlings and check them daily for the tiny eggs. If you find an egg, the entire leaf can be cut from the plant and put in a vase for close observation indoors so all children can see it and the tiny, tiny caterpillar when it hatches and begins to eat. Additional collard leaves purchased at a grocery must be washed thoroughly to wash away any pesticides before being added to the vase as an additional food source. See more details in the April 2007 Early Years column or in chapter 23 of Science Learning in the Early Years. (NSTA Press 2016).
The SciStarter listing of this citizen science project says, “Please consider helping this important effort, because through your collections of this butterfly we can learn a great deal about the ecology and evolution of butterflies more broadly as well as how human activities (climate change, pollution, etc.) are having an effect on biodiversity.”
Your children will learn that people all over the world are working to help scientists learn. They may be too young to understand the details of this project that seeks to answer: 1) How has the cabbage white butterfly adapted (evolved) to the new environments it invaded? 2) Where did these butterflies (those found in the US) come from? and 3) How has the “phenotype” (color, shape, size) of the cabbage white butterfly changed as it has moved into new environments? But even two-year-olds aren’t too young to be interested in small animals such as butterflies.
And they will learn about the animal-plant relationship, part of the Next Generation Science Standards, K-LS1-1 From Molecules to Organisms: Structures and Processes, 1-LS1-2 From Molecules to Organisms: Structures and Processes, and K-ESS3-1 Earth and Human Activity.

“Apollo 17: Blue Marble” taken by the crew of the final Apollo mission as the crew made its way to the Moon.
Earth Day is celebrated on April 22 and every day as we connect young children to the natural environment. Weekly walks over the same ground or city block will help children see the changes in nature and the human built environment as the seasons change. Where does the sunshine fall this week compared to where it could be seen last month? The shadows of buildings that blocked the sunlight in winter months may have shifted! Trees leafing out and bees and ants appearing are other examples of seasonal changes children may notice. Feeling like a part of nature, rather than apart from it, helps children begin to notice connections between their actions and what happens in the environment.
One way we can make a small change in our practices to make the environment a healthier place is to begin using paper straws instead of plastic straws for children’s engineering and art projects. Plastic takes a long time to break down so the straws we use today will be around for years, in landfills or dispersed in nature where animals are endangered. Researchers at the University of California, Davis are investigating whether microplastic debris is toxic to marine organisms and if toxic impacts can transfer up the food chain.
Paper straws fall apart faster than plastic ones and that’s a good thing!
Citizen Science Day is April 14, and these projects are a wonderful way for young children to continue their science learning by being part of a larger science effort doing “real science.” (For the record, I think the observations and thinking young children do is real science, the beginning of making sense of natural phenomena.) One citizen science project is the Pieris Project, named after the Latin name of the Cabbage white
Ed News: ESSA Pressures States To Assure All Students Have Good Teachers
By Kate Falk
Posted on 2018-04-13

This week in education news, Wyoming and Idaho pass laws mandating schools to offer computer science classes; March for Science taking place April 14; NAEP scores in math and reading remain relatively flat; blind and visually impaired students can now conduct their own science experiments that might have been exceedingly difficult before; Joan Ferrini-Mundy named President of the University of Maine; and Utah State Board of Education approves plans to begin drafting new school science standards.
Wyoming, Idaho Laws Expand K-12 Computer Science Education
Two states, Wyoming and Idaho, passed laws mandating schools offer computer science instruction, with the goal of preparing students for the future workforce. Read the article featured in Education Week.
Ky. Can’t Push STEM Jobs While Cutting Education, Raising Tuition
Gov. Matt Bevin has stated that one of the goals of his Kentucky education reform is to focus on STEM (science, technology, engineering and math). As a Kentucky-educated computer scientist and team member of a group whose work was inducted into the Smithsonian’s National Air and Space Museum, I feel obligated to comment on Bevin’s plan, and why it’s an abject failure. Read the opinion piece by Mark Alsip featured in the Lexington Herald Leader.
March for Science: Scientists Are Back — And Ready To March
Supporters of science around the world will take to the streets on April 14 to send public officials a message that evidence-based policy decisions are important — and science cannot be ignored. Read the article featured in USA Today.
2017 NAEP Sees Almost No Growth In US Atudents’ Math, Reading Scores
The performance of U.S. students in reading and mathematics has remained relatively flat since 2015, according to the results of the National Assessment of Education Progress, released Tuesday by the National Center for Education Statistics. Read the article featured in Education DIVE.
ESSA Pressures States To Assure All Students Have Good Teachers
Every student, no matter their race or family income level, should be taught by an effective teacher, the Every Student Succeeds Act declares. Exactly how to define what makes an effective teacher and how to implement this ambitious goal has been left up to the states—and their track records on getting started have been mixed. Read the article featured in Education Week.
Study Reveals Teachers Don’t Have Enough Time For Peer Collaboration
Teachers in high-poverty schools collaborate just as much as teachers in low-poverty schools, researchers at the RAND Corporation recently found. However, teachers in both low- and high-poverty schools reported they didn’t have enough time to devote to collaboration. Read the article featured in Education Week.
Illuminating Science For Blind Students, With Help From Latest Tech Devices
As high school student in Los Angeles, Ann Wai-Yee Kwong, who is visually impaired, remembers what it was like when her classmates did a science project. They mixed chemicals and watched them change color, checked liquid temperatures using a thermometer and measured speed and velocity by racing toy cars down a ramp. Kwong couldn’t do much besides sit quietly and “robotically copy data from my non-disabled peers. … I definitely did not feel included. I felt like a second-class citizen.” Using digital Braille readers, “smart” pens affixed with thermometers, 3-D printers, audio textbooks and other innovations, Kwong and other blind and visually impaired students can now conduct their own science experiments and even pursue scientific careers that might have been exceedingly difficult before. Read the article featured in EdSource.
Teachers Still Haven’t Recovered Financially From The Recession
In recent weeks, teachers have been protesting, staging walkouts and marches in Kentucky, Oklahoma, West Virginia and Arizona. Teachers are upset about working conditions, pay and benefits, which in some cases have been stagnant or worsening for years. One major contributing factor is recession recovery — states have less funding per student now than they did in 2008. Read the article featured in the Kera News.
National Science Foundation Executive Named New President Of UMaine
A top executive at the National Science Foundation and leading science, technology, engineering and math expert has been named president of the University of Maine. Joan Ferrini-Mundy was selected after a national search, and succeeds Susan Hunter, who is retiring. Read the article featured in the Portland Press Herald.
Now more than ever, a high-quality STEM education matters. The STEM fields cultivate curiosity and creativity while preparing students to reach their highest potential in work and life. They are also critical for personal and national prosperity: In the next decade, almost all of the 30 fastest-growing occupations will require intermediate or advanced knowledge of science, technology, engineering, and/or mathematics. Unfortunately, access to a high-quality STEM education is deeply inequitable, limiting opportunities for students while they are still in high school. Read the article featured in The 74.
Here’s The Best Way To Create Jobs And Growth In The US
Today, the biggest need of any startup is talent — creative, highly-skilled workers who can turn ideas into the next big technological revolution. To maintain America’s innovative edge, we need a two-prong policy approach of boosting STEM education and training for Americans to fill the jobs of the future, while fixing our high-skilled immigration system so that businesses can recruit the best people for these jobs today without harming U.S. workers. Read the article featured on CNBC.com.
The Utah State Board of Education approves plans yesterday to begin drafting new school science standards, a process likely to touch on divisive issues like climate change and evolution. Read the article featured in the Salt Lake Tribune.
Stay tuned for next week’s top education news stories.
The Communication, Legislative & Public Affairs (CLPA) team strives to keep NSTA members, teachers, science education leaders, and the general public informed about NSTA programs, products, and services and key science education issues and legislation. In the association’s role as the national voice for science education, its CLPA team actively promotes NSTA’s positions on science education issues and communicates key NSTA messages to essential audiences.
The mission of NSTA is to promote excellence and innovation in science teaching and learning for all.
Follow NSTA
|
|
|
|
|
Safety Blog
Mercury: The Shining Health Hazard
By Kenneth Roy
Posted on 2018-04-13
At room temperature, elemental (metallic) mercury can evaporate to become an invisible, odorless toxic vapor. The warmer the air, the more quickly mercury vaporizes. Exposure to even a small amount can affect your health. Symptoms can surface within hours of exposure. According to the Centers for Disease Control and Prevention (CDC), exposure to mercury can result in short-term symptoms (e.g., coughing, vomiting) and long-term symptoms (e.g., loss of appetite, memory loss).
The problem with mercury is that it keeps on recycling itself. It vaporizes, is absorbed by materials in the environment (e.g., carpet, cloth, wood, window fixings), and again vaporizes into the air. This means that mercury drops can continue to turn into vapors that are breathed in by students and teachers years after a spill. It keeps recycling unless there is an intervention.
To determine if there is mercury in the lab, either secure a mercury detection kit or have a commercial lab test the science lab for mercury. If the results come back positive, the school district will need to hire a mercury spill clean-up contractor. If there is a small spill from, say, a broken mercury thermometer, see “How to handle a mercury spill” below.
Where can mercury be found in schools?
For decades, science teachers have used mercury in demonstrations and lab experiments involving oxygen production, exceptionally strong cohesive forces, and more. Before the health concerns about elemental mercury were evident, it could be found in a number of sites at schools, especially in science labs (e.g., glass thermometers, pressure gauges, batteries). Beyond the science lab, mercury can be found in fluorescent lamps and light bulbs, thermostats, switches, latex paint (produced prior to 1992), old microwave ovens, high-intensity discharge lamps, and silent, mercury-tiltwall switches.
All mercury instrumentation and mercury compounds need to be removed from labs appropriately. There are mercury thermometer exchange programs at the local and state levels, commercial hazardous waste vendors, and science laboratory equipment/supply houses.
Alternatives to mercury
Alcohol or electronic thermometers should replace all mercury-filled thermometers. There are also accurate alternatives to mercury barometers, vacuum gauges, manometers, and sphygmomanometers (blood pressure gauges) that rely on electronic or digital gauges and aneroid gauges. Other less hazardous chemicals such as a copper catalyst or zinc formalin can be in place of mercury for science demonstrations and experiments.
How to handle a mercury spill
Should there be a mercury spill, its size will dictate the response. Prepare for a spill by determining the mercury cleanup protocol from your school’s administration or board of education. In addition, general mercury spill guidelines are available from numerous sources, including most state departments of environmental protection and the Environmental Protection Agency. The EPA’s guidelines provide information on cleaning up mercury spills, including what never to do after a spill, preparation for cleaning up a broken mercury thermometer, materials for cleaning up the spill, and specific instructions for cleaning up a spill.
Submit questions regarding safety in K–12 to Ken Roy at safesci@sbcglobal.net or leave him a comment below. Follow Ken Roy on Twitter: @drroysafersci.
NSTA resources and safety issue papers
Join NSTA
Follow NSTA
|
|
|
|
|
At room temperature, elemental (metallic) mercury can evaporate to become an invisible, odorless toxic vapor. The warmer the air, the more quickly mercury vaporizes. Exposure to even a small amount can affect your health. Symptoms can surface within hours of exposure. According to the Centers for Disease Control and Prevention (CDC), exposure to mercury can result in short-term symptoms (e.g., coughing, vomiting) and long-term symptoms (e.g., loss of appetite, memory loss).
In response to “these unconventional and uncertain years,” veteran educator Rodger W. Bybee has written a book that’s as thought-provoking as it is constructive. Now more than ever, he writes, America needs reminders of both the themes that made it great in the first place and STEM’s contributions to its citizens.” Science educators must address STEM issues at local, national, and global levels. And teachers should help students tackle today’s problems with new approaches to STEM learning that complement traditional single-discipline programs.
In response to “these unconventional and uncertain years,” veteran educator Rodger W. Bybee has written a book that’s as thought-provoking as it is constructive. Now more than ever, he writes, America needs reminders of both the themes that made it great in the first place and STEM’s contributions to its citizens.” Science educators must address STEM issues at local, national, and global levels. And teachers should help students tackle today’s problems with new approaches to STEM learning that complement traditional single-discipline programs.
Sure, there are lots of cool STEM activities you can use in class. But do they really help your students learn science? This book shows you how to take lessons you’re already familiar with and, through small changes, do what the title says: Design STEM lessons that are actually meaningful for teaching and learning science. You can also make sure your STEM lessons contain the content students need to learn.
Sure, there are lots of cool STEM activities you can use in class. But do they really help your students learn science? This book shows you how to take lessons you’re already familiar with and, through small changes, do what the title says: Design STEM lessons that are actually meaningful for teaching and learning science. You can also make sure your STEM lessons contain the content students need to learn.
Getting the Ball Rolling
By Gabe Kraljevic
Posted on 2018-04-09
What are some of the best ways to start an d facilitate a class discussion about science topics?
– B., Arkansas
I have used many different ways to get science discussions going. I think the key is to either “wow” them or provide them with some structure to get the ball rolling.
If you have a really good demonstration or discrepant event (such as a skewer through a balloon or an ammonia fountain) the students will perk up and take notice. Have them work in groups to figure out how it worked and then have a full class discussion of the answers.
Start a new topic with a What I Know–Want to find out–Learned (KWL) chart. Have students fill in the K column and at least two items in the W column, then share their work with a partner. They can challenge their partners’ knowledge or agree with them. They may even be able to answer their partners’ questions. Anything they learn goes in the L column. You can have students share their questions with the whole class. This launches the next phase of learning where they get their answers.
Graphic organizers can lead discussions—there is a variety online. Students start on their own and then share. I found a few online and have them in a collection in the NSTA Learning Center. (https://goo.gl/yZNHNB)
Hope this helps!
Photo Credit: U.S. Department of Agriculture
What are some of the best ways to start and facilitate a class discussion about science topics?
– B., Arkansas
I have used many different ways to get science discussions going. I think the key is to either “wow” them or provide them with some structure to get the ball rolling.
The Pasco Wireless Weather Station: Like having your own weather satellite
By Martin Horejsi
Posted on 2018-04-08
For almost 2000 years, Aristotle’s ideas about weather were the industry standard. Although our hindsight confirmed that many of the theories Aristotle put forth in his work Meteorologica were in error, the depth and breath of his observations and inferences were truly impressive especially given his lack of instrumentation and the non-non-existant units that an instrument could produce.
While inferences are conclusions about the cause of an observation, when it comes to weather, we want to know the future, not just the present. Predicting weather, although wrought with more than it’s fair share of failures and punchlines, it is a staple of our daily routine.
Time and temperature are two foundations of our universe, with time being a measurement of change and temperature being a relative quantity of atomic motion. Pretty much everything else is wrapped up in those two concepts. But what about the details? The small stuff. The other stuff.
A foundational concept of geology, uniformitarianism, is to discern the past by observing the present. Water erodes land. Wind blows sand around. Ice cracks rock. And gravity tries to flatten everything out. Weather, on the other hand, is predicted by inferring what we think caused what we are experiencing now. This double-inference is especially tricky. Ideally though, with enough data points, we can know the future. Well, at least the short-term weather.
Three hundred years before Aristotle, the Babylonians tried to predict short term weather changes based on the look of cloud and other visible changes. And shortly after Aristotle penned his four tomes on weather theory, the Chinese constructed a 24-part annual calendar based on different weather types.
What was missing, and what kept archaic ideas alive for millennia was primarily the absence of instrumentation and quantitive measurements. Qualitative observations lacked both precision and comparative metrics, and without those it was difficult to generalize descriptions across geography and time.
Breakthroughs were made with the creation of instruments used to measure humidity, temperature, and barometric pressure allowing both discrete measurements and inferred measurements by combining types of data. And as electronic communications increased, so did the ability to compile distant observations and measurements, and to make forecasts with the ability to check one’s work.
By the 1860s the combination of many data points across a large area through telegraph communication made weather forecasting a real thing. The accuracy and scope of predicting the weather made another leap when the instruments were attached to weather balloons and rose through the atmosphere adding a third dimension of accuracy.
The next big break in wether prediction was numerical analysis of the data. What was needed was a formula where the variables could be entered resulting in a solution that accurately predicted the weather at a point in the future. And as the equation was refined, accuracy improved and the reach into the future was greater. Oddly, from Aristotle’s methods of 2300 years ago until 19 years before we went to the moon, using all the math and instrumentation possible, we measured success by predicting the weather a full 24 hours into the future.
Today, we combine all the best of our instruments and equations along with space-based satellites allowing us to predict weather with much more accuracy and much farther into the future. But even that has not dampened weather’s role in jokes and punchlines.
Weather stations of various quality have been part of the science classroom for decades. Beginning with the simple indoor/outdoor thermometer, quantitative weather observations have been a popular part of the daily classroom routine whether morning homeroom or science curriculum from kindergarten to graduate school.
What has changed over recent time is the shape and capabilities of the weather station. From boxes within larger boxes, to individual instruments bolted and wired together, all with their own limitations. One of the biggest challenges is the data collection, well actually the data extraction and visualization. Half of science is data collection. The other half is data interpretation. The former without the latter is useless. The latter without the former is, well, fake news.
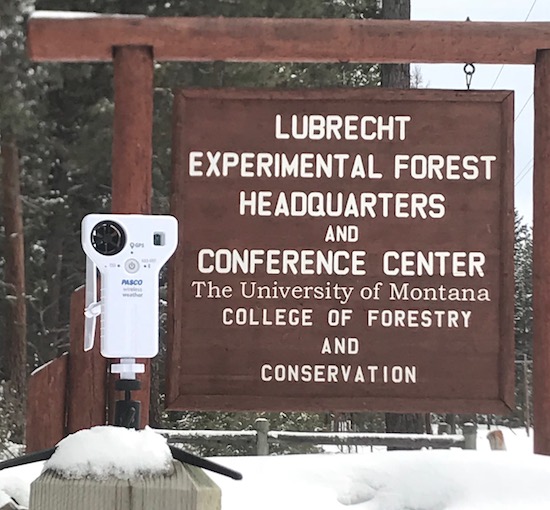
The Pasco Wireless Weather Sensor
Pasco has created a unique and intensely feature-filled weather station that contains 17 different measurements or extrapolations. As if that weren’t enough, the quarter-pound of sensors in the Pasco powerhouse can share it’s finding with a computing device through a USB cable, through Bluetooth, or just hang on to them inside its built-in memory until a later time. That means the weather station can transfer it’s weather data, current or over time or both, from a few cabled meters away, like magic through the air via Bluetooth up to 10 meters away, or 12,756 km away using independent datalogging only to be picked up at a later date and downloaded. By the way 12,756 km is the farthest any two points can be from each other on planet earth.
And you can keep track of you place on the earth because the Pasco Wireless Weather Sensor has built-in GPS.
Pasco.com lists the sensors and specs as:
|
Barometric Pressure |
• Range: 225 to 825 mmHg •Accuracy: ± 0.1 mmHg •Resolution: 0.02 mmHg |
|
Ambient Temperature |
• Range: -40 to 125 °C •Accuracy: ± 0.2 °C •Resolution: 0.1 °C |
|
Wind Speed |
• Range: 0.5 to 15 m/s (winds of up to ~ 33 mph) •Accuracy: 3% of reading •Resolution: 0.1 m/s |
|
Directional measurement |
• Wind direction: 0 to 360° •True heading: 0 to 360° •Magnetic heading: 0 to 360° |
|
Relative Humidity |
• Range: 0 to 100% •Accuracy: ± 2% •Resolution: 0.1% |
|
Illuminance (light level) |
• Range: 0 to 130,000 lux |
|
UV Index |
• Range: 1 to 12 •Accuracy: ± 1 •Resolution: 1.0 |
|
Altitude (via GPS) |
• Range: 0 to 18,000 m •Accuracy: 2.5 (50% CEP) •Resolution: 0.5 m |
|
Speed (via GPS) |
• Range: 0 to 515 m/s •Accuracy: 0.05 m/s •Resolution: 0.05 m/s |
|
Connectivity |
• Bluetooth 4.0 or USB 2.0 |
|
Battery |
• Rechargeable Lithium Polymer |
|
Data Logging |
• At least 30,000 samples with all sensors on •Up to a full week with GPS sensor turned off |
|
Water-resistance |
• Splash proof and designed to withstand the elements |
|
Operating Environment |
• – 20 to 150°C |
|
Calculated measurements |
• Absolute Humidity, Dew Point, Wind Chill, and Humidex |
|
GPS |
• 66 channels •Warm up time of 35 seconds or less |
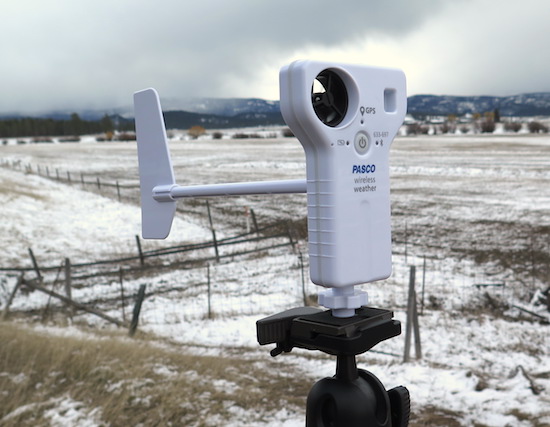
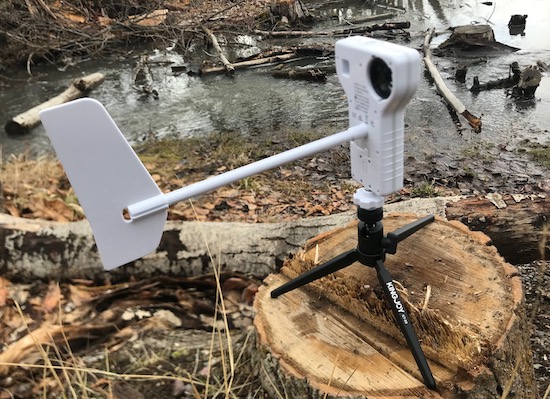
One essential accessory for the Pasco Wireless Weather Sensor is the Weather Vane Accessory. The three pieces in this kit include a tripod mount allowing free 360 degree spin, a screw-in boom, and a tail fin. By adding 20cm of distance between the Pasco Wireless Weather Sensor and 48 square centimeters of wind-grabbing vertical wing, the Weather Vane will keep the Pasco Wireless Weather Sensor’s turbine anemometer perpendicular to the wind. The kit also comes with a stout table-top tripod with excellent leg-spread and a ball head for quick adjustment and solid lock-up.
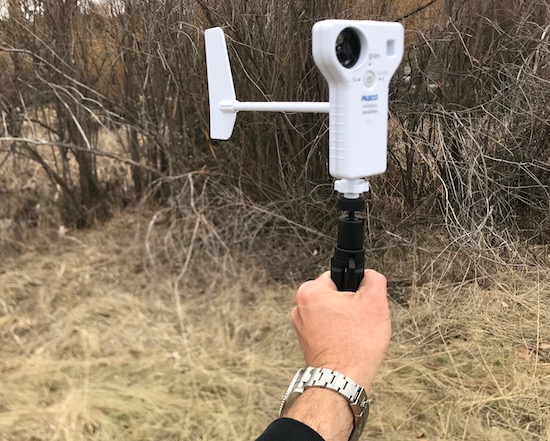
The tripod kit also makes an excellent handle that removes any directional bias from simply holding the Pasco Wireless Weather Sensor in your hand and pointing it towards where you think the wind is coming from. Additionally, the stiffness of the metal tripod legs allow it to be form fit to a slanted surface without raising the center of gravity much.
The built-in USB rechargeable lithium polymer battery powers all the sensors, the GPS, and of course the Bluetooth radio that effortlessly transmits the data to any compatible device with Pasco SPARKvue software including those running iOS, Android, ChromeOS, Mac and Windows.
The Pasco Wireless Weather Sensor can directly measure wind speed, wind direction, barometric pressure, humidity, ambient temperature, light level, UV index, and magnetic heading. With that information, the software can calculate dew point, wind chill digital-compass wind direction, absolute humidity, and heat stress index. The on-board GPS receiver can identify latitude, longitude, altitude, speed, wind direction (with declination adjustment) and number of satellites the Pasco Wireless Weather Sensor is listening to.
While most of the measurements are self-explanatory, a couple of them can be confusing. Dew point, for instance, is the temperature to which air must be cooled to become saturated with water so at any lower temperature than the dew point, water condenses out of the air making dew. If the dew point is below freezing, then its called the frost point since frost forms rather than liquid dew.
The relationship between dew point and humidity is that humidity is a direct measurement of the amount of water vapor present in the air. The higher the humidity, the closer the measured humidity and the calculated dew point. At 100% humidity, the dew point is equal to the ambient temperature.
Wind chill, windchill, wind chill factor, or wind chill temperature; it doesn’t matter what you call it, it is a calculated number below the ambient temperature that considers convective heat loss on a surface similar to human skin. The idea is that ambient temperature alone does not provide general information about how cold it feels, and how the body will react. Convective heat loss can make a temperature behave and feel much colder than if there was little convection. And since convection can easily be countered with modern fabrics and outdoor clothing, and being inside a car, the application of the wind chill factor are mostly limited to those situations where unprotected (direct skin) exposure to the wind can happen.
The calculation of windchill involves wind speed, air temperature and some constants that are generally agreed upon to represent human skin. Over time, the constants have changed, and even today they vary across continents. However, in 2001, the Joint Action Group for Temperature Indices (JAG/TI) updated the wind chill temperature index adding or specifying the following:
- Use calculated wind speed at an average height of five feet (typical height of an adult human face) based on readings from the national standard height of 33 feet (typical height of an anemometer);
- Be based on a human face model;
- Incorporate modern heat transfer theory (heat loss from the body to its surroundings, during cold and breezy/windy days);
- Lower the calm wind threshold to 3 mph;
- Use a consistent standard for skin tissue resistance; and
- Assume no impact from the sun (i.e. clear night sky).
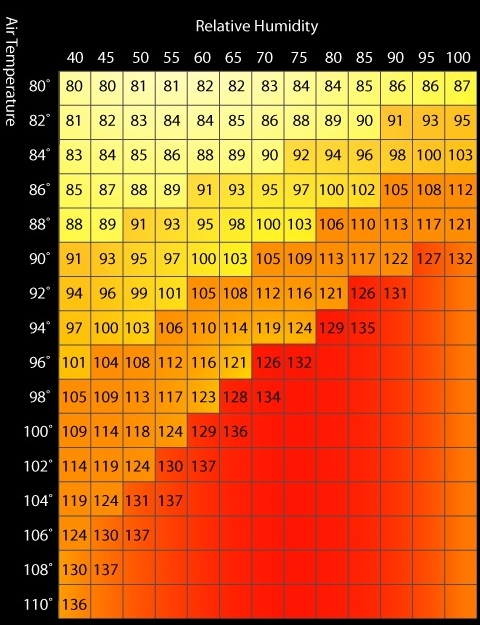
The calculated Heat Stress Index is basically the relation of the amount of evaporation or perspiration required to cool a body compared to the maximum ability of the average person to perspire. Somewhat similar but opposite of the wind chill factor, the heat stress index uses ambient temperature and humidity along with some assumptions (constants in the equation) to generate a temperature number above the ambient temperature. The Heat Stress Index can kick in at 80 degrees F, and climbs rapidly from there. The concept here is that it takes energy to vaporize (evaporate) water. The human body excretes water through sweat glands and as that water evaporates, energy is lost thus cooling the body. But in order for the water to evaporate, there must be “room” in the air for it. As humidity climbs, there is less and less room until 100% humidity is reached at which point there is no room so essentially the body’s cooling mechanism is completely ineffective. Some examples include at 96 degrees F, the heat index is 108 at 50% humidity, and 132 at 75% humidity. And 90 degrees F, the heat index is 108 at 75% humidity and 132 at 100% humidity. However, 100% humidity at 80 degrees F only yields a heat index of 87. I am using Fahrenheit since most US weather measurements and Heat Indexes are reported in such units whatever we call them now like British, English, SAE, non-metric, fractional, U.S. units, Imperial, or the formal sounding USCS for United States customary system.
The way the instrument works is almost as much fun as using it. For instance, temperature is measured by a thermistor which, like it sounds, is a electrical resistor that changes its resistance as temperature changes. Temp goes up, resistance goes up. Temp goes down, resistance goes down. So when the resistance is calibrated to the temperature, the flow rate of electricity now tells the temperature.
Another chip, the humidity sensor also uses resistance. In this case the electricity flows through electrodes embedded in a water-absorbing resistive polymer material exposed to the air. As moisture (humidity) is absorbed into the polymer, the resistance changes and so does the reported percentage of water vapor in the air known as humidity. Of course you can complicate matters by splitting the hairs of absolute humidity, relative humidity, and specific humidity.
Finally is the turbine anemometer, by far the coolest moving part on the Pasco Wireless Weather Sensor. Like a tiny six-bladed ship’s propeller, the twirling blade spins almost effortlessly inside its tube generating an electric current corresponding to its speed. And as the only major moving part in the Pasco Wireless Weather Sensor, it is replaceable.
The Pasco Wireless Weather Sensor is controlled by the software on a computing device. Pairing the sensor with Bluetooth allows control over what instruments are monitored, and even to turn some of them on or off. For example, you may want a data collection run over several days, but in the same location. In that case, the power-hungry GPS receiver and power thirsty digital compass can be turned off to substantially increasing the runtime.
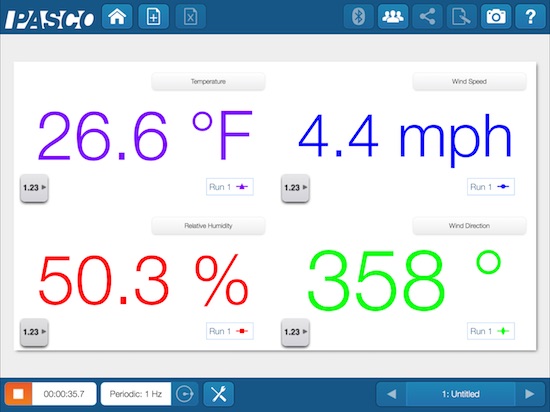
The SPARKvue software platform is available from Pasco in any of 28 different languages including Kazakh, Thai and Turkish as well as several flavors of Spanish, French, Chinese, and Portuguese. In SPARKvue, you can build a visual interface that shows up to six of the sensors in real-time. You also have the choice of individual graphs, gages, numbers and other measurement presentations.
Mark Twain once said that, “Climate is what we expect, weather is what we get.” I once said, “If you don’t like the weather here in Montana, wait an hour. It will get worse.” No matter who you quote, teaching about the relationship between current weather, future weather, and the measurements we use to bridge the time gap is not only important, but with 33 hits for the term weather in the NGSS Standards (only 26 for the term Force, but 77 for the term Chemical), I’d label weather as an important science topic in need of attention at all grade levels.
Even in the future when each school district has its own weather satellite, there will still be a need for local measurements, and the simplification of large scale phenomena. Tools such as the Pasco Wireless Weather Sensor will be an invaluable component in making the abstract concrete, the enormous manageable, and the experience quantifiable. Just imagine if Aristotle had his own Pasco Wireless Weather Sensor. We might be two thousand years more advanced than we are now!
For almost 2000 years, Aristotle’s ideas about weather were the industry standard. Although our hindsight confirmed that many of the theories Aristotle put forth in his work Meteorologica were in error, the depth and breath of his observations and inferences were truly impressive especially given his lack of instrumentation and the non-non-existant units that an instrument could produce.