
feature
Bird Biodiversity
Co-Leading an Ongoing Outdoor Investigation With Middle School Students
CONTENT AREA Life Science
GRADE LEVEL 6–8
BIG IDEA/UNIT Interdependent relationships in ecosystems and biodiversity
ESSENTIAL PRE-EXISTING KNOWLEDGE Basic understanding of ecosystems
TIME REQUIRED 3–5 class periods to set up investigation; 1 class period per week for outdoor field work throughout ecology unit
COST $0–$500 to purchase student binoculars and walkie-talkies if needed (recommended, but not required)
SAFETY Long pants, closed-toed shoes, and water for fieldwork days. Follow NSTA guidelines for Field Trip Safety (link in Online Resources)
Outdoor education has a way of engaging students that is unmatched within the walls of the classroom alone. When outdoor science investigations are tied directly to in-class learning, middle school students can directly apply their knowledge to new situations, leading to increased engagement and better learning outcomes (James and Williams 2017). While outdoor education is often limited to occasional field trips or one-time lessons, the school campus can provide an ideal environment to develop regular outdoor experiences. During the 2021–2022 school year, 150 seventh-grade students across six class periods at Orinda Intermediate School worked together for six weeks to conduct an investigation into bird biodiversity on the school campus. Regular outdoor investigation periods, interspersed with classroom lessons on key ecology topics such as food webs, population dynamics, and invasive species, helped bring this content alive for students as they applied what they learned locally. Ready to develop your own investigation? Learn from our experiences (including teaching tips) throughout the process and get your students outside.
Why birds?
Birds are everywhere, yet they are easy to miss if you are not actively seeking them. Even common birds play key roles in ecosystems as potential pollinators, seed spreaders, pest controllers, predators, and prey (Zimmer 2019). Birds are a window into which students can explore ideas of interdependence and biodiversity.
Even within the relatively small space of a middle school campus, students are likely to observe differences in type or abundance of birds between areas. Multiple studies have shown that variations in home gardens and landscaping, such as the presence of native plants, spacing and percent cover of trees, and proximity to other vegetated habitats can affect the variety of birds (Burghardt, Tallamy, and Shriver 2009; Daniels and Kirkpatrick 2006). While science rarely produces neat and clean results, a focus on birds is likely to lead to results that are noticeable and inspire further student questions.
Engage: Becoming
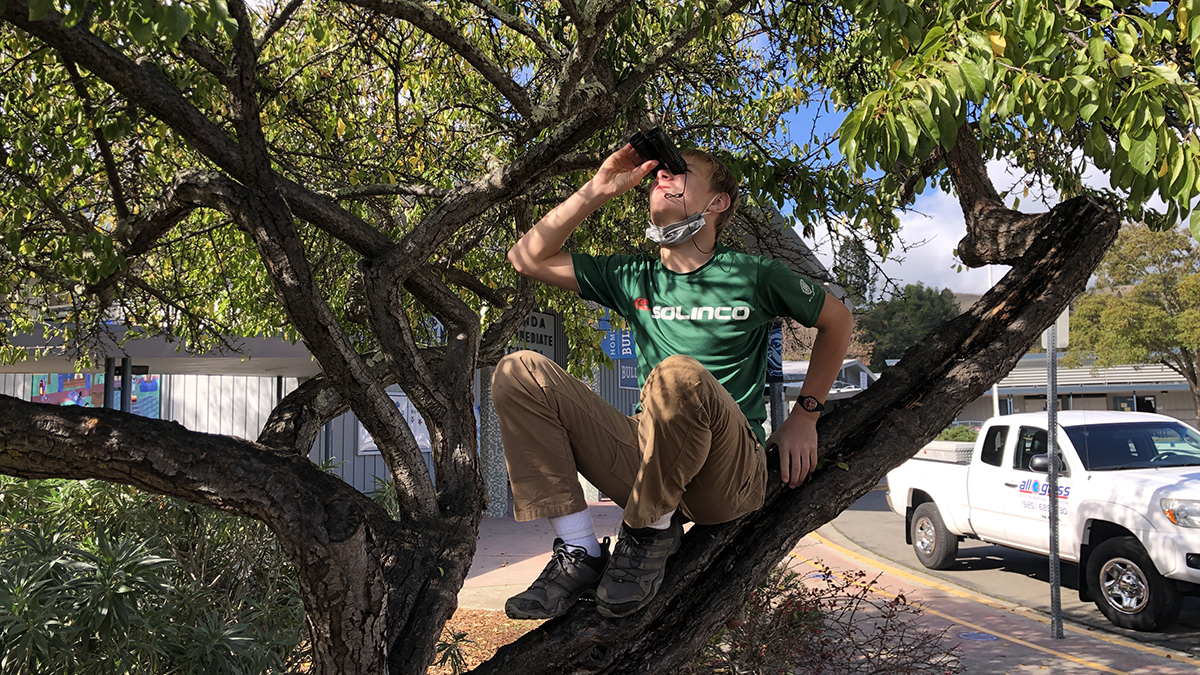
Before beginning the investigation, it is important to set the stage. If students feel they are doing the work of real field biologists and that they have the skills to do this, they will be much more engaged. We began our bird study by watching “A Day in the Life of a Field Researcher” from Cornell Lab (see Online Resources). Students imagined themselves in this role and thought about what techniques we would need to have the best chance of spotting birds. Out of this discussion, students came to the conclusion that we would have to be as quiet as possible, become skilled at recognizing the sounds and sights of our local birds, and be comfortable with the idea that during some observation periods we might not see much.
To ensure that students felt comfortable correctly identifying birds in the field, we devoted a week to learning about and practicing the identification of our local birds. Because it may seem intimidating to students to “memorize” so many birds, we focused on keeping it playful. During the first lesson, we watched “The Nine Best Scientific Study Tips” from AsapSCIENCE (see Online Resources), and students shared their own study strategies with each other. Using a teacher-prepared list of our 20 most common local birds and Cornell Lab’s “All about Birds” webpage (see Online Resources), students had opportunities to create flashcards, field guides, and Quizlet tests that included images and sounds of each bird. After two class periods to prepare resources and start learning to recognize the birds, we continued the rest of the week by devoting the first 10 minutes each day to practice, while moving forward with other curriculum. The following week, students demonstrated their ability to identify the birds with an online quiz. While most students did well the first time, students could practice and retake the quiz until they demonstrated mastery.
Choosing a guiding question
The heart of inquiry is choosing the right questions to answer. A good guiding question is one that allows students to interact with essential concepts. It is a balancing act between defining the parameters so that it can be answered through direct observation, while being open-ended enough that it can lead to new questions. A common guiding question allows students to share data across all class periods for a more in-depth data analysis (we ended up with thousands of bird sightings to look for patterns). Alternatively, teachers looking to build in even more student autonomy could consider allowing individual groups of students to generate their own guiding questions.
For our investigation, we chose to focus on a shared comparative question: “What areas of campus have the greatest bird biodiversity: the more natural areas surrounding the school, or the human-maintained landscaping and gardens?” This question also led to many more student-generated sub-questions later on to consider as patterns emerged in our data.
Planning the investigation—student voice and leadership (1–2 class periods plus optional lunch period)
Once the question is agreed on, the next step is to consider how the investigation will be carried out. Involve students as much as possible in this process. Some questions to consider together are:
- How will observation/data collection sites be determined?
- What types of data will be collected to answer the question?
- How will data be collected so that it can be compared fairly between students?
- What mistakes or inconsistencies in data collection might make these comparisons inaccurate? How can we avoid them?
Students can work collaboratively to address questions like these. Because we wanted to be able to compare data from different class periods, we had to develop a common procedure. We chose to first have students brainstorm their own answers to these questions individually in their science notebooks, then discuss within table groups, and finally have each table group pick a representative to share their ideas. In this way, each student grappled with these questions, and each class period produced a list of ideas. To come up with a common procedure across class periods, a small volunteer group of students worked with me during a few lunch periods to compare ideas across classes and develop a common protocol. Processes such as this can build leadership opportunities for those extra-motivated students and allow for input from multiple classes to inform a shared procedure.
Our final bird observation protocol and data sheet (see Supplemental Resources) was designed to address teacher and student concerns to ensure our observation data was as accurate as possible. As groups of four to five students went out to different locations to conduct observations, they followed this agreed-on procedure to structure the time and facilitate consistent data collection between groups. To help students detect the presence of hard-to-see birds, each 15-minute observation period began with a minute of silent listening in which students recorded how many different types of bird calls they heard. We also used Merlin Bird ID, a free app for iOS and Android devices developed by the Cornell Lab (see Online Resources). While the app has many features to help users identify birds, we primarily used “Sound ID,” which identifies nearby birds based on their songs. One student per group was in charge of setting up the app to listen for birds and monitoring its suggestions to share with the group.
These steps were designed to help students notice what they might otherwise have missed, but all observations had to be confirmed by the students themselves. To limit the risk of overcounting individual birds, the protocol calls for each group to choose a leader each day to act as a recorder. Group members were required to stay within whispering distance and report possible sightings to the leader to record. In doing so, groups stayed together, which increased safety, as well as awareness of each other’s sightings, which could be verified by multiple members. Last, the procedure included a step where students discussed and reported any possible sources of error in their data back in the classroom, which helped students to improve their skills on subsequent observation days.
Explore: Bird observation days
At this point, students are excited and prepared to start their fieldwork. The goal is to integrate these observation days into the ecology curriculum at least once a week so that students have a chance to apply what they are learning. We conducted our observation over a period of five weeks, with the first observation days focusing solely on identifying species and number of birds at each of six common sites. While having students dispersed around campus conducting their fieldwork may seem intimidating, following are some tips and tricks to make this safe, manageable, and fun.
Setting clear boundaries and expectations. Before sending students off to start their observations, ensure students know their roles and know exactly where they should and should not be. Emphasize the importance of their roles as part of a team of student scientists and the mutual trust required. This type of activity is recommended later in the school year when class norms and expectations have been established.
Clothing and supplies. It is important that students know in advance which days they will be conducting fieldwork so that they can be prepared. Walk any planned observation sites beforehand to identify safety issues. Will students need closed-toed shoes? Water bottles? Long pants or sunscreen? Two of our sites were on a brush-covered hillside surrounding our school, so closed-toed shoes were required to visit those sites. Because water fountains were within less than a minute walk of each site, water bottles were encouraged, but not required.
Student supervision. To be able to quickly locate students, assign each group to an observation site each time. Students can circle their location on a map to quickly find it, and you can quickly locate a student as needed. When selecting observation sites, we made the conscious decision to keep them all within a three-minute walk of the classroom. This allowed me, as the teacher, to easily visit all groups during an observation period. We also purchased inexpensive walkie-talkies, so students could locate me if needed, ask questions, and receive messages such as when to return to the classroom. Given the ability to quickly communicate via walkie-talkie, and the proximity between the sites, student groups worked independently, without the need for an adult to accompany each group. In addition to our standard school rules, students were expected to remain within their assigned site boundaries, be as quiet as possible to not disturb other classes (and the birds they were trying to find), and respond immediately if called on the walkie-talkie. If walkie-talkies are not available, consider focusing observation sites around a central location, like a field, where the teacher can more easily observe groups all at once, and students know where to find them.
Group roles. Having specific roles for group members to choose helps clarify what needs to get done in the field and ensures everyone is included. In our investigation, roles included a leader that recorded data and managed the walkie-talkie (students love this!), bird spotters that carried field guides and shared binoculars to spot birds, and an “audio specialist” that used the Merlin Bird ID app to listen for bird calls and suggest potential birds heard in the area. We found these group roles were successful in helping students to share limited equipment and actually contributed to the accuracy of our observations, as students were not focused solely on using the binoculars and worked together in their roles to confirm sightings.
Tools and technology. While nothing is necessary outside of a pencil and paper, we found that certain tools were useful. Plan in advance what tools you might want students to use and where to get them. At least one pair of binoculars per group, field guides, a phone or tablet to access Merlin Bird ID, and walkie-talkies were all helpful tools in our study.
Explain and Elaborate: Connecting classroom to field (2 class periods for a CER activity, 1 class period for each additional type of data collection)
On days when we were not collecting data outside, students continued with in-class topics on ecology, such as biodiversity, ecosystem services, species interactions, food webs, resource availability, and invasive species. Students compared food webs of local and exotic ecosystems, studied case studies of keystone species, and researched and presented on the biotic and abiotic factors affecting the population of a local species. Students also grappled with the complexity of measuring biodiversity, debating the importance of species richness versus abundance, and learning about biodiversity indexes that try to capture the relative importance of both. Although the details of our ecology curriculum are beyond the scope of this article, the important element is that these types of outdoor investigations can be designed to support existing ecology curricula in the classroom.
Two weeks into the investigation, we paused to examine our data. At this point we had conducted two days of bird observations, as well as several in-class lessons. Students compared the data so far from each of our sites with a partner, and wrote patterns and trends in their notebooks to share with the class. Some things that were noticed included:
- The greatest variety of species was observed in the natural sites, especially in one site, surrounded by trees and shrubs on the hillside.
- The greatest abundance of birds was found in the more human-influenced sites, particularly around the school lunch area.
- Certain birds were noticed regularly on particular sites, but seldom to never on other sites.
After students shared their observations, they worked in pairs to come up with hypotheses to explain the patterns we were seeing so far. In addition, students could conduct online research to learn more about diets, habitat requirements, and migration patterns of individual birds to support their arguments. Each pair then completed a claims-evidence-reasoning (CER) activity in their notebooks. They used this to share with the class a claim about the data, and support it with evidence from the class data and their online research. Some ideas that came out of this were:
- Many students noticed that the greatest abundance of birds was in the human sites near the lunch area. These birds were primarily generalists like crows and sparrows and collected food left over from students, while birds found primarily in the natural sites tended to be insectivores and/or granivores and could likely find a wider variety of insects and seeds in the hillside sites.
- Other groups reasoned that many of the birds in the natural sites might rely on native trees as habitat. They were more commonly found in areas with these trees and less often in the mostly exotic plants of the landscaped and garden areas.
These insights demonstrate how students were applying what they had learned in class to what they were observing in the field. To test these hypotheses, we added in two more observation days—one to look specifically at invertebrates and another to survey plants at each site. For the invertebrate study, we used the “bug observation protocol and data” sheet shared in Supplemental Materials.
Groups of students went to each of our bird observation sites and performed three types of tests to survey insects and other invertebrates in the air, on the leaves and stems of plants, and in the soil.
Each group started with a five-minute visual survey of flying insects and visible insects on trees, conducted a shake test to collect invertebrates deep in trees and shrubs, and collected soil samples to carefully count invertebrates in the soil back in the classroom.
To test the hypothesis that the species richness of birds was greater in the hillside sites due to the presence of particular (and possibly native) plants, students conducted a survey to identify shrubs and trees on each site. Each group surveyed a different bird observation site and used field guides and the Seek app by iNaturalist (see Online Resources) to identify as many plants as they could. Back in the classroom, students used the California Invasive Plant Council’s website, as well as their own research to help identify native, introduced, and invasive plants at each site (see Figure 1 and Online Resources). See the Supplemental Materials section for the “student plant survey” sheet we used.
Interpreting the data
Now that the field portion of the investigation is finished, it’s time for students to analyze the data. Think about different aspects and ways students can visualize the data to build connections between them and what skills you want your students to practice. Although this might be a great place to have students create graphs from their own data, we chose to compile graphs to analyze the combined data from all class periods. These graphs included the average abundance of individual birds and the number of species (species richness) at each site, a graph of the most common species identified at the human and natural sites (see Figure 2), a graph of invertebrate richness at each site, and a chart combining the plants identified by each class at each site.
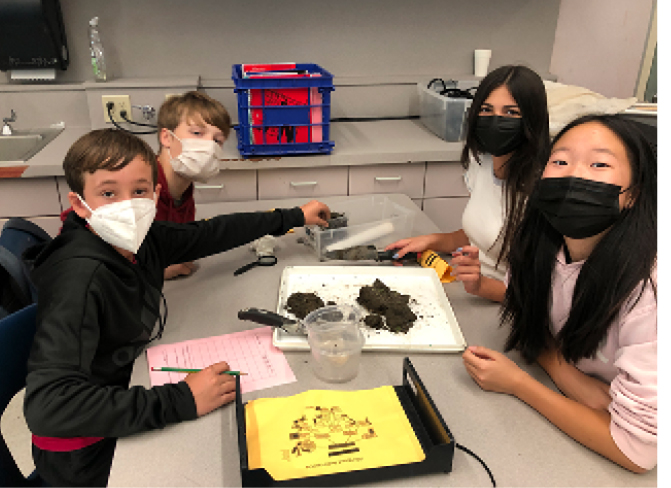
Students back in the classroom surveying invertebrate species found in soil samples from their site. After noticing a high variety of bird species at particular sites, students proposed looking at the variety of bugs at each site as a potential food source. We found that that in general the sites with the greatest variety of invertebrates in the plants and in the soil contained the greatest variety of birds.
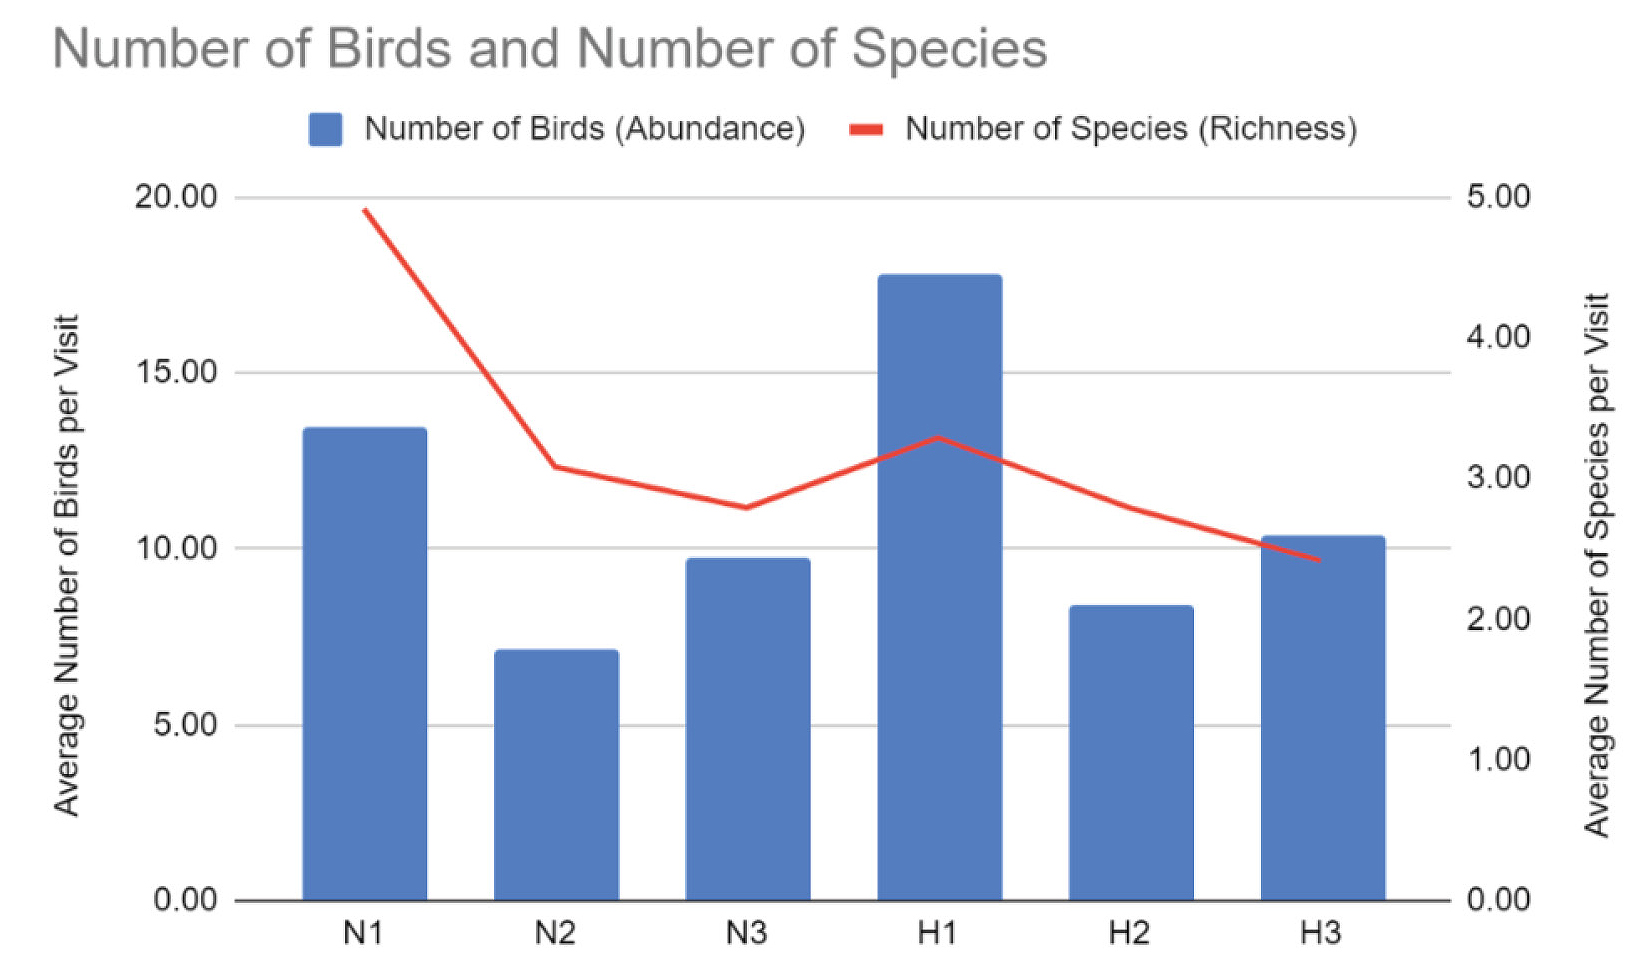
Students worked with partners to analyze data from the investigation. This graph shows the average number of individual birds and species sighted by students from each class period during all three bird observation days.
To help students succeed, we scaffolded this in several ways. First, each student worked with a partner to identify and record the trends and key observations they noticed in each graph on the student data analysis sheet (see Supplemental Materials for a sample of this sheet based on our results). Then each pair worked with another pair to share what they noticed, before discussing it with the whole class. Finally, students were asked to write an argument, connecting data from multiple figures to explain which sites they believed showed the greatest bird biodiversity and why. For example, one interesting result that sparked a great deal of discussion was that the invertebrate richness graph and bird richness graph were almost identical—the sites with the highest bug biodiversity tended to have the highest variety of bird species, suggesting a potential predator/prey relationship. This process allows students to apply NGSS Science and Engineering practices around “analyzing and interpreting data” and “engaging in argument from evidence,” as well as crosscutting concepts like “cause and effect.”
Evaluation
The final product following the investigation was a lab report in which students interpreted the data from the study to propose improvements to the school landscaping to increase the biodiversity of birds on campus. This required students to combine what they learned during the in-class lessons, data from the investigation, and some additional research to explain their findings, acting as an individual summative assessment for the project. The report is broken down into six sections with guiding instructions for each: Introduction, Hypothesis, Results, Discussion, Action, and Reflections. The introduction section primarily assesses understanding and application of in-class lessons on biodiversity and ecosystem services and asks students to write an argument discussing how biodiversity benefits both ecosystems and people. In the hypothesis section, students share their predictions and reasoning they wrote at the start of the investigation, which is a useful indicator in evaluating how their thinking has changed at the end. In the results section, students share their interpretation of the class data to argue which sites had the greatest variety of birds as well as the greatest overall abundance. The discussion section evaluates students’ ability to make an argument using multiple data sources and asks students to develop an argument for why they believe we saw these results using data from the invertebrate and plant survey, as well as from an additional online source. The action section requires students to apply what they have learned by making actionable recommendations to improve the schoolyard habitat for birds based on the results they discussed in the previous sections. Finally, the reflection section is a chance for students to share their personal take-aways and suggestions for future investigations. The final lab report template and assessment rubric are included in the Supplemental Materials section.
Conclusion and extension
Throughout this investigation, students immediately applied the ecological concepts they learned in class throughout their on-campus fieldwork. Students grappled with concepts such as food webs, invasive species, human impact, and the challenges of measuring biodiversity as they planned and carried out the investigation. By focusing on birds, students became local naturalists, excited and proud to identify local birds at school and at home and continuing to do so—unprompted—months after the investigation ended. The results of their investigation will be used in the upcoming school year to make real improvements to the landscaping at our school to improve habitat for birds. This type of place-based learning can help students build connections to the school campus, as they see the results of their inquiry lead to genuine action in a place where they spend so much of their time.
While our investigation focused solely on our school campus, there are opportunities to expand this work to the scientific community at large. Citizen science projects allow students (and the general public) to contribute useful data to the scientific community. In future iterations of this project, we plan to have students contribute data beyond the school campus using apps like iNaturalist. We intentionally chose not to do this in our first year, per the iNaturalist Teacher’s Guide, which discourages schools from inadvertently contributing inaccurate data. However, after watching a group of students go through the investigation, I have seen how confident and accurate they can become. After having at least two rounds to practice, I plan to have students contribute their final round of observations next year toward citizen science on iNaturalist. This experience has taught me that long-term, on-campus fieldwork can be a fun, safe, and effective way to engage middle school students in science concepts and practices.
Online Resources
All About Birds [website] from the Cornell Lab—https://www.allaboutbirds.org/
A Day in the Life of a Field Researcher [video] from the Cornell Lab—https://www.youtube.com/watch?v=Xa6Tipb7sYo
Merlin Bird ID App from the Cornell Lab—https://merlin.allaboutbirds.org/
The Nine Best Scientific Study Tips [video] from AsapSCIENCE— https://www.youtube.com/watch?v=p60rN9JEapg
NSTA guidelines for field trip safety—https://static.nsta.org/pdfs/fieldtripsafety.pdf
Seek app by iNaturalist—https://www.inaturalist.org/pages/seek_app
California Invasive Plant Council—https://www.cal-ipc.org/
Supplemental Materials
Bird observation protocol and data (student sheet)—https://bit.ly/3EcpXWY
Bug observation protocol and data (student sheet)—https://bit.ly/3k6uB1Z
Evaluation: final report assessment rubric—https://bit.ly/3YSkmgs
Evaluation: final report template—https://bit.ly/3KgYHdM
Student data analysis sheet—https://bit.ly/3lJObkX
Student plant survey—https://bit.ly/3YSQDE1
Connecting to the Next Generation Science Standards—https://bit.ly/3YXui8j
Marshall Sachs (msachs@orinda.k12.ca.us) is a science teacher at Orinda Intermediate School in Orinda, California.
Interdisciplinary Life Science Middle School