
feature
Community Lead-Ers
A Hands-On Community Health Simulation Within the Classroom
Science Scope—September/October 2020 (Volume 44, Issue 1)
By Isabelle Nguyen, Athulya Johnson, Andrew Kapral, and Abel Chacko

CONTENT AREA Chemical reactions
GRADE LEVEL 6–9
BIG IDEA/UNIT Real-life application of chemical reactions and its advantages and disadvantages
ESSENTIAL PRE-EXISTING KNOWLEDGE The differences between elements, atoms, molecules, and compounds; materials are made up of molecules with varying properties that can react with each other.
TIME REQUIRED One session of 45 minutes or multiple 15-minute sessions
COST $20 for basic materials for 6 groups; with pipe models, $50 for 6 groups of 5
SAFETY Gloves and goggles when conducting all tests
Role-playing activities promote student engagement, encourage evidence-based discussions, and help students to connect with the material (Freire, Baptista, and Freire 2016). Using current and controversial topics, students are encouraged to analyze and form rational opinions while making scientific connections (Burgin and Butler 2016). In this lesson, we aim to provide an example of a lesson that engages the students in real-world contexts. This activity is based on the 2015 Flint, Michigan water crisis that occurred when the corroded pipes introduced lead into the city’s drinking water. In our narrative-based lesson, students conduct mock water-quality tests that explore the basic concepts of acid-base chemistry and buffers. The activity uses a hands-on approach in which students conduct tests and discuss decisions that affect the outcome of their group. Students should have prior knowledge of basic chemistry concepts, such as differentiating between elements, atoms, molecules, and compounds.
Set-up
Students are introduced to a fictional city where people are getting sick but do not know why. To solve the mystery and protect their community, students must perform careful tests, pool their data, and make wise decisions. We randomly assigned students into groups of three to six, each group representing a fictional community with varying demographics and different pipe compositions (see Figure 1, also Lesson Plan in Online Supplemental Materials). There are three types of community pipelines: lead, half-lead/half-PVC, and PVC. Each has a representative pipe model with a long city pipe and a shorter home line (see Figure 2, with gray representing lead and white PVC). See directions at end of Table 1. Students receive a financial risk slider to track the city’s spending and a lead risk slider indicating the likelihood of lead exposure in each community (see Figure 3). For the mock water-quality tests, two types of water are used: water with washing soda makes up “positive” test samples and distilled water constitutes “negative” test samples. To make positive water, add 3 tablespoons of washing soda to 1 gallon of water and dissolve. Lemon juice and magnesium sulfate (Epsom salt) act as “indicators” for the bacterial test and lead test, respectively. Students should wear protective goggles and avoid touching their eyes, mouth, and face when handling washing soda, Epsom salts, and lemon juice and should wash their hands immediately after the activity.
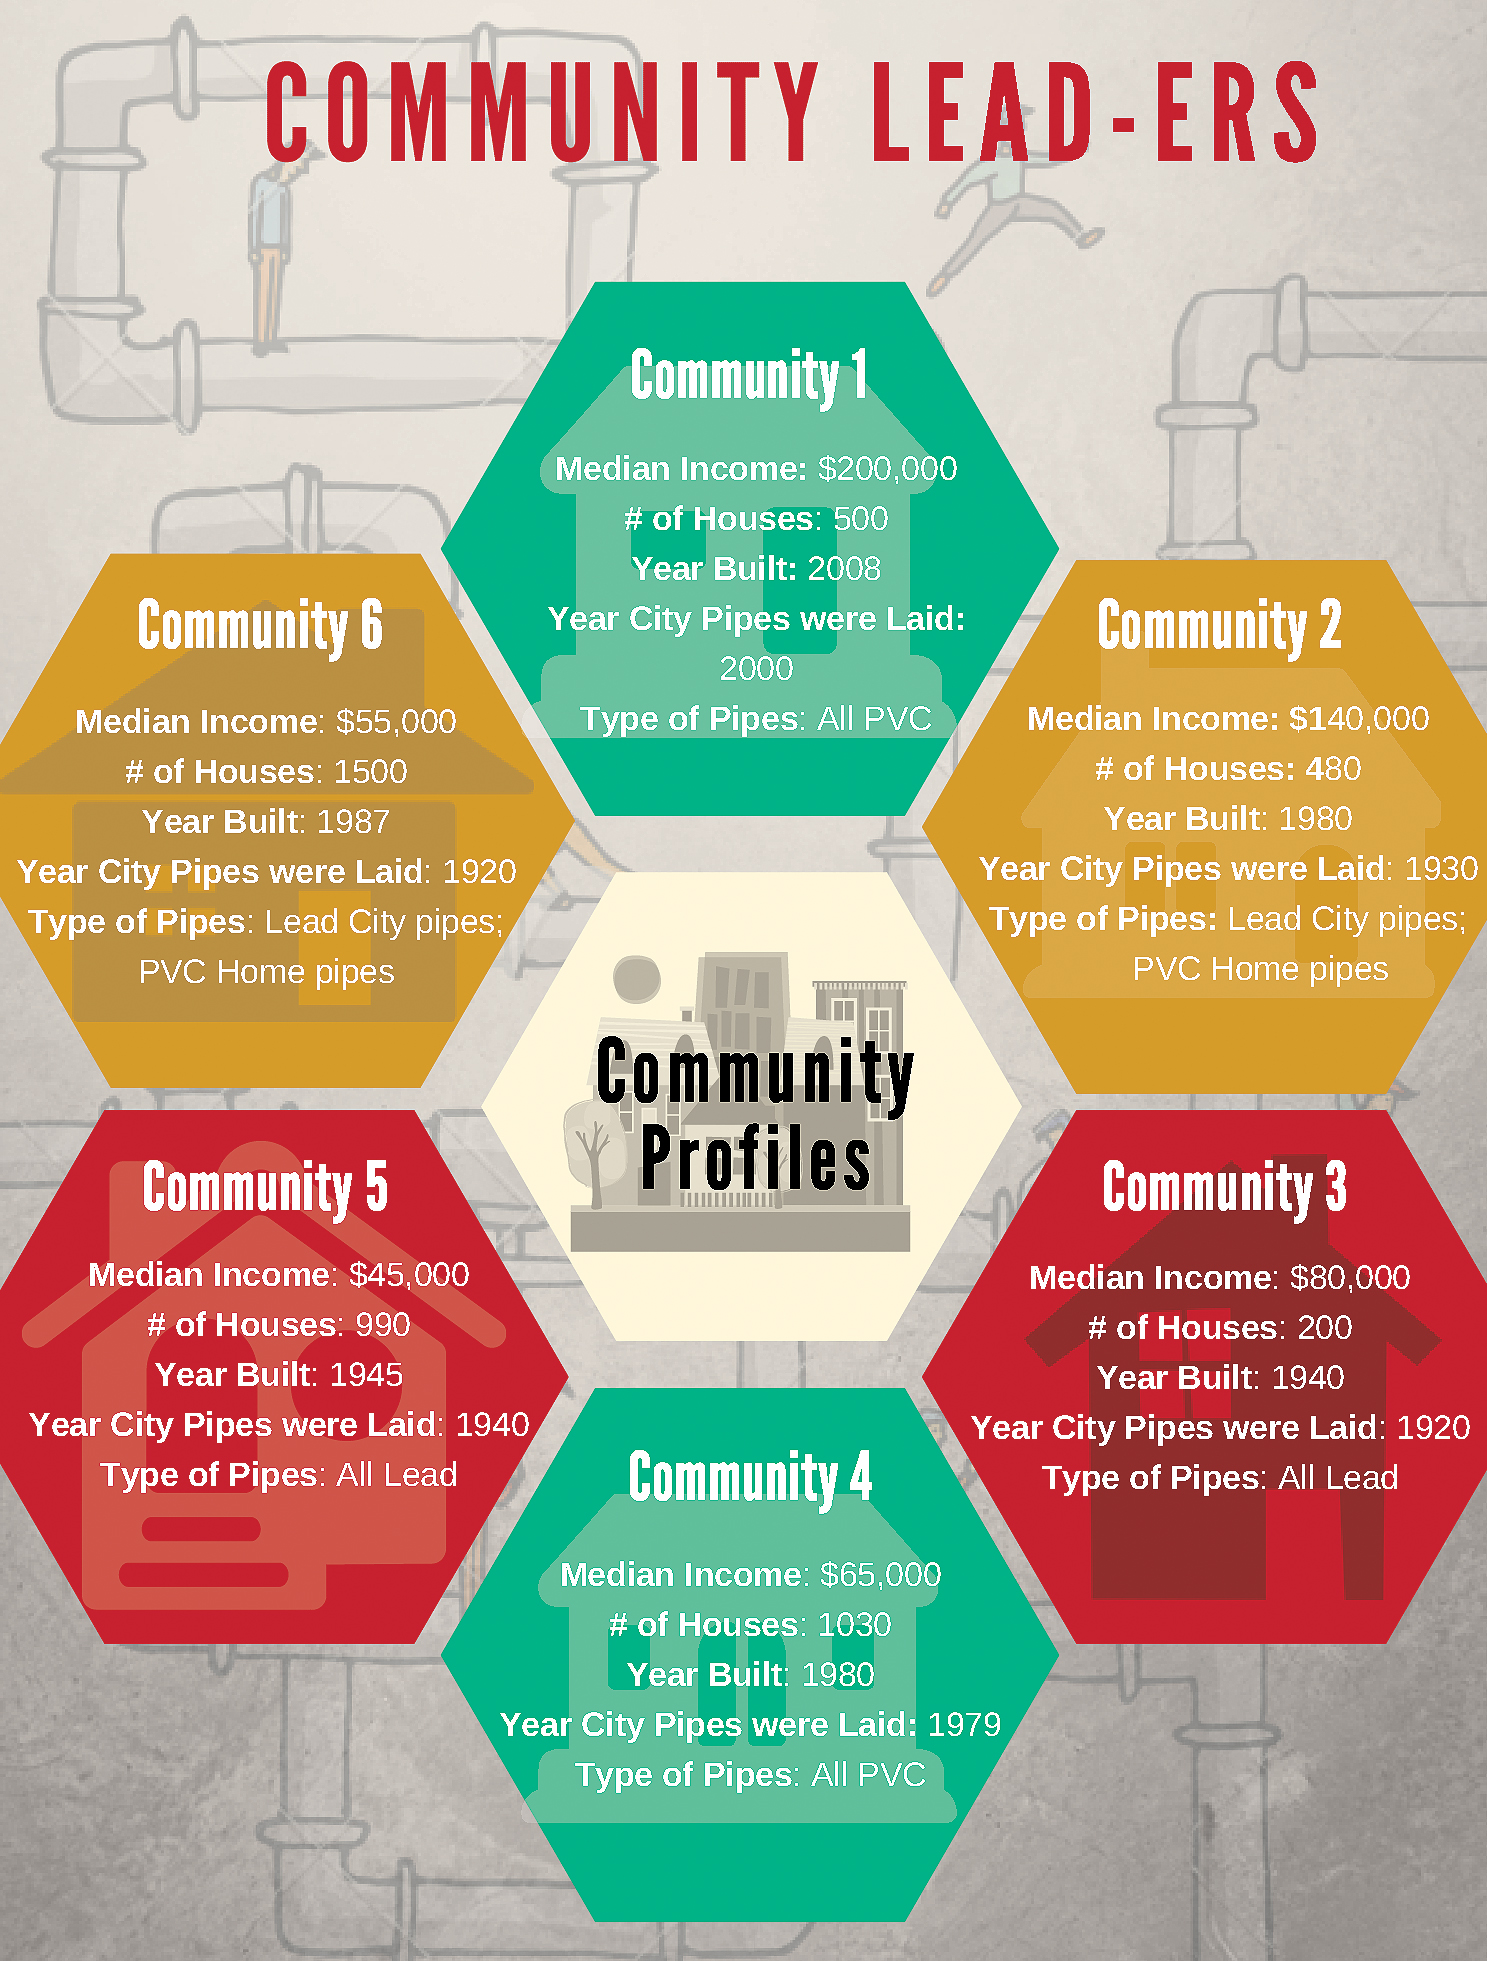
Communities’ information
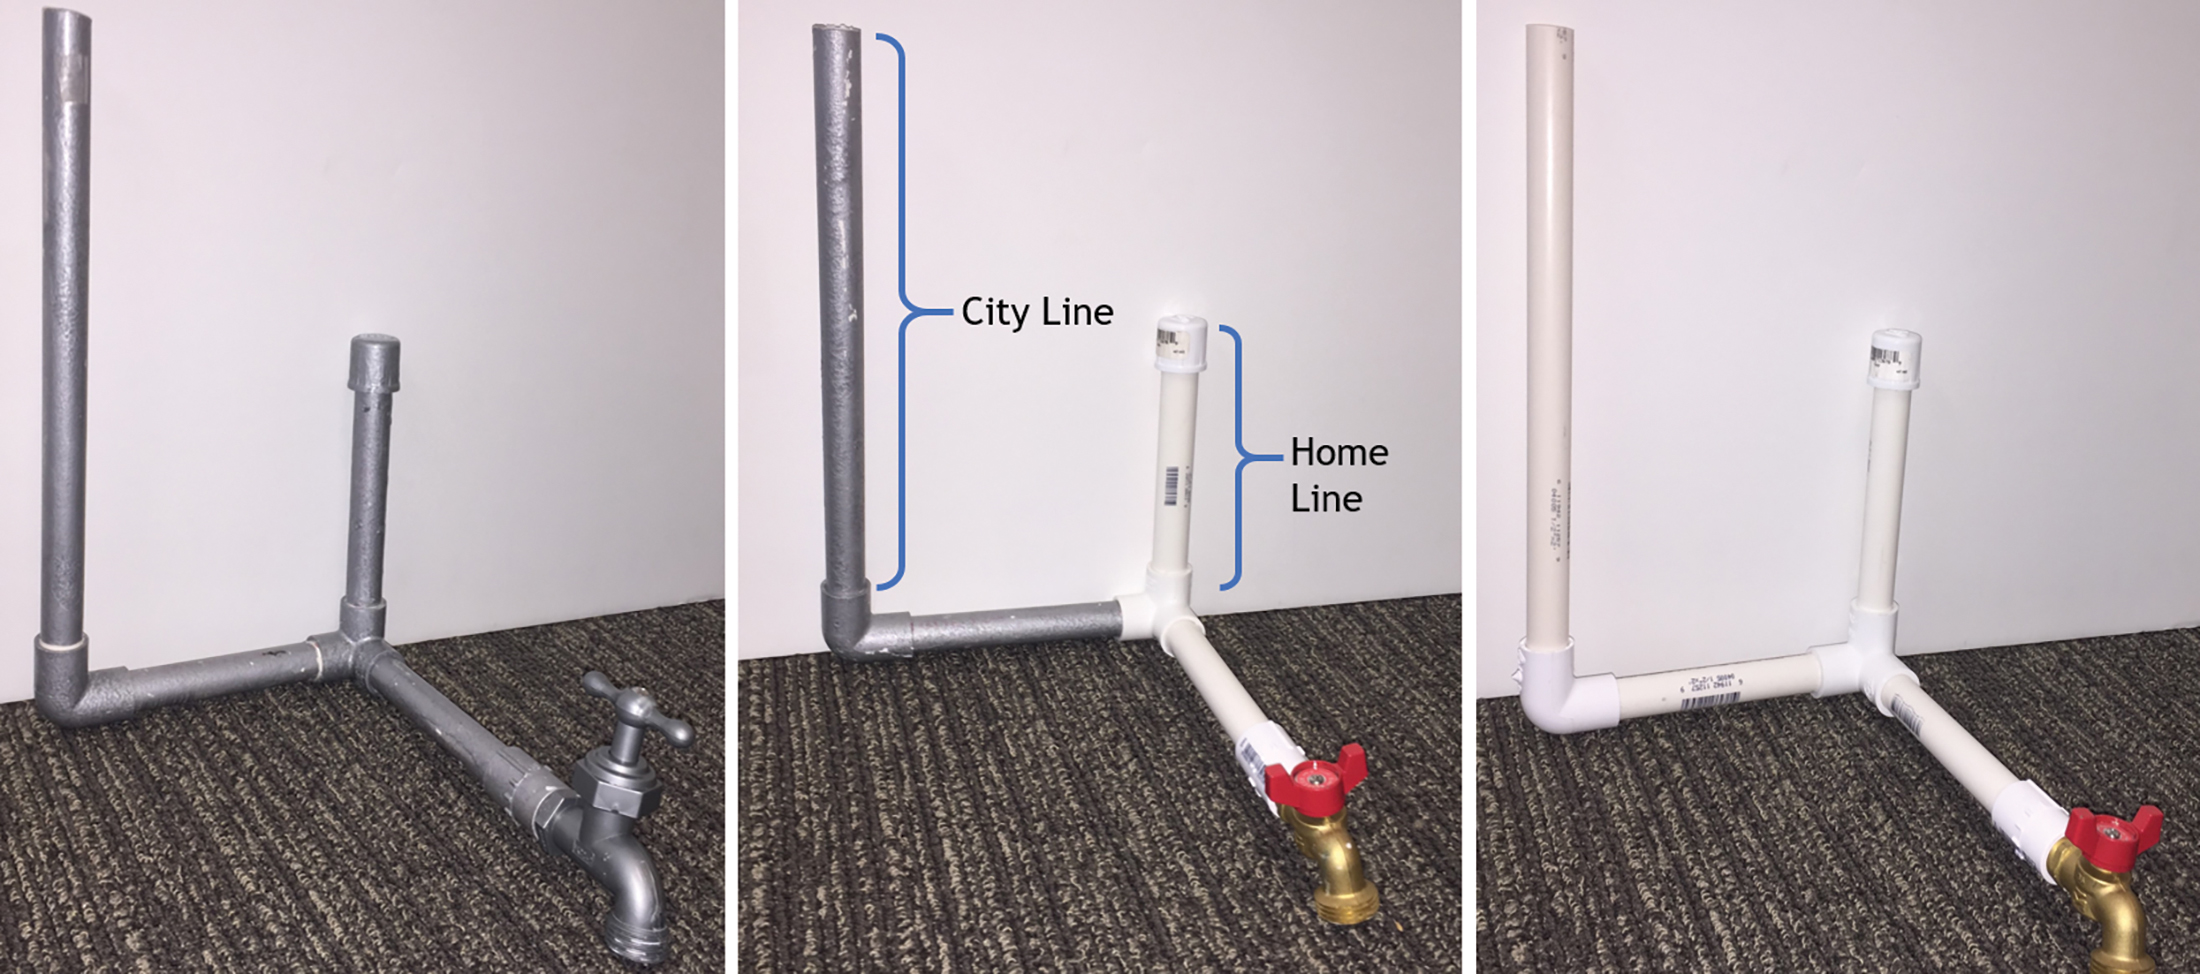
Pipe models left to right: all lead, half lead, and all PVC (gray = lead, white = PVC)
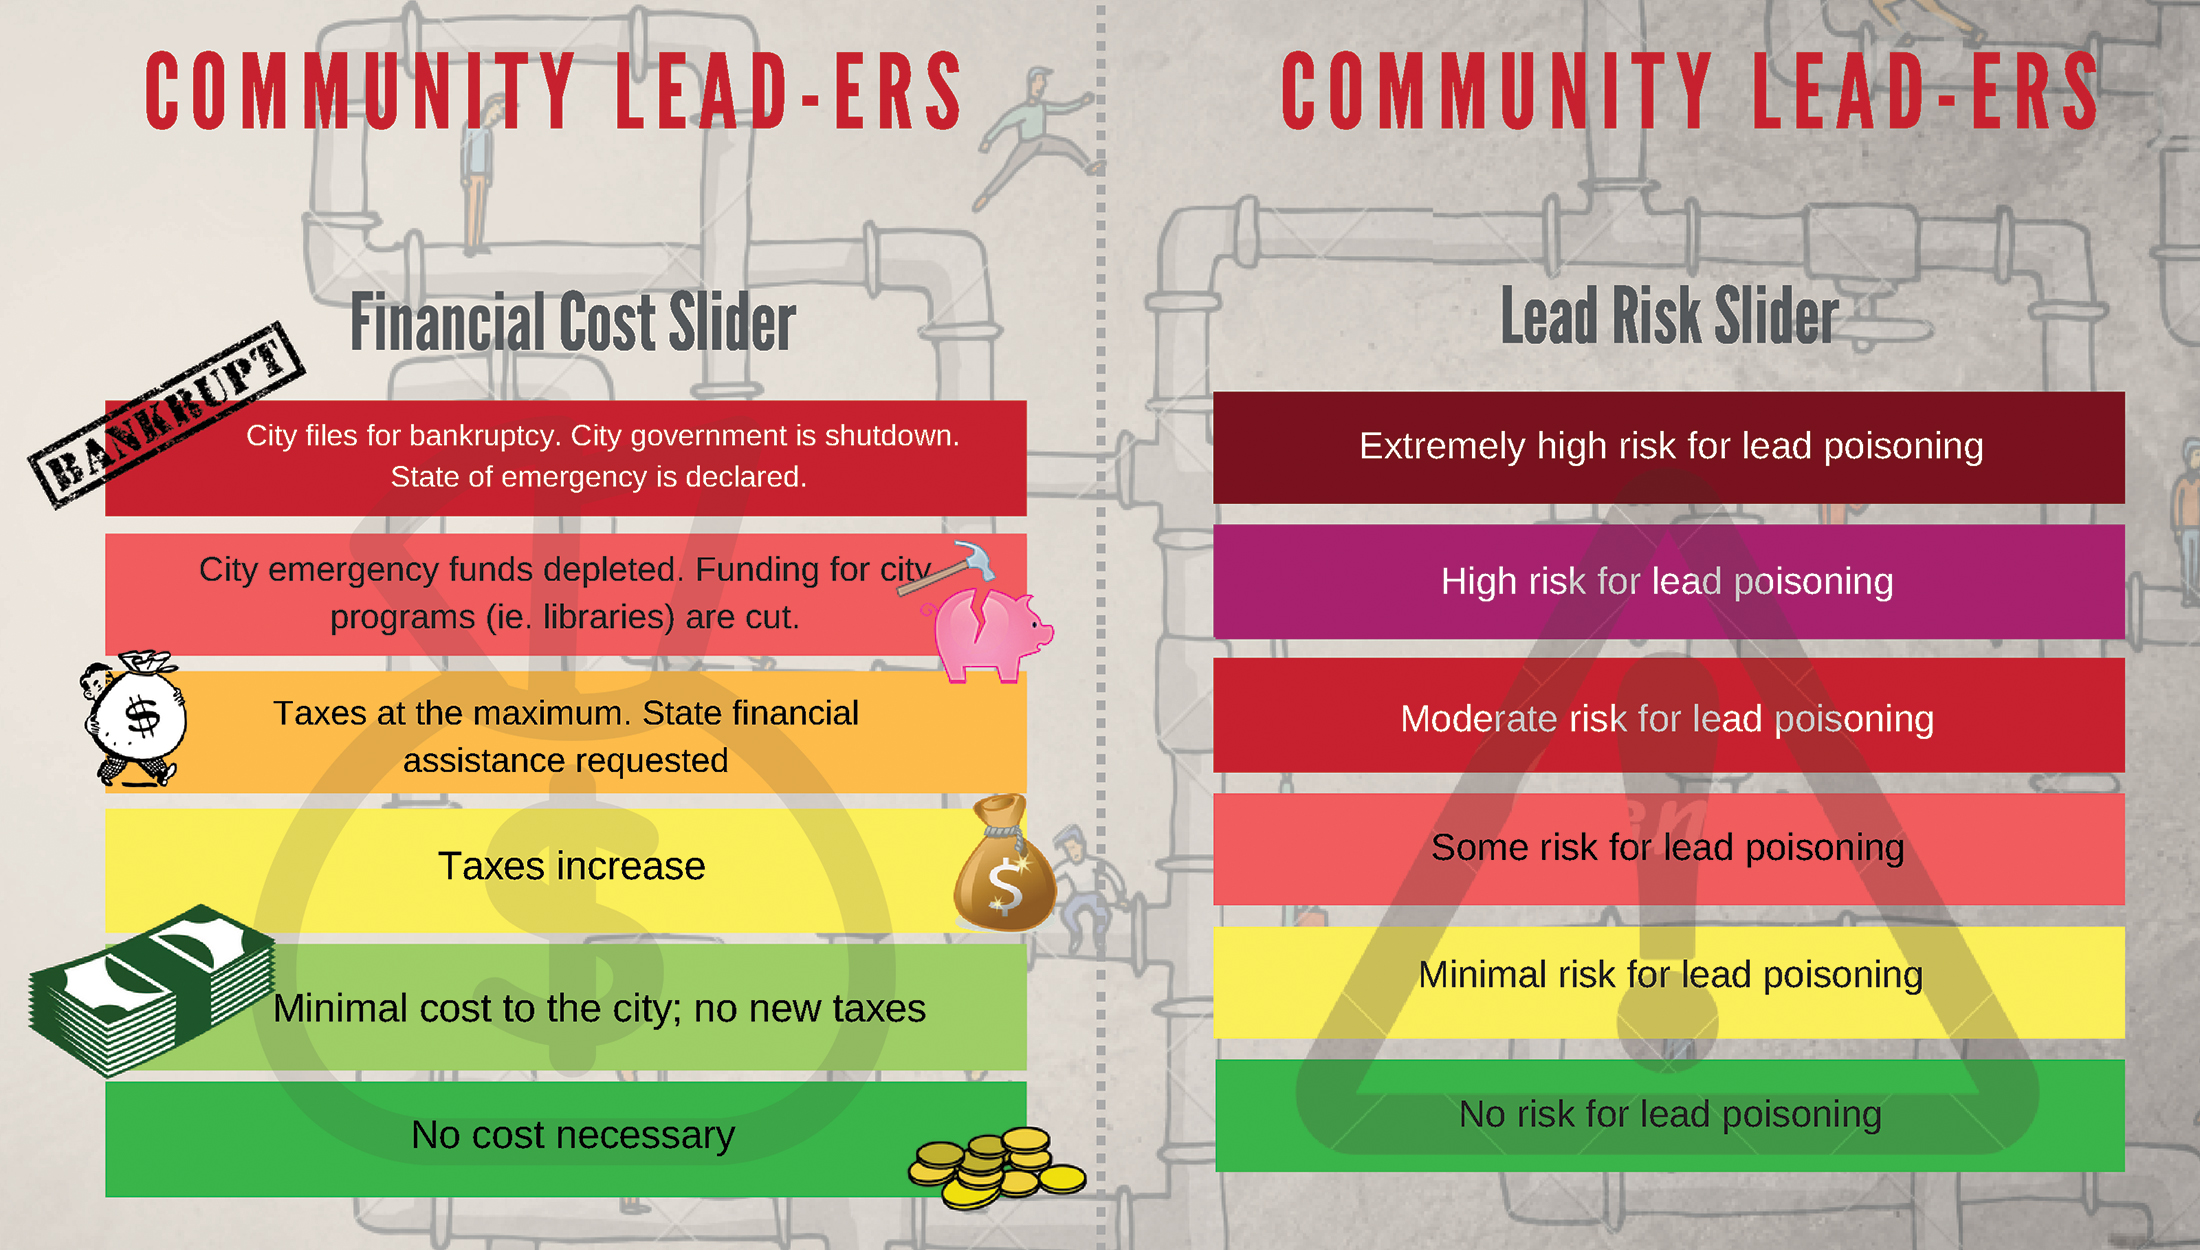
Combined sliders of financial cost (left) and risk of lead poisoning (right)
| Table 1. Materials list and instructions | ||||||||||||||||||||||||||||||||||||||||||||||||||||||||||||||||||||||||||||||||||||
|---|---|---|---|---|---|---|---|---|---|---|---|---|---|---|---|---|---|---|---|---|---|---|---|---|---|---|---|---|---|---|---|---|---|---|---|---|---|---|---|---|---|---|---|---|---|---|---|---|---|---|---|---|---|---|---|---|---|---|---|---|---|---|---|---|---|---|---|---|---|---|---|---|---|---|---|---|---|---|---|---|---|---|---|---|
|
||||||||||||||||||||||||||||||||||||||||||||||||||||||||||||||||||||||||||||||||||||
Phase 1: Chlorination
To introduce the general format of the lesson, we ask students about their knowledge of bacteria and how such contaminants can lead to diseases. After the discussion, each group receives five samples that represent water drawn from their community. To test for the presence of bacteria, the students are then asked to add a few drops of lemon juice (indicator) to each of the five test tubes. If the solution changes color to yellow, the sample is labeled positive for bacteria (see Figure 4). Each group receives one, two, or three positive samples from the total of five samples.
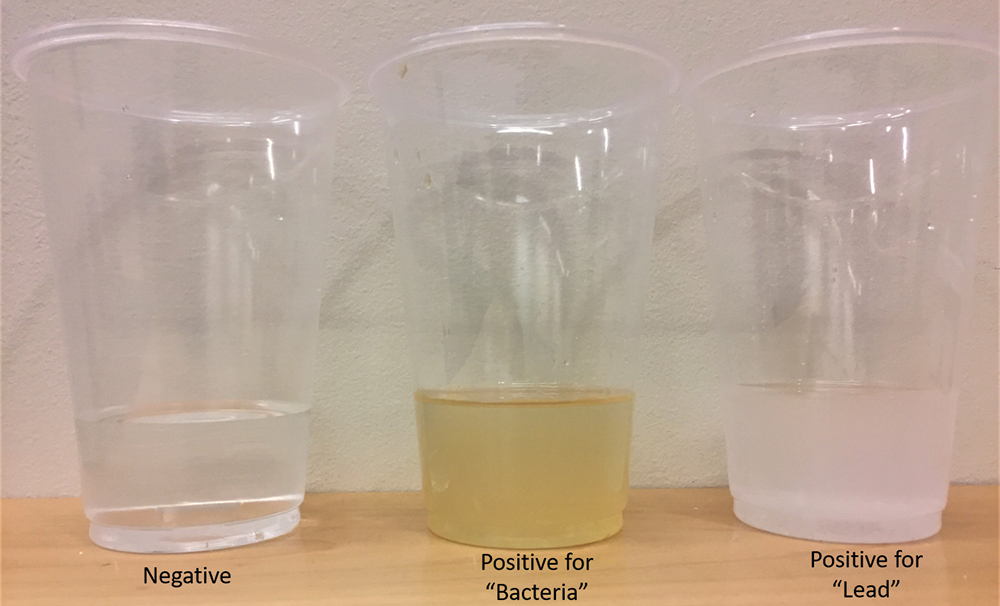
Test result samples
After viewing and discussing a brief video that introduces the use of chlorine to lyse (kill) bacteria by disrupting cell membranes, the students vote on whether to chlorinate the city’s water (see “The Secret Life of Bleach” in Resources). Students must balance the health benefits of water treatment with the financial costs to the city. Following the vote, students justify their positions during a brief discussion. The voting checkpoints found in each phase act as a formative assessment, where students can consolidate new information and must come to a decision. Following are some student rationales:
- Most students vote to chlorinate because they want to prevent people from getting sick due to the bacteria, which causes diseases, and they have enough money to do so.
- Some students vote not to chlorinate because they do not want to spend money when they only have one positive result.
In rare cases where students vote not to chlorinate water, we introduce an order from the Environmental Protection Agency to require the city to chlorinate their water to further the lesson narrative and demonstrate the use of the sliders. The financial slider lists financial costs the entire city incurs as a whole. Each group now receives a cup of water representing their current water and can test the pH, which should be neutral at 7.0. Students add “chlorine” (vinegar) to the cup and move their financial risk slider up one level, increasing the total cost incurred by the city. The students can then test the pH level of the water to see the change in pH, which should be lower than 7 as it is more acidic.
As reflected in the model, the introduction of chlorine to water causes the dissociated hydrogen and oxygen molecules in the water to form hypochlorous acid (HOCl), making the water more acidic. This acidity is measured using the pH scale, which shows the amount of dissociated hydrogen ions (H+) found. The scale starts at pH 1 with the most H+ ions and ends at 14 with the least H+ ions. Because acidic substances have more H+ ions, the pH scale goes from most acidic to most basic, with pH 7 being neutral. The students should understand that changing the acidity of the water is an unintended consequence and is not the reason why the bacteria are removed. As students progress through the chlorination phase, they gain understanding of how their decisions make an impact on their community while learning the concepts of acid-base chemistry.
Phase 2: Lead problem and remediation
We then introduce lead as a contaminant and facilitate a brief discussion with the students around its characteristics. Several characteristics discussed include its wide use as a soft and malleable metal and its risks as a neurotoxin that include slowed developmental growth and behavioral problems. Students are encouraged to ask questions such as “Is lead in pencils?” and answer questions about the possible effects.
Next, the students watch an introductory video on Flint, Michigan and how their pipes were corroded by chlorine (see “Corrosive Chemistry: How Lead Ended Up in Flint’s Drinking Water” in Resources). The corrosion of lead pipes is caused by the oxygen molecules reacting with the lead molecules in the pipes. The reaction exposes more lead, where it can dissolve into the water. One solution is to add orthophosphate or a phosphate buffer into the water. The orthophosphate binds to the lead molecules and increases the pH, which lowers the acidity. With a buffer in place, the pH fluctuates less and is maintained within a certain range, thus the water becomes less likely to cause corrosion. However, if too much acid or base is added, then the buffer can become ineffective.
The lead risk slider is now given to students to study their group’s preassigned risk levels and to rationalize how the recent chlorination increases their lead risk. Here, the students should make a connection to how chlorine makes the water more acidic and reacts with the lead pipes, causing release of more lead molecules into the water and thus increasing their risk for lead poisoning. The students must decide how they could lower their lead risk through three propositions. The choices are a phosphate buffer treatment, replacement of the city lead pipes for the “all-lead” communities, and/or replacement of the lead pipes for the “half-lead” communities (see Figure 5). Each of the choices varies in terms of effectiveness and cost. The students are to use their risk sliders, community profiles, and the science concepts previously explained to form and justify their vote. The students can opt for multiple propositions or none at all, and the consequences outlined in the slider are additive. These are a few examples of the students’ reasoning:
- We voted to replace the lead pipes in all the lead communities because—according to the community profiles—there are more people living in them, so more people would be affected.
- We did not vote for phosphate buffers because we do not want to incur increased taxes. Our risk decreases only by one level, so there is still a high risk of developmental problems for people living there.
- We voted to only replace lead pipes because the buffer is temporary, and the risk of lead pipes is still present. By removing the pipes, we wouldn’t need to worry about lead going into the water at all.
- We have increased risk for lead corrosion as the water is now more acidic due to chlorination. Thus, it is better to just remove the pipes instead of the phosphate buffer.
Proposition table for the lead remediation
|
Propositions |
Proposition 1 |
Proposition 2 |
Proposition 3 |
|
Description |
Add orthophosphate to the city’s water |
Replace the city pipes in “all-lead” communities |
Replace the city pipes in “half-lead” communities |
|
Financial levels |
Move up two levels |
Move up one level |
Move up one level |
|
Lead risk levels |
Move down two levels |
Only “all-lead” communities: Move down one level |
Only “half-lead” communities: Move down one level |
In the second phase, students expand on their knowledge of pH and buffers, which keep the pH within a small range. We lead the discussion through different consequences, such as what happens if a lot more acid is introduced and why does the pH matter or why were certain risks chosen over others. Students make decisions based on their new-found knowledge and the consequences of each remediation choice.
Phase 3: Results
After they vote and the risk levels are calculated, each community “tests” their water for lead. If proposition 2 and/or 3 were chosen, then those respective groups’ models would be reconfigured by replacing the “lead” city line from the triple elbow joint home connector with a city PVC pipe. Each group is given a cup of water containing either negative or positive water, and students then add the “indicator” (magnesium sulfate). If the water turns cloudy, the sample is “positive” for lead (see Figure 4). Whether a group receives a positive sample is determined by their final lead risk level.
- At “extremely high risk” or “high risk,” the groups will receive a positive lead result.
- At “moderate risk” or “some risk,” half of the groups will receive a positive lead result.
- At “minimal risk” or “no risk,” the groups will receive a negative lead result.
This system ensures that there is at least one group with a positive result and shows that lowered risk does not mean no risk. Typically, the class will either choose only proposition 1 or propositions 2 and 3, which often leads to half of the communities being lead positive. Students present their results to the class and explain their results, which are based on probability of risk. The probabilities are based on their previous actions, such as adding a buffer and replacing pipes, which affects the pH level by introducing more H+ ions or maintaining a narrow pH range.
Wrap-up
The lesson concludes with a brief writing activity and guided discussion to debrief the role-playing simulation and assess the degree to which students grasp core ideas. Main themes include (a) the connection between the unintended consequence of chlorinating water (e.g., increased pH) and (b) the tension between potential benefits of using technology (e.g., decreased lead contamination risk) and the associated economic risks. In addition, students are asked to consider how their decisions might change with additional information. For example, student groups that vote to replace lead pipes are subsequently provided with information indicating that lead pipe replacement can accidentally damage water lines and increase the likelihood of lead contamination in the water. Students are asked whether this new information would change their decision to replace lead pipes. In one case, students thought more buffers could be added to the water to solve this issue because more lead corrosion would cause the water to become more acidic. With additional buffers, the water could be prevented from turning more acidic and corrosive. Another group thought the lead removal was too risky and buffers were the main solution.
Conclusion
The purpose of this lesson is to use a role-playing simulation on a topic connected to a real-world controversy to introduce middle school students to a set of interdisciplinary concepts drawn from physical science (chemical reactions) and Earth science (human impacts on the environment). Although this article focuses on using this simulation to address these ideas over the course of one or two class periods, the basic structure of the role-playing lesson is highly adaptable and could easily be expanded to discuss additional concepts. For example, in the interest of brevity, this article does not describe physiological effects of lead and its ecological consequences. Depending on the needs of a particular curriculum, the basic role-playing simulation could be expanded to incorporate these topics.
Resources
“The Secret Life of Bleach” (short version). www.youtube.com/watch?v=jpfXxfu4yGM
Chain, L. 2016, February 25. Corrosive chemistry: How lead ended up in Flint’s drinking water. Scientific American. www.scientificamerican.com/video/corrosive-chemistry-how-lead-ended-up-in-flint-s-drinking-water1/
Online Supplemental Materials
Lesson plan—https://www.nsta.org/online-connections-science-scope
Isabelle Nguyen (itnguyen@uh.edu) is an alumnus of the Honors College, Athulya Johnson is an alumnus of the Honors College, and Andrew Kapral is the director of Engaged Data Science at the Hewlett Packard Enterprise Data Science Institute, all at the University of Houston in Houston, Texas. Abel Chacko is a public health analyst at Harris County Public Health in Houston, Texas.
Chemistry Safety STEM Middle School