
feature
Student Performance in Ground Versus Online Sections of a Biological Science I College Course
A Comparison Based on a Common Final Exam
Journal of College Science Teaching—November/December 2021 (Volume 51, Issue 2)
By Peggy Romeo, Marcela Trevino, Frederick Posey, and Scott Romeo
This study is a comparison of ground-based versus online student performance using a combination of common final examination scores and associated demographic data in a biological science college course taught by a single instructor. Multivariate and standard statistical analyses are used to examine data from five semesters of ground and online instruction. Overall, students in ground course sections scored higher than those in online sections. Demographic comparisons of the pooled student populations from all five semesters show that there was a larger proportion of female than male students in both ground and online sections. Moreover, most students in ground sections were of traditional college age (18 to 24 years old), whereas online, the majority consisted of roughly equal numbers of college-age and post-college-age students (older than 24 years old). High school–age students (younger than 18 years old) constituted the minority in both the ground and online sections, with their proportion being smaller in the latter. Regardless of gender and age group, ground students scored higher than online students. Additionally, the course pass rate was greater overall for ground students than for online students; this contrasted with the course withdrawal rate, which was greater for online students.
Several studies have been conducted to compare effectiveness in student learning among various course-delivery methods. The terminology used in the literature to describe such delivery methods varies. For example, classes taught in a conventional classroom setting may be referred to as traditional classroom, face-to-face, or ground, while those delivered through an online learning management system may be described as online, distance, or remote instruction. Moreover, online learning may involve synchronous and/or asynchronous student participation. There are also hybrid courses that, while employing a combination of ground and online methods, do so to varying degrees. For the purposes of this study, we use the terms ground (i.e., traditional, face-to-face classes) and online (i.e., asynchronous, using Canvas as the online course management system) to differentiate between our two delivery modes for a Biological Science I lecture course.
Another challenge in making comparisons across studies stems from the fact that the types of assessments used to measure student learning can vary widely. A few authors relied solely on student surveys (e.g., Bergstrand & Savage, 2013; Cooper, 2001; Finlay, 2004; O’Brien et al., 2011; Perez-Prado & Thirunarayanan, 2002; Ryan, 2000), others used paper-and-pencil exams (e.g., Romeo & Posey, 2013), and yet others employed exams delivered through an online platform (e.g., Jorczak & Dupuis, 2014). Furthermore, exams may be either closed or open book (e.g., Lyke & Frank, 2012) and either nonproctored (e.g., Anstine & Skidmore, 2005; Keramidas, 2012; Spivey & McMillan, 2014), proctored by the course instructor in the classroom (e.g., Spivey & McMillan, 2014), proctored by a third party in a testing center, or conducted through proctoring software (in the case of tests administered online). Results from studies based on consistently proctored exams vary. For example, some authors report no differences in common final exam scores between ground and online delivery modes (Brown, 2012; Elvers et al., 2003; Hauck, 2006; Leasure et al., 2000; Stack, 2015; Summers et al., 2005), while others found higher exam scores in ground courses (Harrington, 1999; Morgan, 2015; Terry et al., 2009). Based on a midterm and a final exam, Carbonaro et al. (2006) found inconsistent results; while there was no performance difference between the two delivery modes on the midterm, ground students performed higher than online students on the final exam.
Our literature search yielded abundant articles comparing ground versus online instruction in multiple disciplines and academic and professional certification programs. We found relatively few comparative studies involving college biology courses. In a comparison of ground and online sections of the same biology course, Garman and Good (2012) found that the final course grade was significantly higher for students in ground classes. Beatrice Gonzalez (2014) compared three delivery modes of a biology course by measuring student performance on a common final exam. The courses were taught using a hybrid delivery mode (online lectures with in-class labs) and two different ground delivery modes, namely separate lecture and lab classes, with lecture and lab combined. Gonzalez (2014) reported the highest percentage of student success in the ground instruction with lecture and lab combined, followed by the hybrid mode, with the ground with separate lecture and lab mode yielding the lowest scores.
Given the increasing number of students enrolling in our online sections of this course at Florida SouthWestern State College, we were interested in assessing the effectiveness of our online instructional approach in comparison to that used in the ground classroom setting. This course was particularly suited for our analysis because (a) we could control for instructor; (b) it is a high-enrollment science course; (c) student gender, age, and course grade data were available for five semesters; and (d) we could make use of an in-house common final exam (CFE) as a quantitative tool to assess student learning. The CFE was administered as a closed-book, proctored exam to students in both ground and online sections.
Methods
During the spring 2012 semester, our biology faculty created a CFE to be used for assessment purposes in our Biological Science I course. This CFE is a comprehensive exam that assesses all course learning outcomes, and it consists of 28 multiple-choice questions, two for each of the 14 learning outcomes. Through a series of revisions, the questions were modified and improved in accordance with reliability guidelines for creating suitable test questions (Haladyna et al., 2002; Popham, 2009). The same CFE was used for the entire study period, which consisted of five semesters (from spring 2013 through spring 2015, excluding summer terms). Ground and online sections were taught by the same full-time instructor, who has more than 25 years of college teaching experience. The instructor pre-recorded her lectures and made them available online to all students; those in ground sections received additional face-to-face classroom lectures. Lecture notes, closed-book exams (including the CFE), and homework assignments were identical for both delivery modes. All students had a week to complete assignments; however, online students were given a week to access their exams, whereas ground students were required to attend a specific class time to take them. Students in ground sections were given paper-and-pencil exams, proctored by the instructor, whereas students in online sections took the same exams online, proctored at the college testing center.
Students earned overall course letter grades based on the percentage of total course points as follows: 90%–100% = A, 80%–89% = B, 70%–79% = C, 60%–69% = D, < 60% = F; a W was assigned for student-initiated withdrawals. The weight of the CFE on the overall course grade was 15%. Unless students had previously taken and passed the co-requisite biology laboratory course, they took the course concurrently with different instructors, either through ground or online delivery, at their own choosing.
Of the 365 students initially enrolled in ground sections, 307 took the CFE, 45 completed the course but did not take the CFE, and 13 officially withdrew from the course before the CFE was administered. For online sections, the initial enrollment was 331 students, of which 238 took the CFE, 57 completed the course but did not take the CFE, and 36 officially withdrew before the CFE was administered. The student population includes dual-enrolled high school students. Although our college has an open enrollment policy, high school students are required to have and maintain a minimum GPA of 3.0 to be dual-enrolled. Student gender and age data were obtained from three separate college student records files; age groups were arbitrarily defined as high school age (HS) = younger than 18 years old; college age (C) = 18 to 24 years old; and post–college age (PC) = older than 24 years old.
We used XLSTAT to compare sections from all semesters using five available variables (e.g., delivery mode, CFE score, age group, gender, and course letter grade) through an agglomerative hierarchical cluster analysis, for which gender and course grade (excluding Ws) were converted to numbers (1 or 2, and 1 to 5, respectively). We used Microsoft Excel to calculate mean and standard deviation (SD), perform t tests, and create graphs (Table 1).
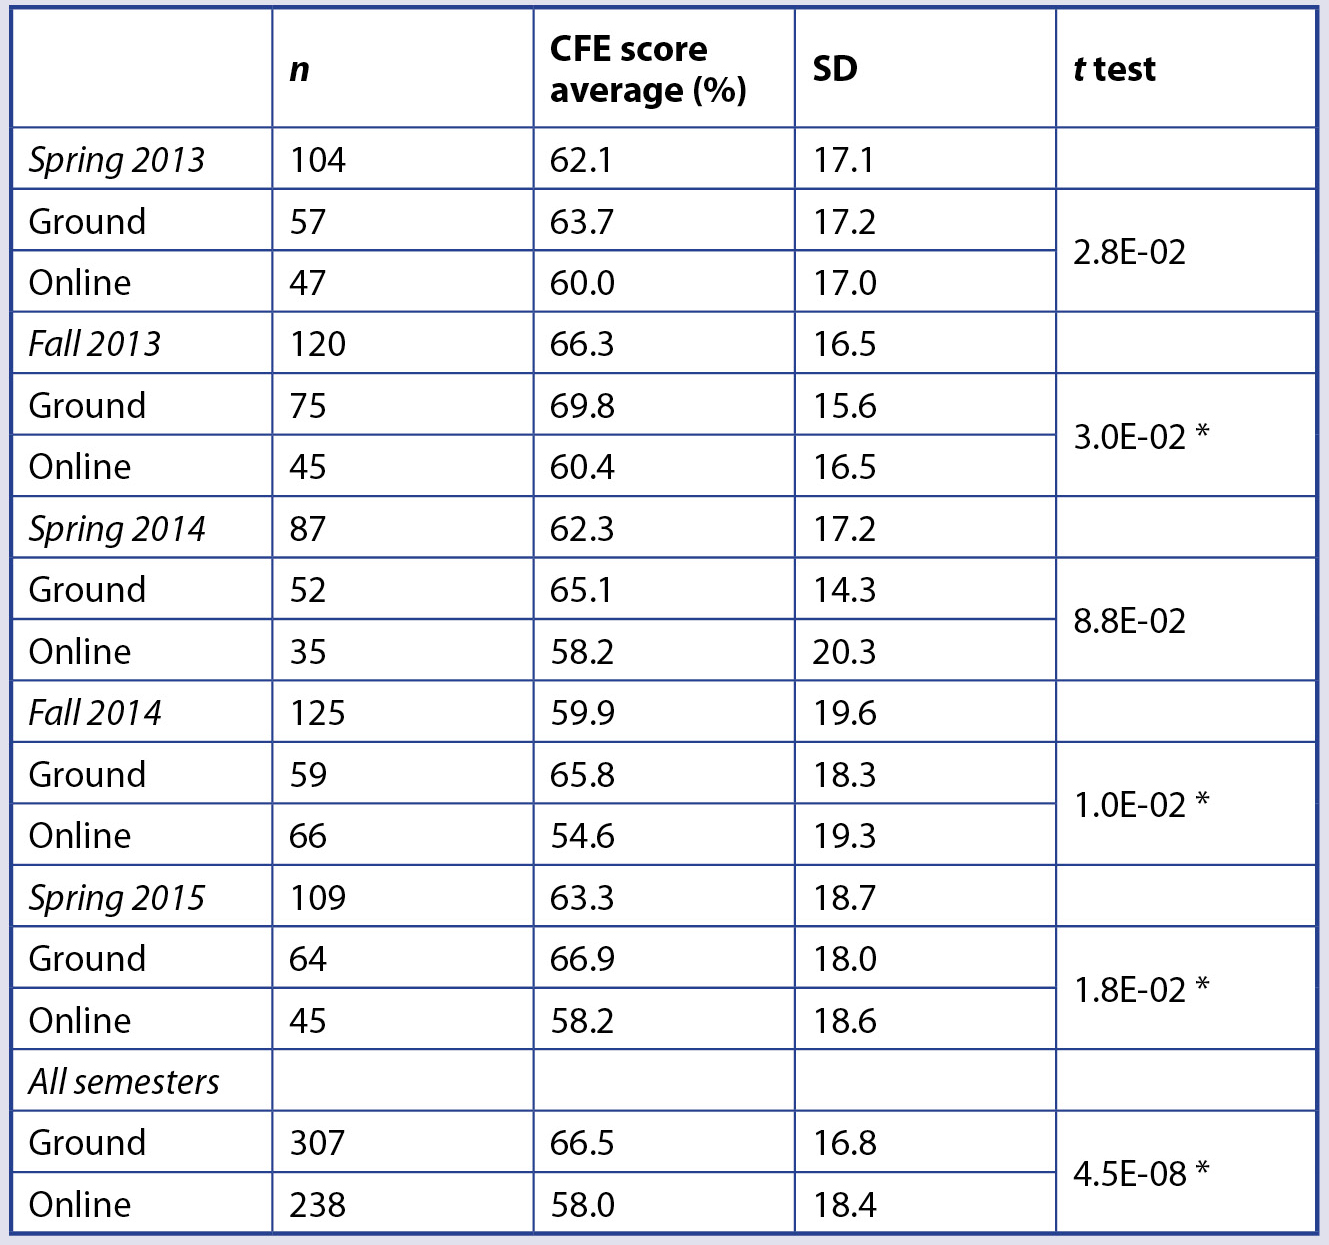
*Indicates a statistically significant difference between ground and online CFE score averages (p < .05).
Results and discussion
Since we had access to multiple variables (e.g., delivery mode, semester, CFE score, age group, gender, and course letter grade), a multi-varied analysis was first used to measure the extent of dissimilarity between ground and online sections from each of the five semesters under study (i.e., analyzed as 10 data sets), giving equal weights to all variables under consideration. The resulting dendrogram (Figure 1) clusters the 10 data sets into two groups (cophenetic correlation = .871), indicating the existence of a high dissimilarity
(̴ 9.5) between ground and online sections. Given this clear separation of sections by delivery mode, we then compared ground versus online sections based on the remaining variables.
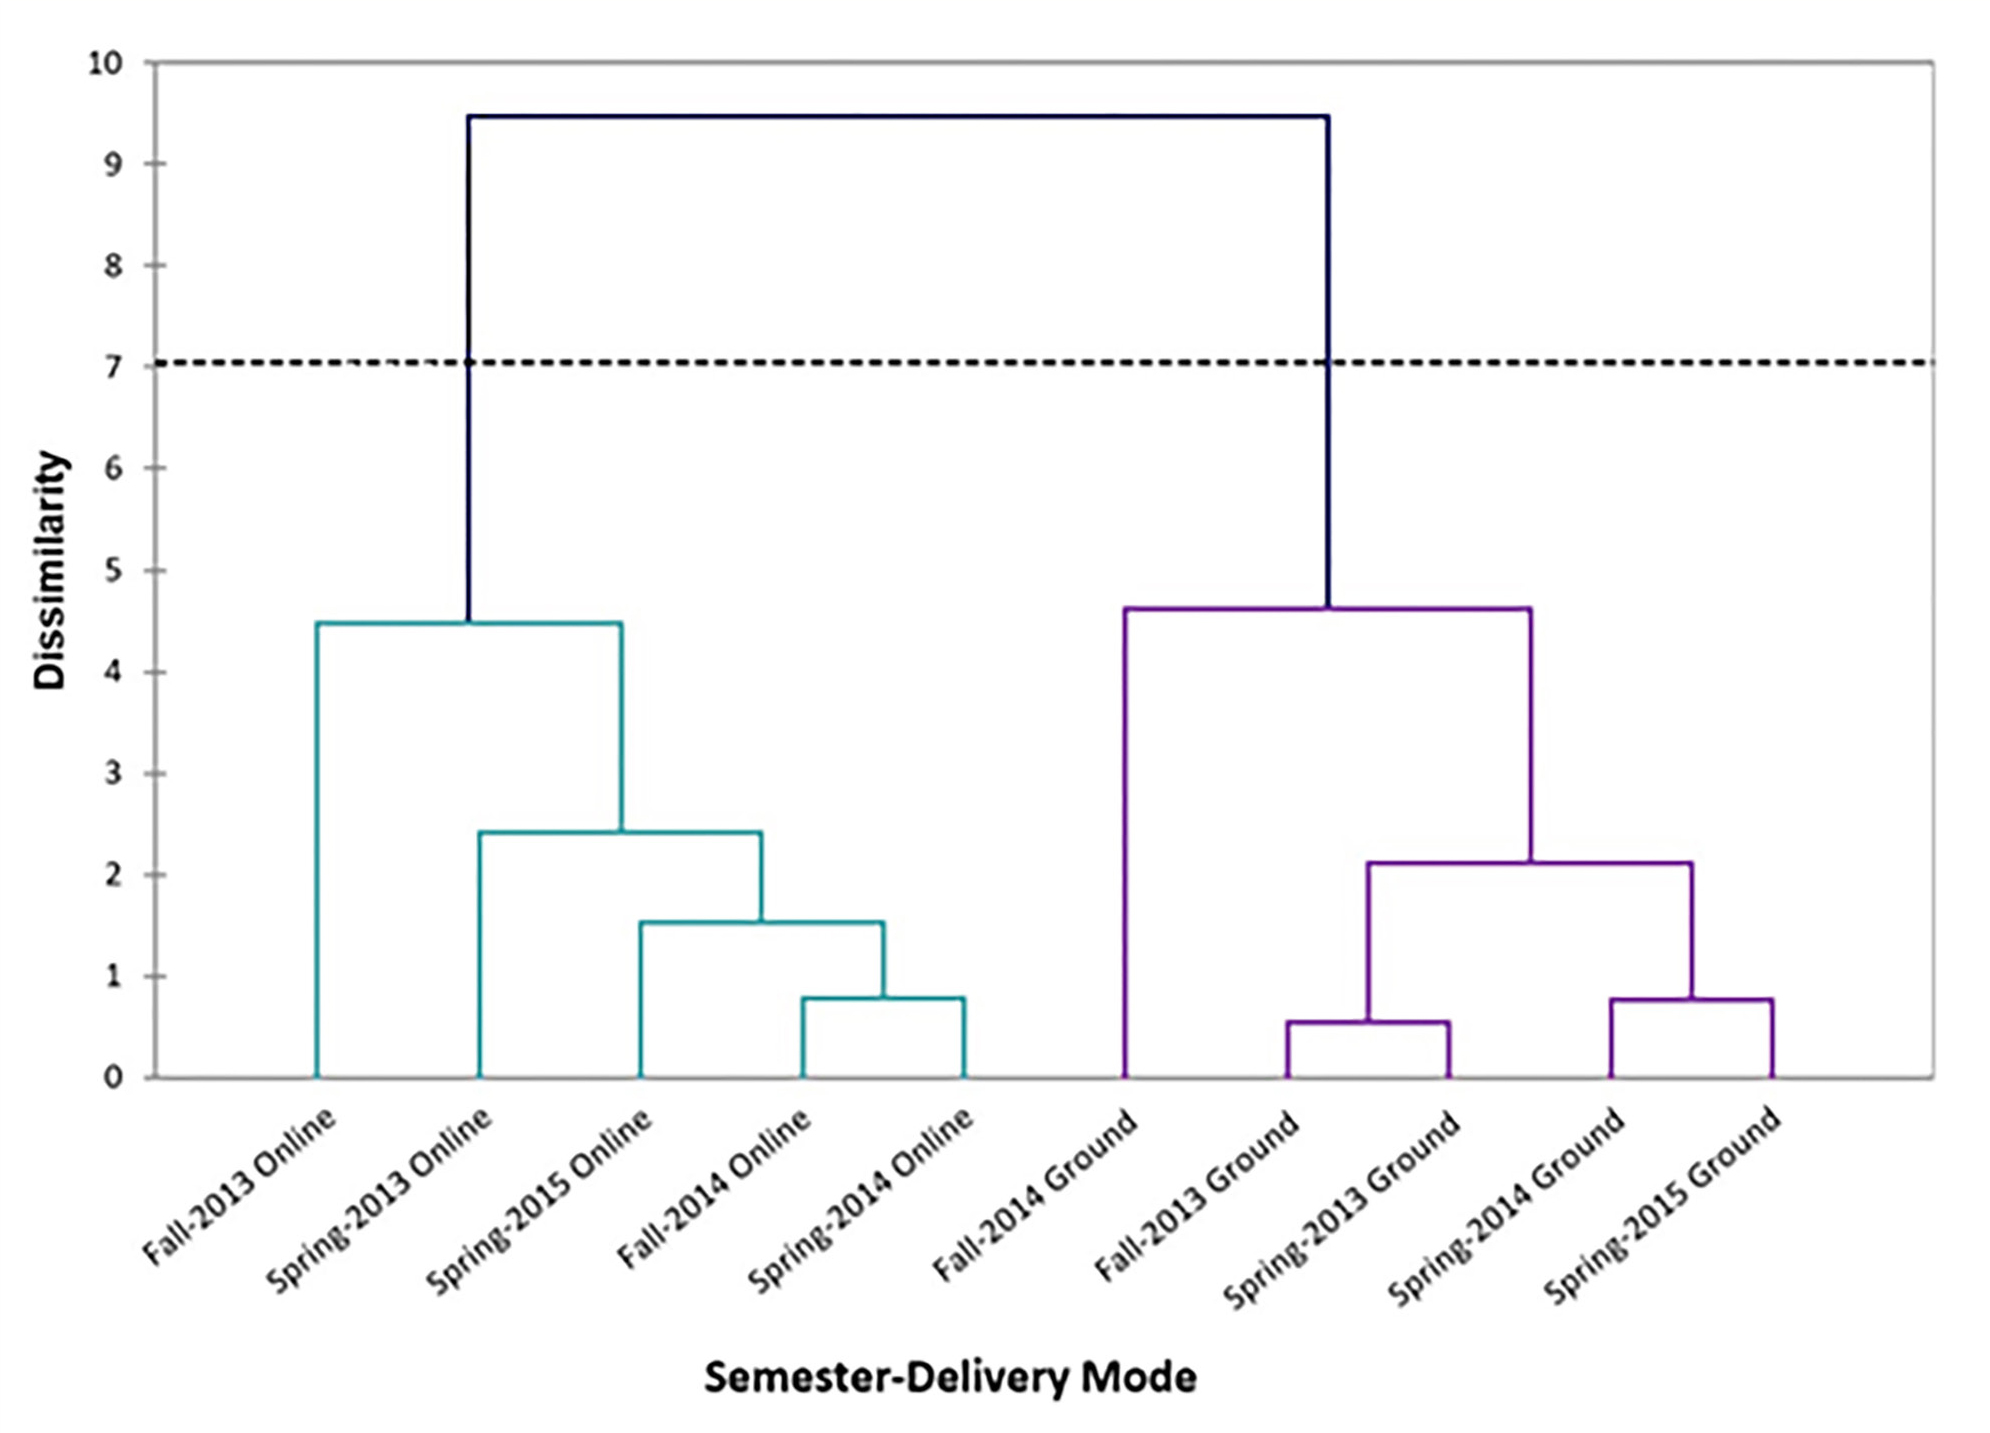
Dendrogram from a multi-varied analysis of ground and online section data throughout the study period.
Note. Data from five semesters were compared by agglomerative hierarchical cluster analysis, giving equal weights to all available variables: delivery mode, semester, CFE score, age, gender, and course grade. The dotted line indicates automatic truncation (dissimilarity: Euclidean distance; agglomeration method: unweighted pair-group average; cophenetic correlation = .871).
CFE scores
We used t tests to compare CFE score averages for ground and online sections for each semester and for all semesters combined (Figure 2). The CFE score average is significantly higher (p < .05) for all ground semesters combined than for online semesters combined. When we compared individual semester data, all ground CFE averages were consistently higher than online CFE averages, with the difference being statistically significant (p < .05) for three (namely, fall 2013, fall 2014, and spring 2015) of the five semesters.
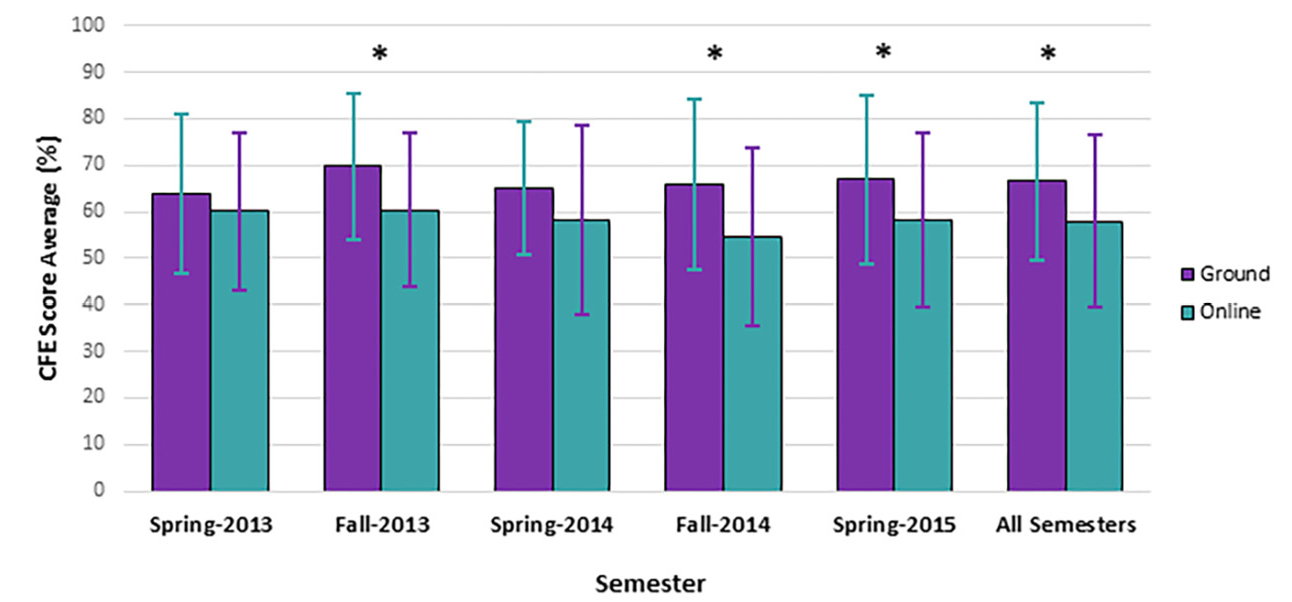
Comparison of CFE score averages between ground and online sections throughout the study period.
Note. CFE score averages from ground and online sections were compared for each semester and overall using t tests; error bars represent ± SD, and asterisks indicate a statistically significant difference (p < .05). See Table 1 for plotted data values.
Demographics
To compare student demographics in ground and online sections, we calculated the percentage of male and female students in each of the following age groups: high school (HS, younger than 18 years old), college (C, 18 to 24 years old), and post-college (PC, older than 24 years old; see Table 2). In both ground and online sections, the percentage of female students was much greater than the percentage of male students in all but one age group, where the number was equal (HS, online). Overall, there were almost twice as many female students than male students in ground sections (62.9% versus 37.1%), and more than three times as many in online sections (75.6% versus 24.4%).
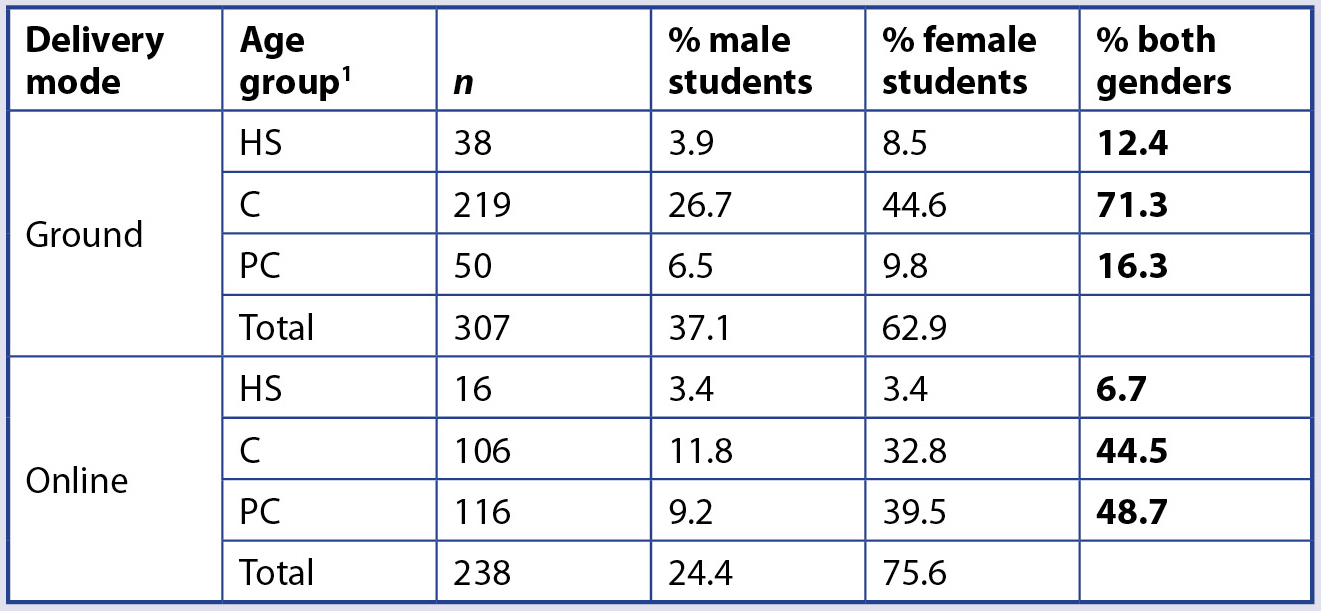
1 HS = high school age (younger than 18 years old); C = college age (18 to 24 years old); PC = post–college age (older than 24 years old).
In ground sections, most students (71.3%) were college age, and the percentage of high school and post–college age students was similar (12.4% and 16.3%, respectively). In contrast, online sections had about the same percentage of college and post–college age students (44.5% and 48.7%, respectively), with a small percentage (6.7%) of high school–age students. The largest group in the study consisted of college-age students in ground sections (219 students, or 40% of the total); the smallest group was high school–age students in online sections (16 students, or 2.9% of the total).
While ground sections performed better than online sections on the CFE, it is possible that their distinct demographic differences could have been a contributing factor. Thus, we ran separate CFE average score comparisons between ground and online sections for each individual demographic group (Figure 3). Regarding gender, both male and female ground students scored higher than their online counterparts, with the difference being statistically significant (p < .05) for females. When comparing student performance between age groups, ground students consistently performed better than those online, regardless of age, with the difference in CFE score average being statistically significant (p < .05) for both college and post-college-age groups.
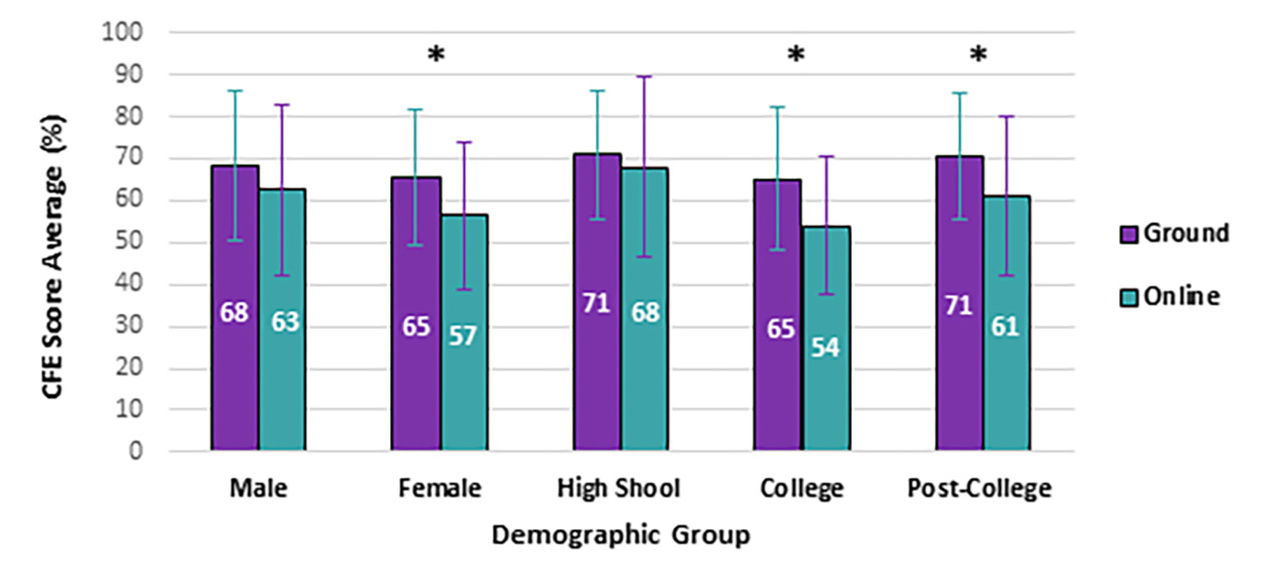
Ground vs. online CFE score averages across demographic groups.
Note. CFE score averages from all semesters were compared separately for each demographic group in ground and online sections using t tests; error bars represent ± SD, and asterisks indicate a statistically significant difference (p < .05). High school = younger than 18 years old; college = 18 to 24 years old; post-college = older than 24 years old. See Tables 4 and 5 for plotted data values.
While Figure 3 is intended to compare CFE performance of ground versus online students by demographic group, it also shows variability in CFE performance within gender and among age groups. (See Tables 4 and 5 for plotted data values for Figure 3.) We performed t tests to investigate whether these differences were statistically significant (Table 3) and found that male students significantly (p < .05) outperformed female students. The difference was not statistically significant between college and post–college age students, but the CFE score average for high school students was significantly higher (p < .05) when compared to the other age groups. A contributing factor for this could be the fact that high school students enrolled at the institution are required to maintain a minimum GPA of 3.0, whereas the rest of our student population is under an open enrollment policy.
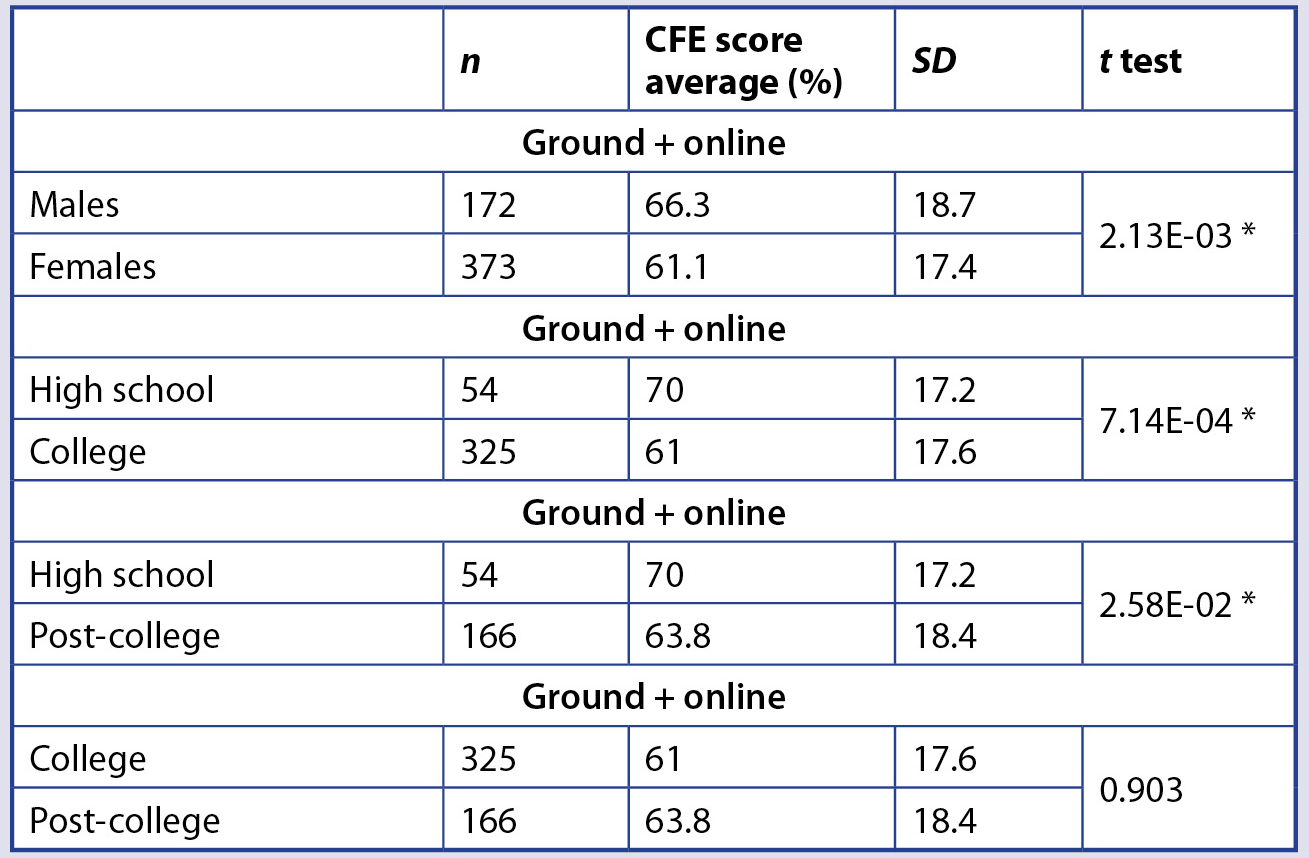
*Indicates a statistically significant difference between demographic groups’ CFE score averages (p < .05).
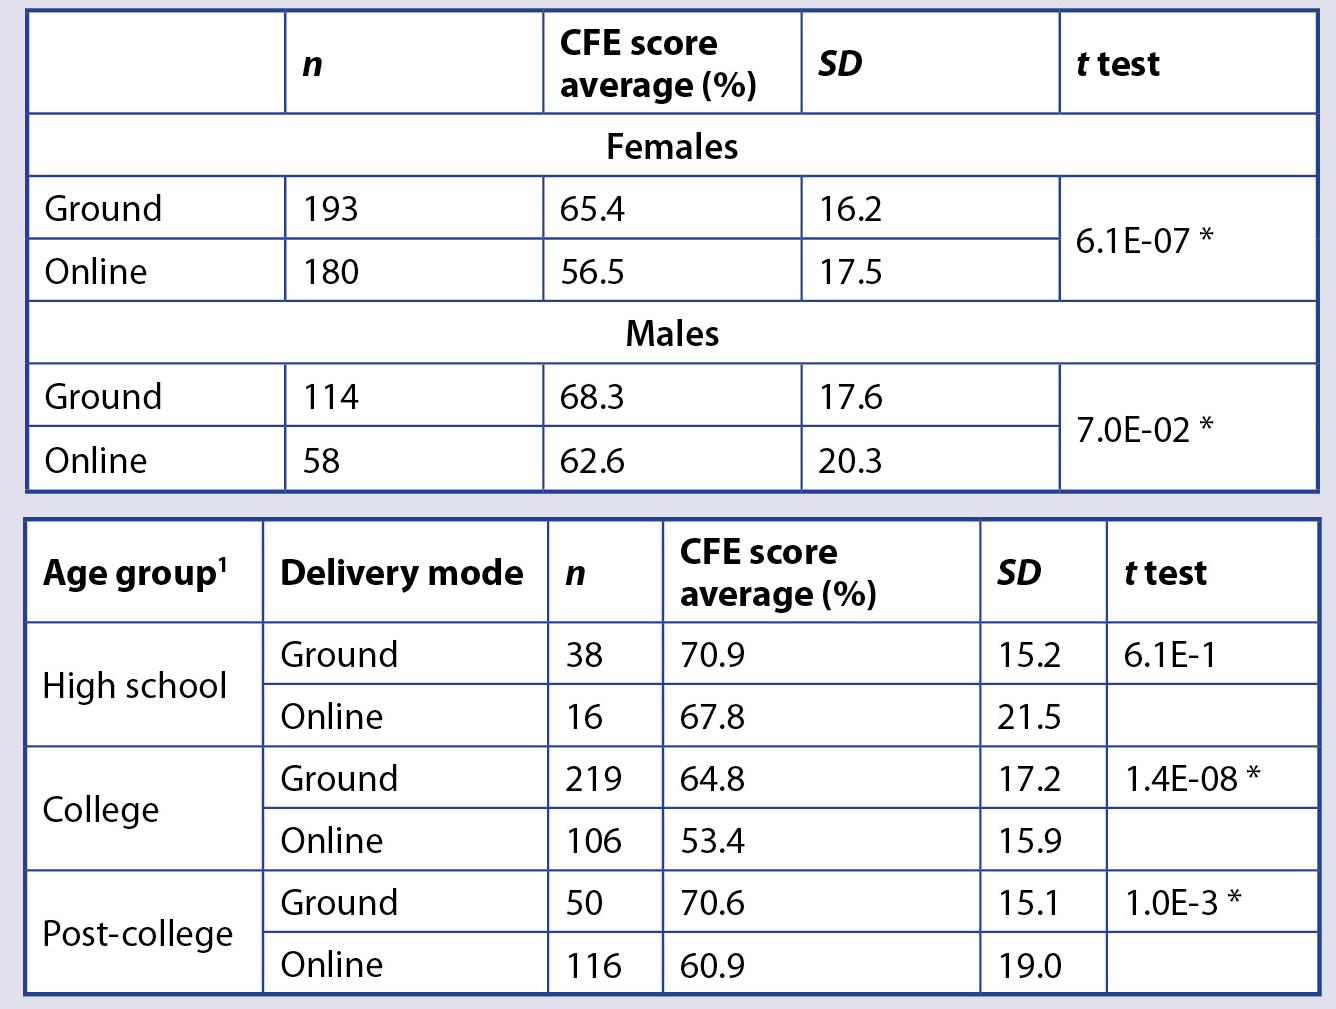
TABLE 4 (upper). Sample sizes, CFE score averages, standard deviations, and t test values comparing ground and online delivery modes by gender.
*Indicates a statistically significant difference between ground and online CFE score averages (p < .05).
TABLE 5 (lower). Sample sizes, CFE score averages, standard deviations, and t test values comparing ground and online delivery modes by age group.
1 High school = younger than 18 years old; college = 18 to 24 years old; post-college = older than 24 years old.
*Indicates a statistically significant difference between ground and online CFE score averages (p < .05).
Course letter grade
The data thus far presented provide a somewhat incomplete and skewed picture of student performance, as they only include those students who took the CFE. As shown in Table 6, 84% of ground students participated in the CFE, as opposed to 72% of online students. Importantly, the proportion of students who did not take the CFE but did not officially withdraw from the course is greater in online sections (17% versus 12% in ground sections). It is also noteworthy that a greater proportion of online students (11%) than ground students (4%) officially withdrew from the course.
Figure 4 provides a more comprehensive representation of student success by comparing course letter grade distributions for all initially enrolled students, regardless of whether they took the CFE. All passing letter grades (A–D) are normally distributed for both ground and online sections, with a consistent trend of slightly more successful performance by ground students. This is especially evident when all passing letter grades (A–D) are compiled (78% pass rate for ground versus 68% for online students). The trend is reversed for grades of F and W, with a more pronounced difference between delivery modes for W (11% online versus 4% for ground students).
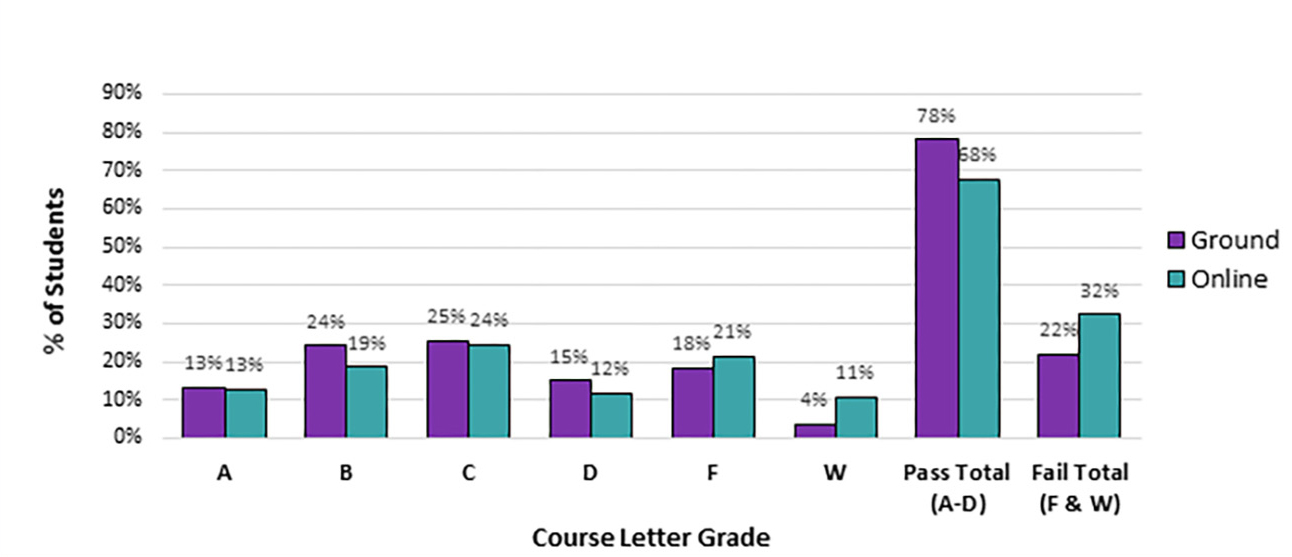
Comparison of course letter grade distributions between ground and online delivery modes.
Note. The percentage of students earning each of six possible course letter grades, along with the corresponding totals for passing and failing grades, was plotted for ground and online sections overall.
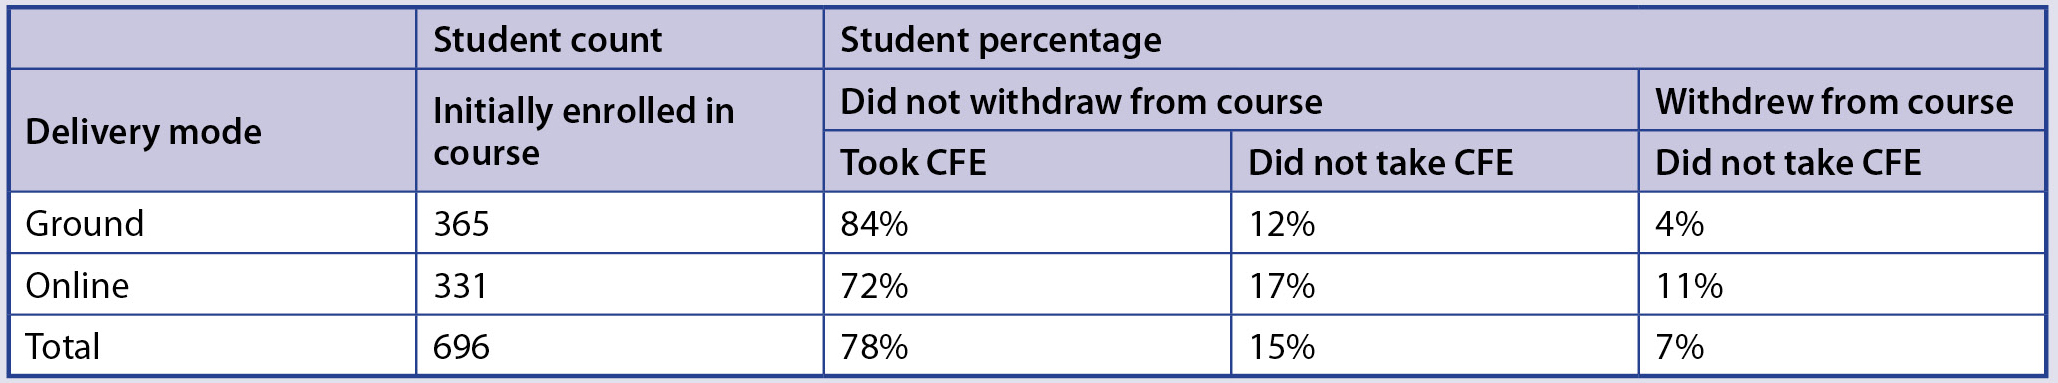
Summary of CFE student participation and course withdrawal in ground and online sections.
Conclusions
Based on data from our study variables (delivery mode, semester, CFE score, gender, age group, and course letter grade), we established through a multivariate cluster analysis the existence of dissimilarity between the two course delivery modes of our Biological Science I course. In all five semesters under study, CFE score averages were higher for ground students than for online students; this was true regardless of gender and age group. The difference was statistically significant (p < .05) in most cases and overall.
Notably, ground and online sections had distinct demographic compositions; while both had a larger proportion of female than male students, most of the students in ground sections were college age, whereas in online sections the majority were older than 24 years old. This distinction is important when embarking on studies aimed at comparing student learning across delivery modes, especially given that our analyses indicate male students outperform their female counterparts and younger students (high school age) outperform older ones. It is critical to note that our high school students participated in a dual-enrollment program requiring a minimum GPA of 3.0, whereas an open enrollment policy applied to all other students.
While high school and post–college-age students in ground sections had the same CFE average, the former clearly outperformed the latter in online sections. It is conceivable that this was at least in part due to the fact that younger students are digital natives (Lambert et al., 2014), but it is potentially also due to the typical challenges faced by adult online learners, such as management of responsibilities at home while studying without the support of a regularly scheduled classroom learning opportunity. Based on a literature review, Kara et al. (2019) concluded that while adult learners may benefit from the flexibility offered by distance education programs, they also face a wide variety of internal, external, and program-related challenges that vary depending on gender, age, knowledge, and skills. Also based on a literature review, Lambert et al. (2014) suggested there is a need for instructors to consider the influence of technology when implementing andragogy in order to meet the unique needs of adult learners.
College-age students had the poorest CFE performance out of the three age groups, both in ground and online sections. We speculate that this could be related to the fact that these young adults are typically adjusting to the new realities of independent living, including the need to find self-motivation and develop self-discipline with reduced parental supervision. Based on a survey of 800 university students, Kriegbaum et al. (2016) demonstrated that lower levels of child-parent shared agency lead to decreased student motivation and academic achievement.
The superior performance of students in ground sections was also reflected in their course letter grades and attrition rates. We found that 78% of ground students earned a passing grade, compared to 68% of online students. In addition, the course withdrawal rate in online sections was almost three times higher than in ground sections, which is not atypical. For example, Garman and Good (2012) found a higher attrition rate in online sections of a college biology course than in ground sections (22% versus 16%, respectively). While the reasons for student withdrawal vary, in a study involving 24,000 university enrollments, Wheland et al. (2012) reported that the most common reason cited by students for withdrawing from a course was the fact they were at risk of failing the course. Assuming our students withdrew due to poor performance early in the course, the difference in CFE average between ground and online sections could have been even more pronounced had the students not withdrawn and had taken the CFE.
Our study points to the need to improve student success in online courses, but it also underscores the fact that making comparisons across delivery modes is a complex task. We found that age and gender differences may have contributed in part to our results, but ground and online student populations may also differ in additional sociodemographic characteristics that could potentially impact student learning.
One beneficial outcome of this work is that we are modifying our online biology course by incorporating current best practices for online instruction. Focusing on elements that may help increase student engagement in our online biology course offerings, we are adding innovative discussion board question prompts (Aloni & Harrington, 2018) and implementing some of the award-winning practices identified by Kumar et al. (2019), such as the inclusion of multimedia resources and relevant course materials that connect content to everyday life. As discussed by Khan et al. (2017), student engagement is key for successful instruction and is particularly challenging to achieve in online courses. A recent study by Crain and Ragan (2017) further illustrates the importance of keeping students engaged in online courses; after analyzing several variables, they identified a lower homework completion rate among online students as the major underlying factor behind those students’ inferior performance compared to their ground counterparts.
The original version of our online biology course, which was used throughout the span of our study, essentially consisted of a direct upload of the ground course content into an online delivery platform. This was partly because it was quickly created in response to an emerging and sudden demand for online course offerings at our institution, before professional development opportunities for creating successful online courses were made available to our faculty. Using CFE scores to compare the efficacy between online and ground course delivery modes of a college biology ground course, we found that the difference in student performance was significant enough to warrant the use of evidence-based techniques for the development of online courses. We also suggest that before a program or a college incorporates new trends in higher education on a large-scale basis, a pilot study should be conducted. Importantly, this change requires the implementation of best practices in the pedagogical aspects of the program or course, accurate data collection practices for the pilot study, and the development of well-designed course assessment tools that enable quantitative comparisons.
Peggy Romeo (promeo@fsw.edu) is a professor of biology and the department chair, Frederick Posey (ftposey@fsw.edu) is a professor of biology, and Marcela Trevino (marcela.trevino@fsw.edu) is a professor of biology, nutrition, and chemistry, all in the Science Department at Florida SouthWestern State College in Fort Myers, Florida. Scott Romeo (scottromeo@email.phoenix.edu) is an associate faculty in the College of Business and Information Technology at the University of Phoenix.
Assessment Biology Teacher Preparation Technology Postsecondary