
Science For All
Socially Transformative Teaching
Science Scope—March/April 2022 (Volume 45, Issue 4)
By Laura Blue and Sarah Redick
CONTENT AREA Life Sciences & the Nature of Science
GRADE LEVEL 6–12
BIG IDEA/UNIT Analyzing the interactions and population dynamics of an ecosystem through graphical data and gaining an understanding of science as a human endeavor.
ESSENTIAL PRE-EXISTING KNOWLEDGE Students benefit from a working knowledge of the levels of organization within an ecosystem and graphic analysis skills.
TIME REQUIRED Flexible depending on the selection of lessons as standalone or as a sequence. Each lesson takes approximately one 45-minute class period.
COST No cost
SAFETY Supervise internet use.
According to Calabrese Barton (2003), all schooling should be about building a more just world. Throughout her work, Barton maintains that “youth need opportunities to apply scientific ideas to their lives; to understand how doing science is intimately connected to larger social, cultural, and political issues; and to value the ways in which their own personal and community stories contribute to how, why, and when science is done” (p. 136). We can guide students to consider these issues through three key questions: “Who benefits from scientific knowledge and/or its application in society? Who does not? Who participated in the development of these ideas? Who got credit? Who has access to this knowledge? Who does not?” (Finkel 2018, p. 53). These questions offer a pathway for teachers toward cultivating a sociotransformative approach to teaching science.
The purpose of this article is to guide practitioners in using a framework for teaching science through the lens of social justice with standards delineated by an organization known as Learning for Justice. Learning for Justice (see Online Resources) is a group that provides teachers with tools for addressing racism and social justice. Among the resources offered is a set of 20 social justice anchor standards, broken down into grade-level outcomes, applicable to a variety of educational settings. Their framework is based on four dimensions of social justice: identity, diversity, justice, and action. Science educators can utilize the standards within the domains to design lessons that align with a sociotransformative approach to teaching that reflects Next Generation Science Standards (NGSS Lead States 2013).
The experience shared within this piece is a personal narrative describing a series of lessons to facilitate student understanding of equity, diversity, social justice, and action within the context of teaching and learning science. The following suggests a general method of approach to support teaching that is connected to real-world sociopolitical issues of relevance to students’ lives. Specific examples of how I implemented the framework in my work as a seventh-grade science teacher during a period of e-learning necessitated by the COVID-19 pandemic are shared (see Table 1—Online Resources).
Implementation of the four domains
My journey began in collaboration with a former seventh-grade science teacher and current classmate in the STEM education PhD program at The Ohio State University in March of 2020. Our conversations started as an outgrowth of a diversity and equity course. By coincidence, the governor’s announcement of a statewide school closure to slow the spread of the coronavirus interrupted our first face-to-face meeting to discuss the intersection of Learning for Justice standards and NGSS domains. Consequently, the worldwide COVID-19 outbreak became the backdrop of the social justice lessons I would highlight in the uncharted territory of my online classroom. The experience of teaching the lesson series weighed on my mind long after the school year ended. Local and world events made it clear that ideas we explored in the spring were critical to share with my peers. This led us to present our reflections as part of a district summer science institute in August, where approximately 25 elementary, middle, and high school science teachers attended the session. The overwhelmingly positive and enthusiastic feedback revealed teachers’ communal desire and willingness to use the domains of the framework to support professional learning conversations and student learning. Next, we describe Learning for Justice’s four dimensions of social justice and how they were incorporated into an online seventh-grade science class during the COVID-19 pandemic.
Identity
Identity refers to the characteristics that an individual uses to categorize themselves and others. These characteristics may include gender, ethnicity, race, language, socioeconomic status, religion, and sexual orientation. Identity also extends to a person’s family structure, personality traits, and interests. The decision to first explore identity was made to facilitate a smooth transition to future discussion of graphics in a justice segment of the four-part lesson that would reveal disparities among COVID
infection rates across varying racial and socioeconomic identity groups.
We used an identity map as a tool to explore the multifaceted nature of what makes each of us unique. This was inspired by a resource called Facing History (see Online Resources). Students had the freedom to choose how they wanted to create their identity map. They could use anything from a piece of paper and colored pencils to Google draw, or a concept webbing tool called Bubbl.us (see Online Resources) to generate their own identity maps. The maps took approximately one 45-minute class period for students to finish.
Given the broad, self-explanatory nature of an identity map and the openness of media choices available to students for making them, I provided a model identity map for a notable scientist to support student thinking. In my case, I chose former Ohio Health Director Dr. Acton, because she was a familiar figure in the community throughout the initial days of the pandemic. The map included details she had shared about herself during her daily public health address to the community. For example, Dr. Acton drew parallels between the pandemic and her Jewish faith as she prepared for Seder. She also drew attention to her concern in closing campgrounds because she lived in them during a difficult winter of her childhood. These statements showed students how faith and home life are aspects of identity that impact their interactions with the world. I used a humorous viral video of her superhero status to introduce the activity. Following this I presented a brief summary of her biographical information and how it might be represented on an identity map.
As a part of my introduction, I defined identity as the groups to which one feels they belong. I conveyed to my students that we hold many identities that are in a continual state of flux throughout our lives. My purpose in sharing this information was to illustrate that aspects of my students’ identity today, although a part of them, may not be the most significant aspects of their identity in the future. I also shared how we behave in different ways depending on the identity we are embodying at that particular moment. Finally, I shared that our identity may also be a source of judgment from others. I used an example from a news interview in which Dr. Acton shared how she was judged for being homeless. The Dr. Acton identity map illustrated the intersection of identity, science, and issues of social justice. It showed the role of her personal identity groups in the weight of her decision as a health director regarding concerns over the spread of COVID infection against those of worry for people living in precarious housing situations as she had experienced.
Using Dr. Acton’s identity map as a model, students could then create identity maps for themselves (see Figure 1). They started with their names in the center of the map and connected this to the identity groups to which they felt a sense of belonging. I discovered that students felt most comfortable sharing aspects of their identity that were low-level risk, such as membership on sports teams, clubs, pasttimes, family size or birth order. I invited students to share their identity maps with me if they felt comfortable. Under normal circumstances, outside of the confines of pandemic-forced distance learning, a teacher could invite students to discuss elements of their identity maps that they felt at ease sharing in small groups.
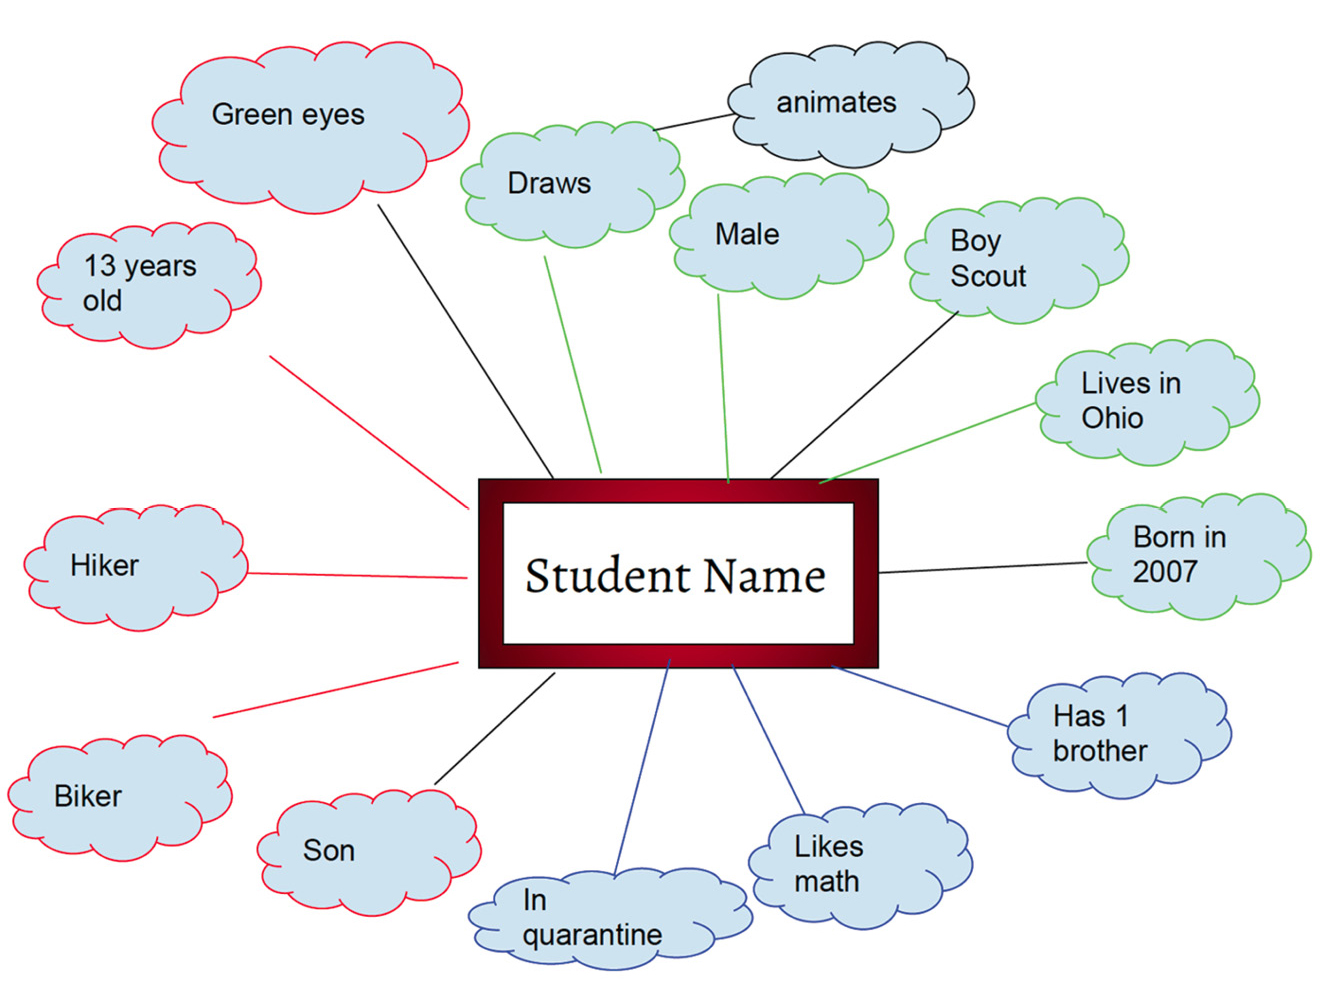
An example student identity map.
This activity proved powerful because it demonstrated ways that diversity exists within individuals as well as between people. As a result, introducing identity maps at the beginning of the school year could be even more impactful. Starting the school year with identity mapping, complemented by reflective discussion, could contribute to creating a classroom culture of respect. Knowing more about students’ identities can not only help students see their similarities across their differences and see their peers in more complex, nuanced ways, but also inform teachers of similarities, differences, and opportunities to connect to students. For example, teachers can include and highlight scientists who share students’ identities, helping all students to imagine themselves as scientists and scientific thinkers and to see themselves as capable and science as compatible with who they are (Aikenhead 2001).
In addition, cultivating knowledge about others while developing an atmosphere of mutual respect is critical in creating a safe, comfortable environment. An inclusive classroom community can then support challenging conversations around the varying societal roles and impacts of science on members of different identity groups.
Diversity
Diversity is the domain that acknowledges that similarities and differences exist among students and their identities. The objective of this domain is to encourage students to approach differences with a sense of curiosity and respect for the history and experiences of others. In connecting diversity to ecology content standards, I targeted the link between the pandemic and the disciplinary core idea “Construct an argument supported by empirical evidence that changes to physical or biological components of an ecosystem affect populations” (MS-LS2-4) and incorporated how social interactions and group behaviors affect the functioning of an ecosystem. These connections allowed us to explore social interactions, as they are a risk factor in the spread of disease.
This real-world challenge provided an opportunity to research the diverse greetings people use around the world, then to design a greeting that met the criteria of being safe and culturally sensitive. Given the online nature of our learning context, students worked individually to research greetings during one class period. They created Venn diagrams to compare and contrast how they greet their family, how they greet their community members, and how they might greet individuals in another country (see Online Resources). The activity provided a window into the lives of each student as they shared the cultural traditions within their own household using the Venn Diagram. For example, one student shared that within the Indian tradition, reverence to grandparents during greetings is shown by touching their feet (see Figure 2).
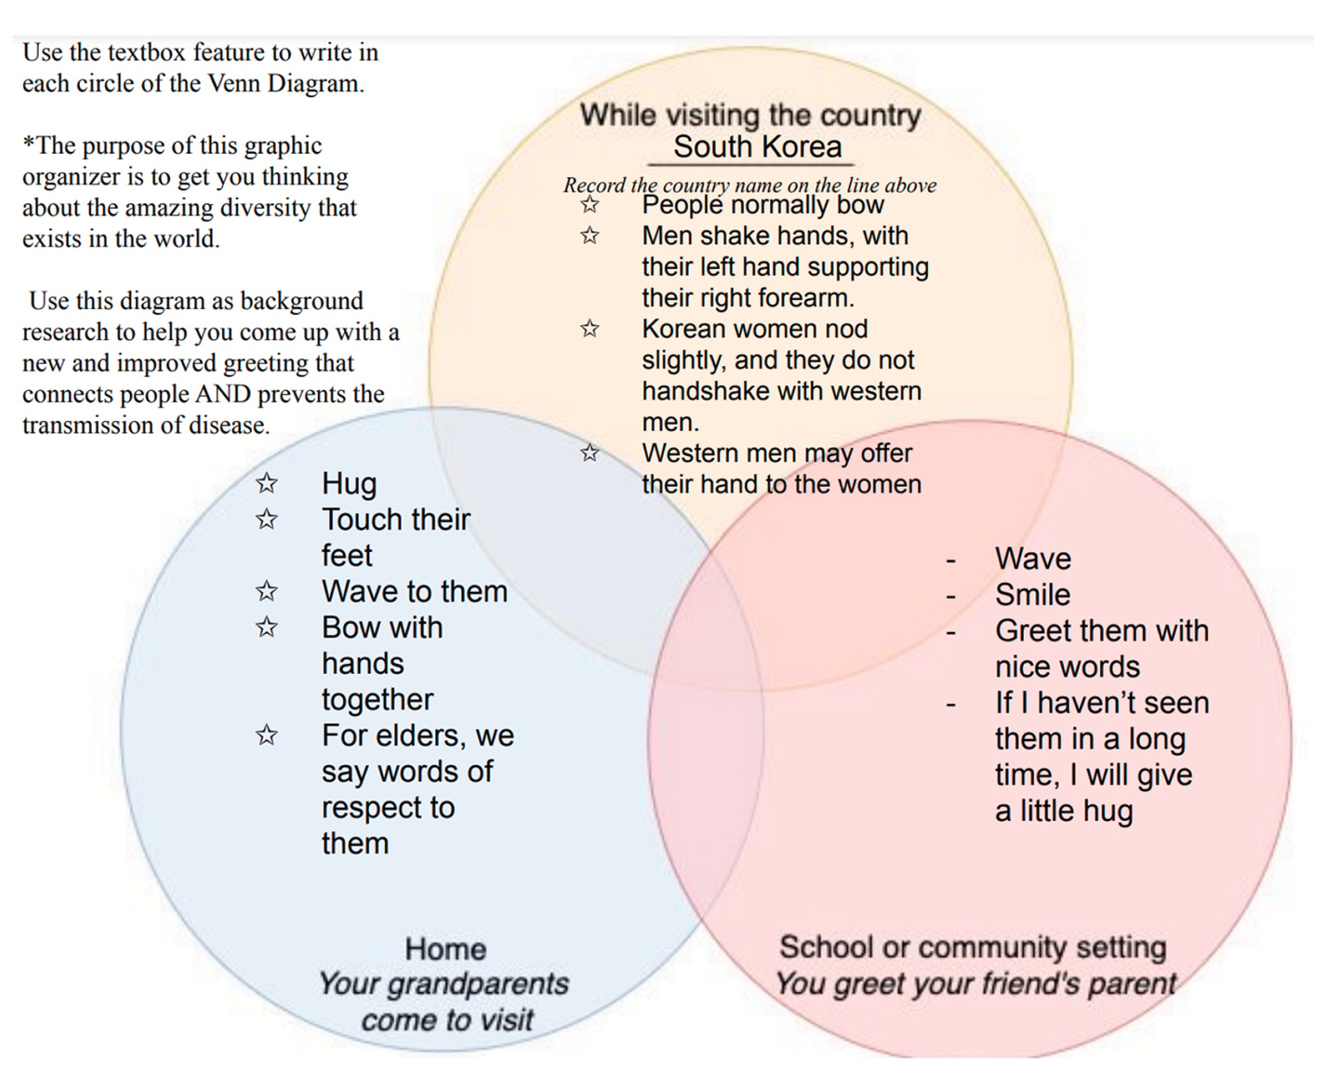
An example Venn Diagram created with Google Draw.
During the following class period, students designed their individual greetings. The instructions further directed students to create a video: “Grab a family member and demonstrate your proposed greeting. Your greeting should make people feel comfortable and connected. It should be creative.” Students then uploaded their videos to a class Flipgrid file. As an optional challenge, students could develop greeting variations showing different levels of formality or respect for elders. One student suggested bowing more deeply to demonstrate a greater degree of respect and adding the gesture of placing their hand over their chest to show the person they are greeting that they are close to their heart despite the physical distance.
Though we watched and discussed the videos individually and asynchronously, the greetings could be demonstrated in a face-to-face setting. Within the online format, student interaction could be increased by requiring students to respond to a specified number of videos with compliments and constructive feedback. Within their videos, students could also be required to explain how their greetings meet the criteria of building feelings of connection without risking exposure to disease.
After looking at the diversity of greetings around the world and in our Flipgird, we next focused our attention on aspects of justice the COVID-19 pandemic revealed
Justice
Learning for Justice promotes explorations of bias, stereotypes, prejudice, discrimination, and privilege. I introduced this component of the activity by saying epidemiologists have to both ask and answer tough questions. I used the See, Think, Wonder strategy to prompt students to critically evaluate pandemic-related data exploring the number of confirmed cases of COVID per 100,000 residents. Utilizing this thinking routine begins by encouraging students to make concrete observations about an image or graphic. Next, they reflect and record their thinking about the observations made. Last, they propose a question they wonder based on their thinking (see Harvard Project Zero in Online Resources). We first looked at a graph that depicts COVID prevalence by racial group. It shows that people who are Pacific islander, Hispanic/Latinx, and Black were experiencing COVID at higher rates than the White reference group (see Figure 3).
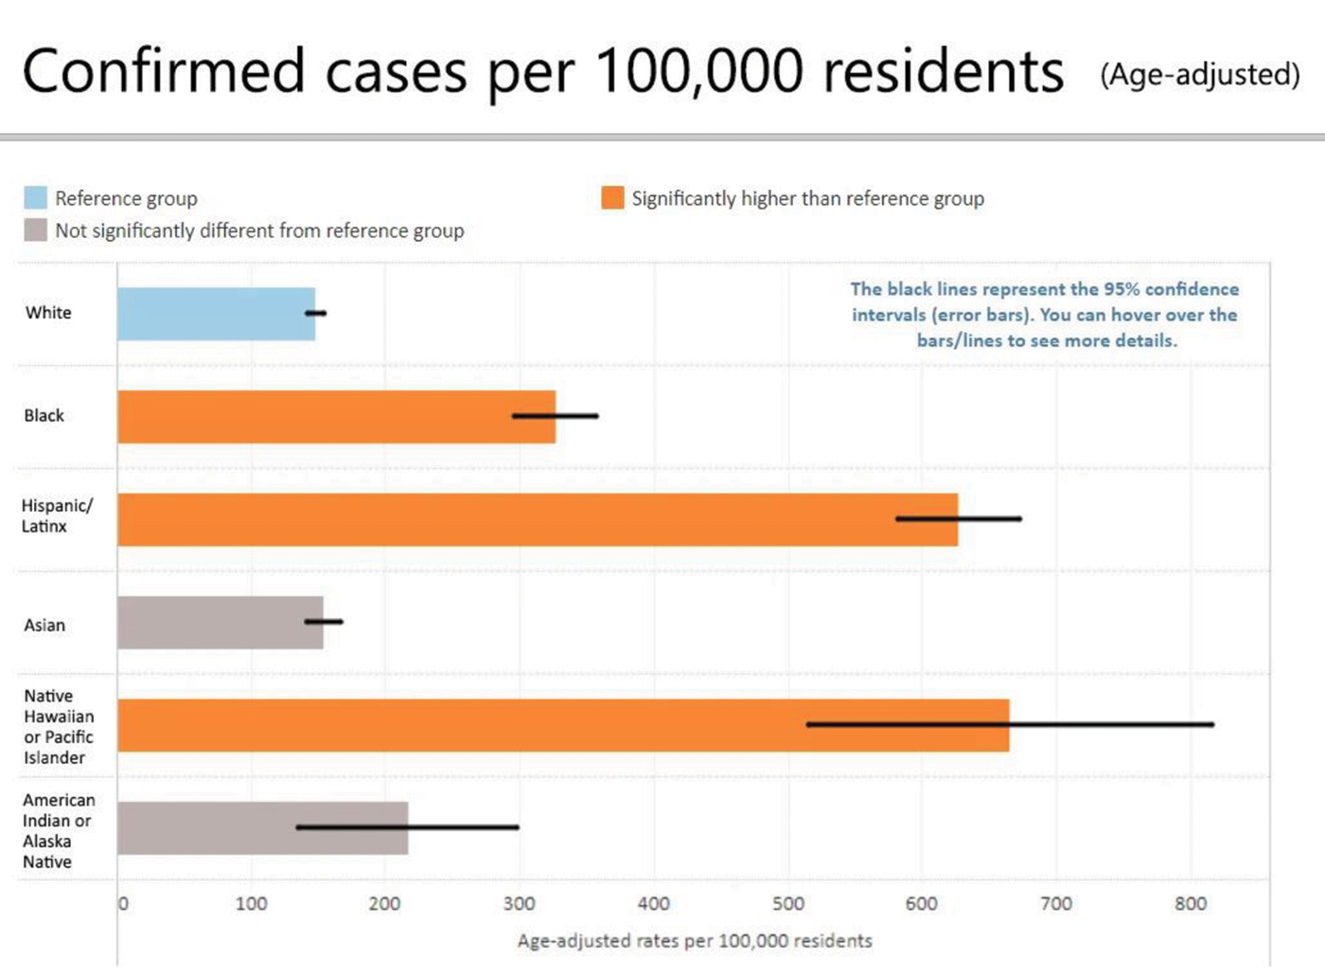
The first graph provided by Public Health Insider (see Online Resources) for students to analyze.
The next two graphics illustrated the rate of coronavirus correlated with socioeconomic and diversity profiles within the city of Seattle, Washington. The graphic in Figure 4 shows that disease prevalence was greater in areas with an increased degree of racial diversity and less economic wealth. The graphic of New York City (see New York Times in Online Resources) was used for comparison given its explosion of cases, which quickly made it the worst outbreak in the nation. Students compared New York City’s data to Seattle’s to determine if the outbreaks were demographically similar, which they were.
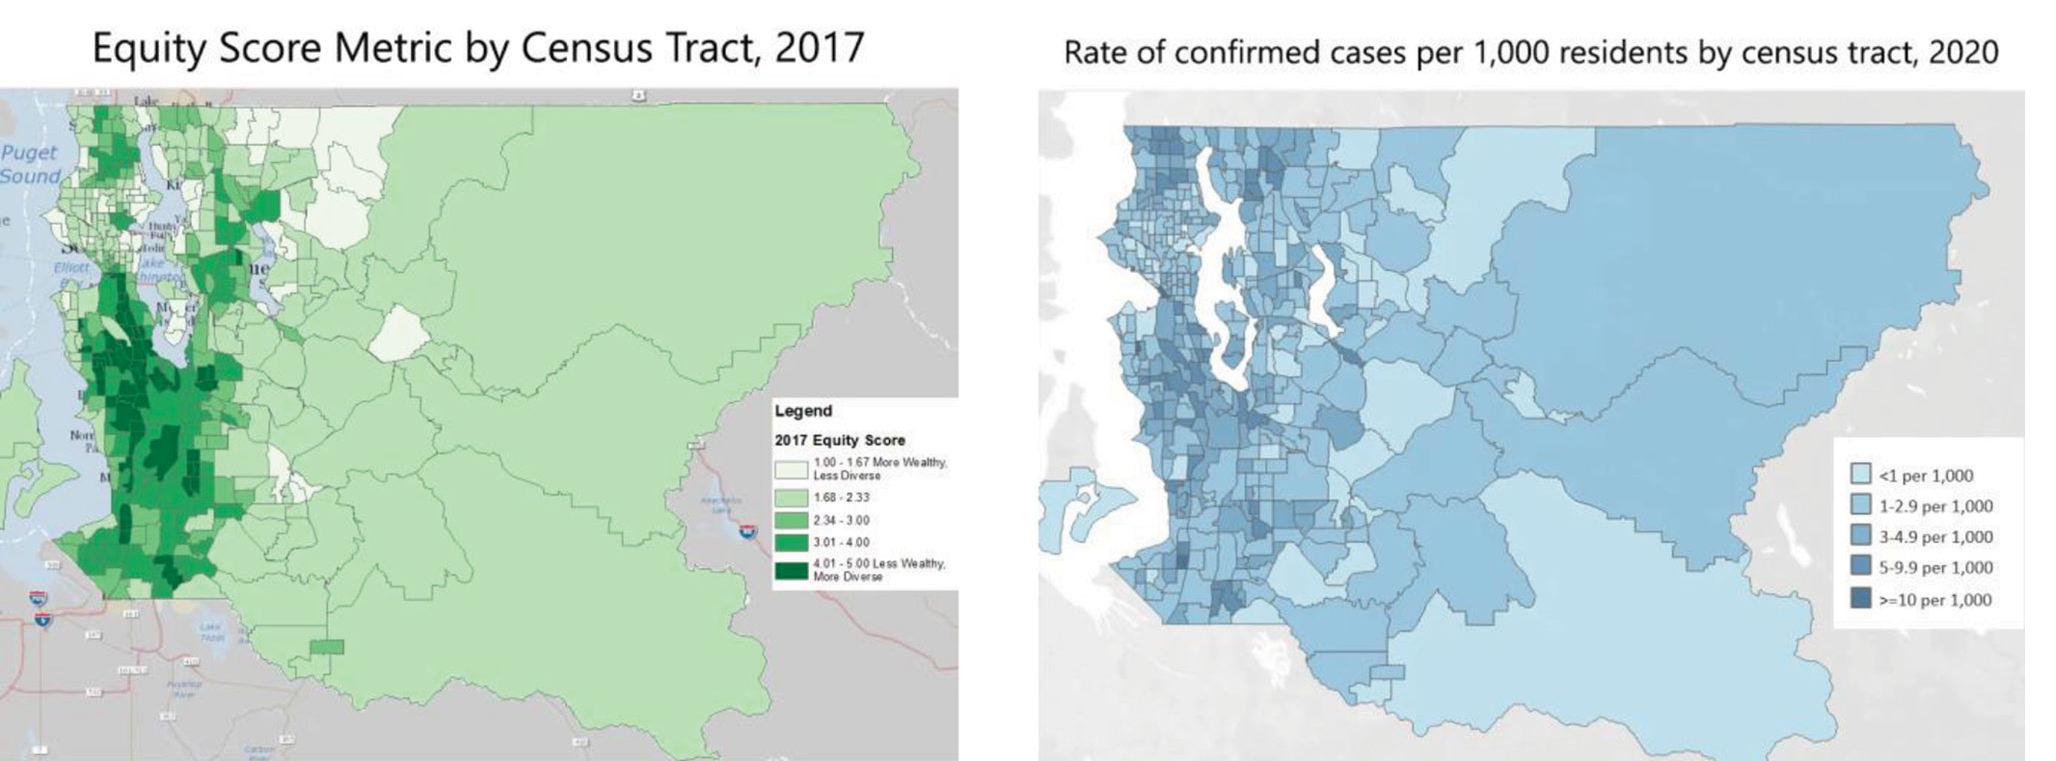
Students analyzed this Public Health Insider graph of Seattle, Washington, for correlations between racial and socioeconomic levels to COVID case numbers.
Students then offered feedback on or hypotheses about this data. Students particularly noted how positions of relative privilege protect some segments of the population from COVID while risking others. One student wrote, “Many people don’t work the kind of jobs that can be done over Zoom. Therefore, they are exposed more and have a greater risk of contracting the virus. This makes me wonder if the companies aren’t giving PPE opportunities to minorities like they are to the wealthy.” Other explanations of the disparity included multigenerational households, cramped living quarters, and differential access to health care. Student responses also revealed stereotypes they held. For example, some students expressed surprise that the relative numbers of COVID cases among U.S. populations of Asian descent were not as high as they anticipated since the COVID-19 outbreak originated in China.
Some students indicated discomfort about seeing the data disaggregated by identity groups within the population. One said, “I dislike why they have the Hispanic and Black graphs. I don’t understand why they include it.” Given our online learning modality I addressed this comment through the discussion board, framing my response by referring back to the work of an epidemiologist. I wrote “Your last point that graphics like these may make people feel uncomfortable is important to acknowledge. But epidemiologists have important work to do in seeing if some groups of people are more at risk of getting the disease than others so that they can make moves to protect them better. The coronavirus has shown some really unfair racial and socioeconomic (money) inequities.” Improved video conferencing platforms since implementation of this lesson offer the potential to better address student responses in breakout rooms that promote small-group discussions to explore student thinking. This is key for engaging in a true back-and-forth dialogue to move student understanding of and desire for social justice.
The justice lesson also gave students a platform to practice the art of argumentative writing by presenting a convincing and logical argument as to why some populations were experiencing higher rates of disease than others. Some students did outside research to support their claim. For example, a student did additional research related to the NYC graphic. They discovered that the Bronx is one of the poorest boroughs in New York City. They reasoned that this would limit the resources available for individuals to protect themselves and their families from the virus. Although the lesson presented here was limited in time and scope, comparing disease frequencies between populations holds the potential for richer and more rigorous exploration into how the field of statistics and probability applies to the field of public health in determining possible risk factors of disease.
Action
The difficulties associated with online learning became the focal point of the action domain, providing students the opportunity to exercise their agency and to address issues of injustice. For the final lesson of the school year, students conducted interviews of their siblings and peers, asking one simple question: What were the challenges of e-learning you encountered this spring? Students had two 45-minute class periods to conduct their research and share their findings in a class discussion board, which allowed for some commiseration between participants. With the improved online learning tools available, breakout rooms could promote a greater degree of conversation around their shared difficulties encountered during e-learning.
Students voiced barriers of e-learning ranging from lack of time-management skills to minimal social interaction with peers and teachers. Following brainstorming, students generated a fix to one of the identified problems related to online learning. The solution generated was shared in a final Flipgrid that was pitched to a district technology coach. In response, the technology coach generated a list of things our district needed to address for the upcoming school year. Our students’ feedback played a valuable role in impacting decisions made by the teachers within the remote academy of our middle school. We responded to student requests for help with organization by starting the year with a Google boot camp to teach students to leverage tools such as Google calendar to set deadlines for themselves. To further support the goal of organization, online teachers aligned their learning management systems to follow the same organizational structure as every other teacher on the digital team. We responded to student calls for increased peer and teacher interaction with the addition of a weekly lunch bunch social interaction option and daily office hours to help students carve out time to get one-on-one help on assignments. This final activity illustrates the importance of engaging youth in solving problems of relevance to the community and empowering them to be agents of change. Their input drove changes within our building and district.
Conclusion
The domains set forth by Learning for Justice provide an entry point for teachers to incorporate a sociotranformative approach to teaching. After presenting this framework during our summer science institute, other teachers in the district felt inspired to try it within their own classrooms. One attendee wrote, “Now that I have a place to start, I will be able to work it into a unit or multiple units. Hopefully, it will eventually be part of my typical practice.” Reactions like this provide evidence that progress with transformational science teaching toward justice is not only possible, it’s practical and purposeful. •
ACKNOWLEDGMENT
We would like to express our deepest gratitude to Dr. Mindi Rhoades of The Ohio State University for expanding our thinking about equitable and inclusive science teaching through her example of interdisciplinary arts–based approaches to teaching, research, and activism.
Online Resources
Bubble.us: Mind mapping online—https://bubbl.us/
Harvard Project Zero—https://pz.harvard.edu/resources/see-think-wonder
Facing History identity map activity—https://bit.ly/3Gid5Og
Learning for Justice—https://www.learningforjustice.org/
New York Times: “What’s Going on in This Graph?”—https://www.nytimes.com/column/whats-going-on-in-this-graph
Public Health Insider—https://bit.ly/3qjGXnW
Laura Blue (bluele75@gmail.com) is a doctoral candidate in the Department of Teaching and Learning at The Ohio State University and a middle school science teacher at Dublin City Schools in Dublin, Ohio. Sarah Redick (redicksarahk@gmail.com) is a doctoral candidate in the Department of Teaching and Learning at The Ohio State University in Columbus and a former middle school science teacher.
Equity Inclusion Life Science NGSS Pedagogy Three-Dimensional Learning Middle School