
feature
Dirty Water? Clean It Up!
In an effort to clean up the Chesapeake Bay, Chesapeake Bay Foundation (CBF) members use hands-on experiential learning opportunities to train teacher ambassadors throughout the bay’s jurisdictions. Teacher ambassadors use the skills they learn to develop a Meaningful Watershed Educational Experience (MWEE) for their students to raise awareness of how communities can care for the local watershed.
The teacher ambassadors at Lower Dauphin High School designed and implemented an outdoor, investigatory opportunity for their students during the 2018–2019 school year. The ninth-grade class (nearly 300 students) gathered data on stream health, explored the watershed and stormwater runoff with tech tools, and designed a student action project using social media to connect their experience with the community.
Project Overview
During two beautiful spring days in May 2019, AP Biology students and science teachers co-led half the ninth-grade class in collecting original data at a local stream to determine overall water quality and impacts of stormwater runoff on the local watershed. Students collected macroinvertebrates, measured stream flow rate using rubber duckies, and tested chemicals present in two different locations along the stream (upstream and downstream). Meanwhile, the other half of the ninth-grade class was at the school working through technology-rich stations and hands-on activities. The technology-rich stations included interactive simulations on stormwater runoff and land use within the watershed. Hands-on activities included students designing a water filter, collaborating with an art teacher to create a product for a community outreach project, exploring solutions to cleaning up polluted water with an English teacher, and touring the school to give it a “report card.” The short-term goals for this experience were twofold:
- Get the entire ninth-grade class outside conducting watershed investigations alongside AP Biology students to introduce them to current issues facing our watershed.
- Have students share what they learned with the community.
The design of the experience incorporated outdoor, hands-on, data-driven investigations, as well as the use of technology tools and cross-curricular collaborations to capture the interest of students. The objective was to promote environmental stewardship among the students and connect the school with the community. An increase in education has been shown to positively affect community behavior toward taking better care of the local watershed, the ultimate long-term goal for this project (Marcum-Dietrich et al. 2018).
How clean is our water?
The Environmental Protection Agency (EPA) has listed the Chesapeake Bay on the “dirty water” list. Urban and suburban stormwater runoff are major contributors to the continued pollution of our local and bay watershed. In order to remove the Bay from the EPA’s “dirty waters” list, the Clean Water Blueprint was developed in 2010 by the Chesapeake Bay Foundation (CBF) to reduce bay pollution, with the goal for the bay to be 100% clean by 2025 (CBF 2020). One component of the plan is to focus on watershed education in all six bay jurisdictions, including Pennsylvania.
Research conducted by the CBF shows that Pennsylvania is lacking in environmental educational experiences, especially in comparison to other states in the watershed (CBF 2020). As a result, educational team members from the CBF and the National Oceanic Atmospheric Administration (NOAA) Chesapeake Bay Office have been collaborating with Pennsylvania educators through an experiential professional development program “Bay Watershed Educational Training” (B-WET), which provides hands-on training to assist educators in developing “Meaningful Watershed Educational Experiences” (MWEEs) for their classroom and builds lifelong CBF ambassadors. MWEEs are learner-centered opportunities for students to investigate local environmental issues culminating in a student action project with the goal to promote conservation, community engagement, civic duty and/or changes in more sustainable everyday choices (see Online Connections; CBF MWEE 2020).
Sarah Goodman, alongside fellow ninth-grade science teachers Rebecca Cassel and Darby Fischl, enrolled in the Full STEAM Ahead: Understanding B-WET and Crafting Meaningful Watershed Educational Experiences course in August 2018. This NOAA grant–funded course took them on engaging field trips: the Ned Smith Center for Nature and Art to conduct biological stream studies; Future View Farms to explore Best Management Practices; Gifford Pinchot State Park to map streams and test water quality; and Capital Region Water Advanced Sewage Treatment Center, Capital Region Drinking Water Facility, and Dehart Dam to investigate the positive impacts of sewage treatment and how to ensure water is clean. This summer adventure prepared them for developing their own MWEE: “Taking Care of our Watershed.”
The MWEE development process
The science teachers completed an inquiry investigation to evaluate environmental education apps, websites, and curricula for potential inclusion in the MWEE. The objective was to find current, technology-rich resources to create a MWEE that integrated the following elements: an environmental action project, scientific inquiry, solving real-world problems, and direct experience with the outdoors. Each of these components has been previously demonstrated to have positive learning outcomes and increase environmentally responsible behavior in student participants (Zint, Kraemer, and Kolenic 2013). The investigation revealed several valuable resources including the WikiWatershed App, the Stormwater Guide Website, and the Department of Conservation and Natural Resources (DCNR) Watershed Education curriculum (see Online Connections), which were then incorporated in the MWEE. Additional resources that received a high rating in the evaluation but were either not appropriate for the local environment or level of student include: Marine Debris Tracker, Project Noah, and Teach the Earth (see Online Connections).
Taking care of our watershed MWEE stations
Shepardson and colleagues (2007) mention watershed education as a valuable context to provide the opportunity for interdisciplinary teaching, with applications in math, writing, and artistic skills. For this reason, science teachers of all subjects, as well as English and art teachers, participated in leading the MWEE to encourage cross-curricular collaboration. To get the entire ninth-grade class outside, the field day was split into two days. Half the students went to a local stream to collect data on the physical, biological, and chemical properties of an upstream location and a downstream (pond) location. The other half stayed at the school and rotated between six different cross-curricular and technology-rich stations. The groups switched locations on the second day so everyone had a chance to experience all aspects of the MWEE.
Science teachers in the field worked closely with AP Biology students who were trained to conduct chemical tests to determine water quality (dissolved oxygen, pH, phosphates, nitrates, hardness and chloride), collect macroinvertebrates to measure relative species abundance, and measure physical features of the stream (slope, air temperature, water temperature, stream width, depth, velocity and soil infiltration rate) using DCNR’s Watershed Education Curriculum (see Online Connections). Chemical kits were properly stored in individual containers and a waste chemical storage bin was used to appropriately dispose of chemicals back at school. Teachers visited the stream watershed prior to the field day in order to identify appropriate areas on the stream to test and to evaluate safety for the students in the water. The areas chosen to investigate had low berms, minimal trees/brush along the edge, and were only a few feet from the park’s walking path.
The AP students recorded data collected by all 12 ninth-grade groups over the course of two days using the Water Quality App from the WikiWatershed Web Tools (see Figures 1 and 2). The tool allowed the students to save and convert the data into a .csv file to collate afterward.
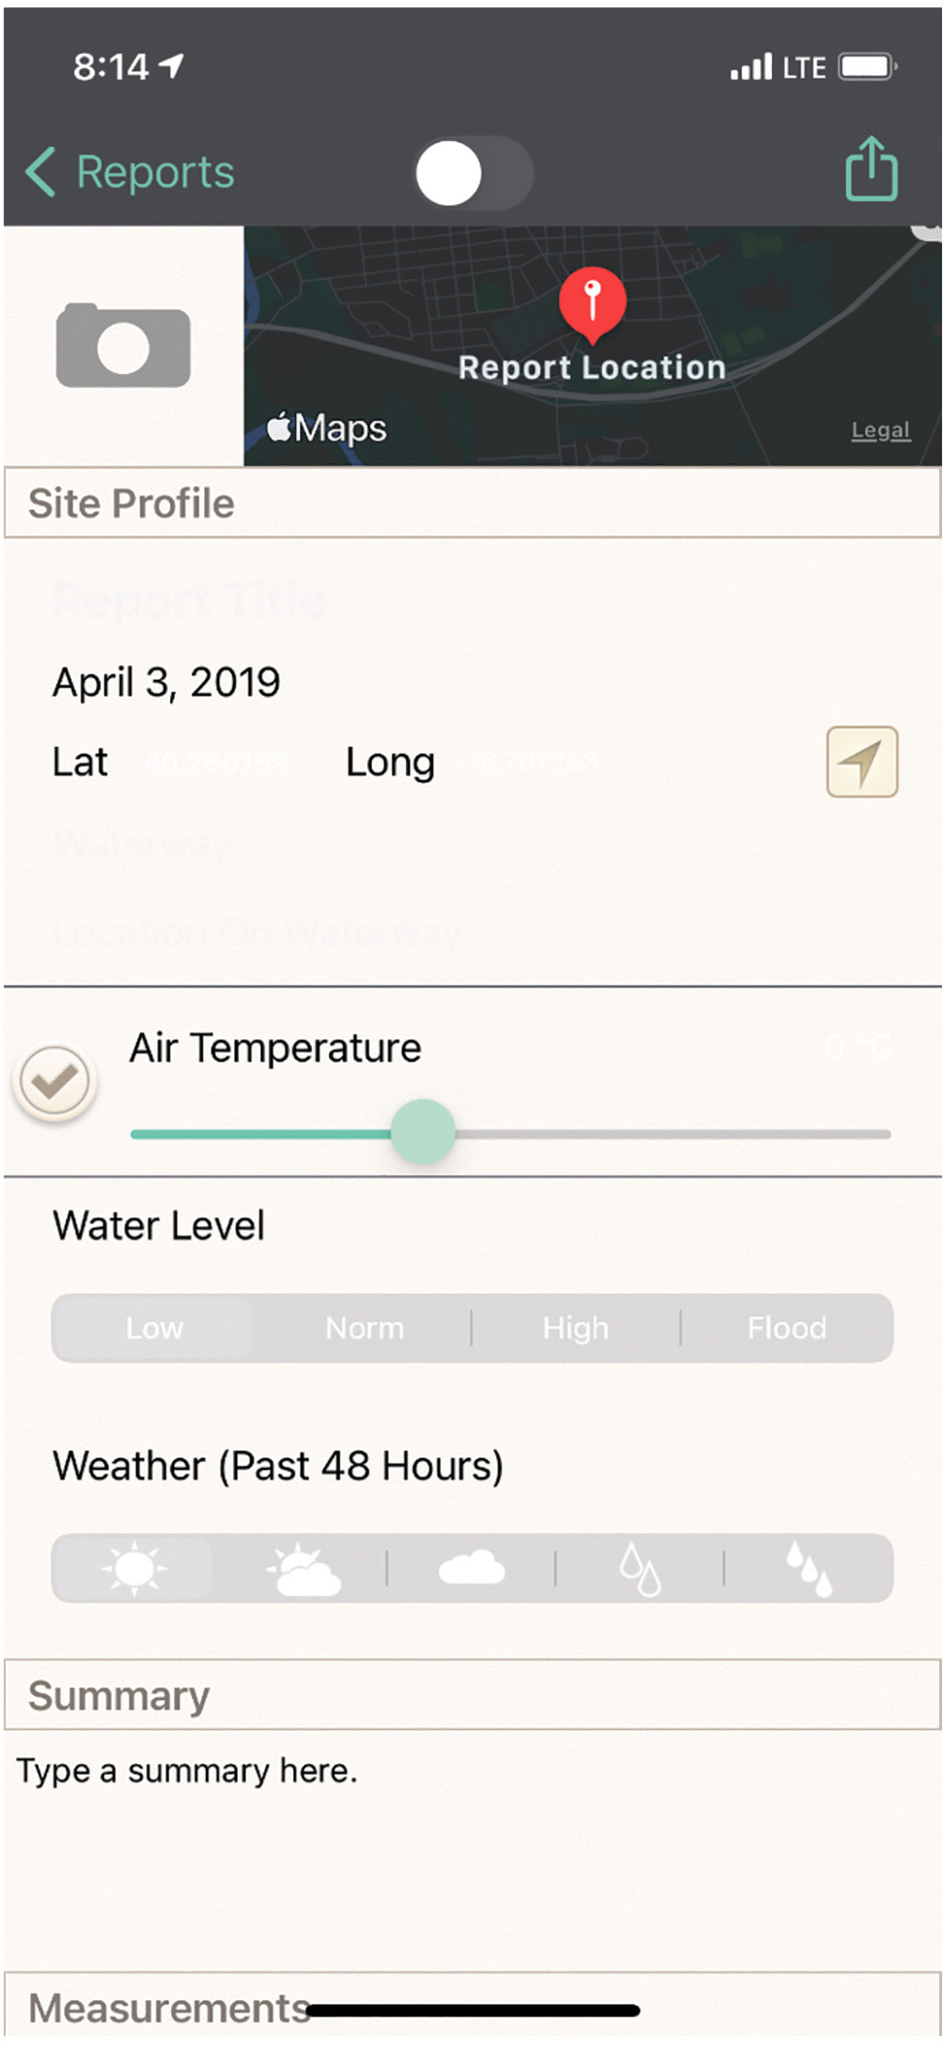
Snapshot of blank report for water quality app.
Data collected about the stream, including specific location and physical, chemical and biological test results can be inputted into a report on the app.
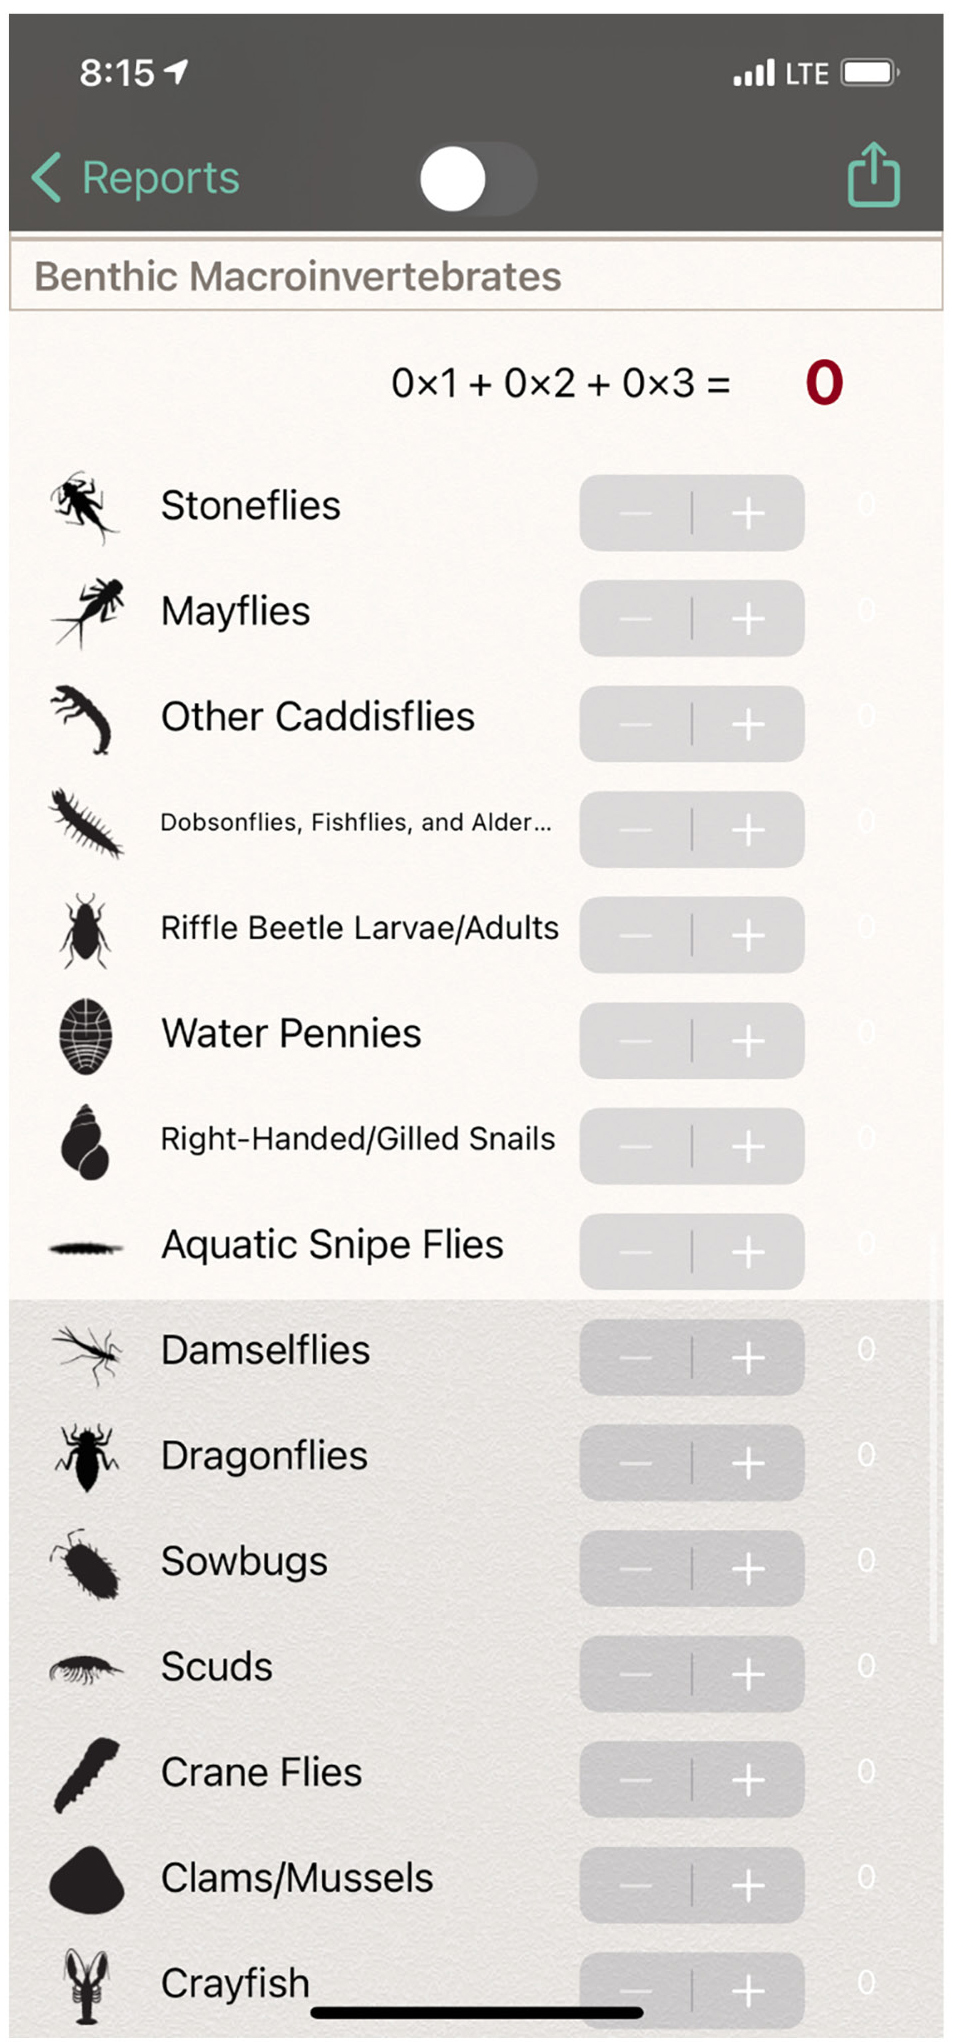
Snapshot of macroinvertebrate table on water quality app.
The Water Quality app tabulates the “health score” of the stream based on the number of macroinvertebrates collected and their sensitivity to pollution.
Two of the stations used the WikiWatershed App to explore and model the local watershed land use and conduct a stormwater runoff simulation (see Online Connections for links to teacher guides and student activities). This tool allows users to explore specific locations (such as the local watershed or school district) to investigate land use, soil type, precipitation, and more (see Figures 3 and 4). Students at the runoff station also investigated their homes (or the school property) using the Stormwater Guide Website (see Online Connections) to identify potential remediation strategies to reduce stormwater runoff. A science teacher and AP student companion led groups of students around the school to complete a schoolyard report card (see CBF Report Card; Online Connections). The report card assessed runoff/erosion, transportation, vegetation, and biodiversity. The walking route around the school was identified and surveyed prior to the study to keep the students safe as well as highlight areas of strengths/weaknesses on the property.
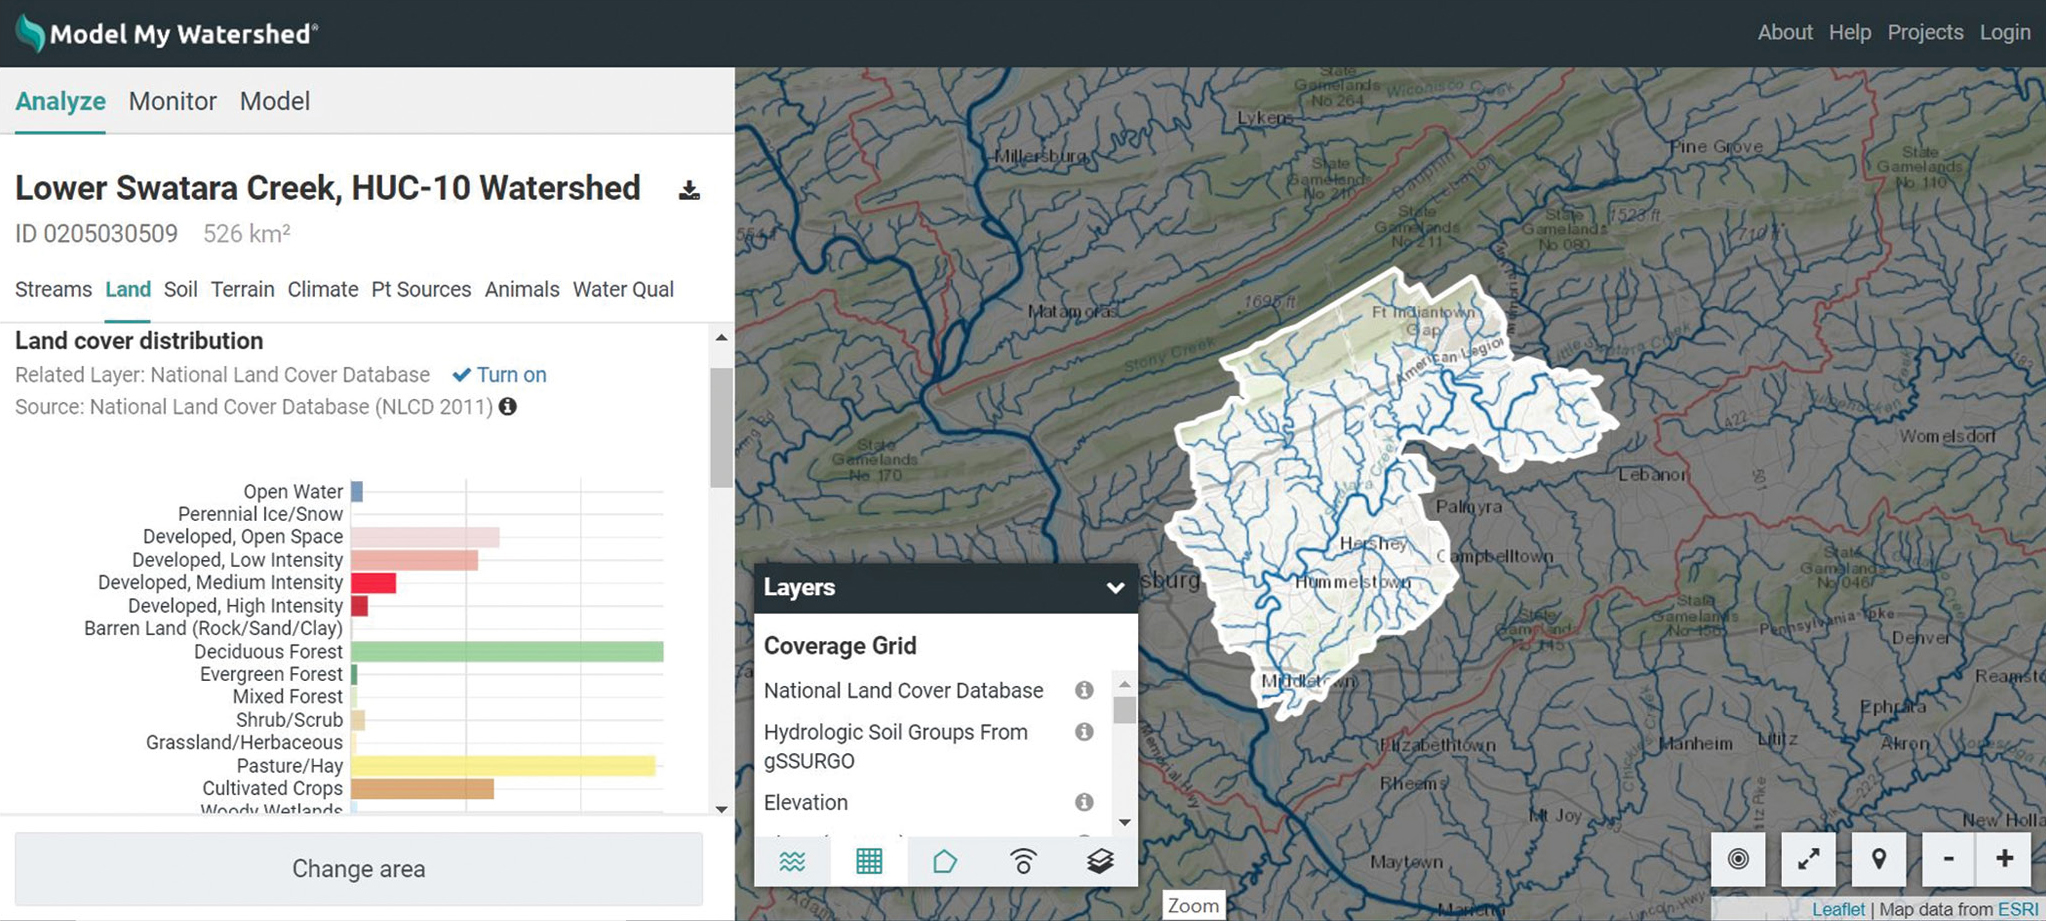
Snapshot of WikiWatershed app Model My Watershed.
The WikiWatershed app allows users to select a specific location and use the tabs to explore land use, soil type, terrain, animals etc.
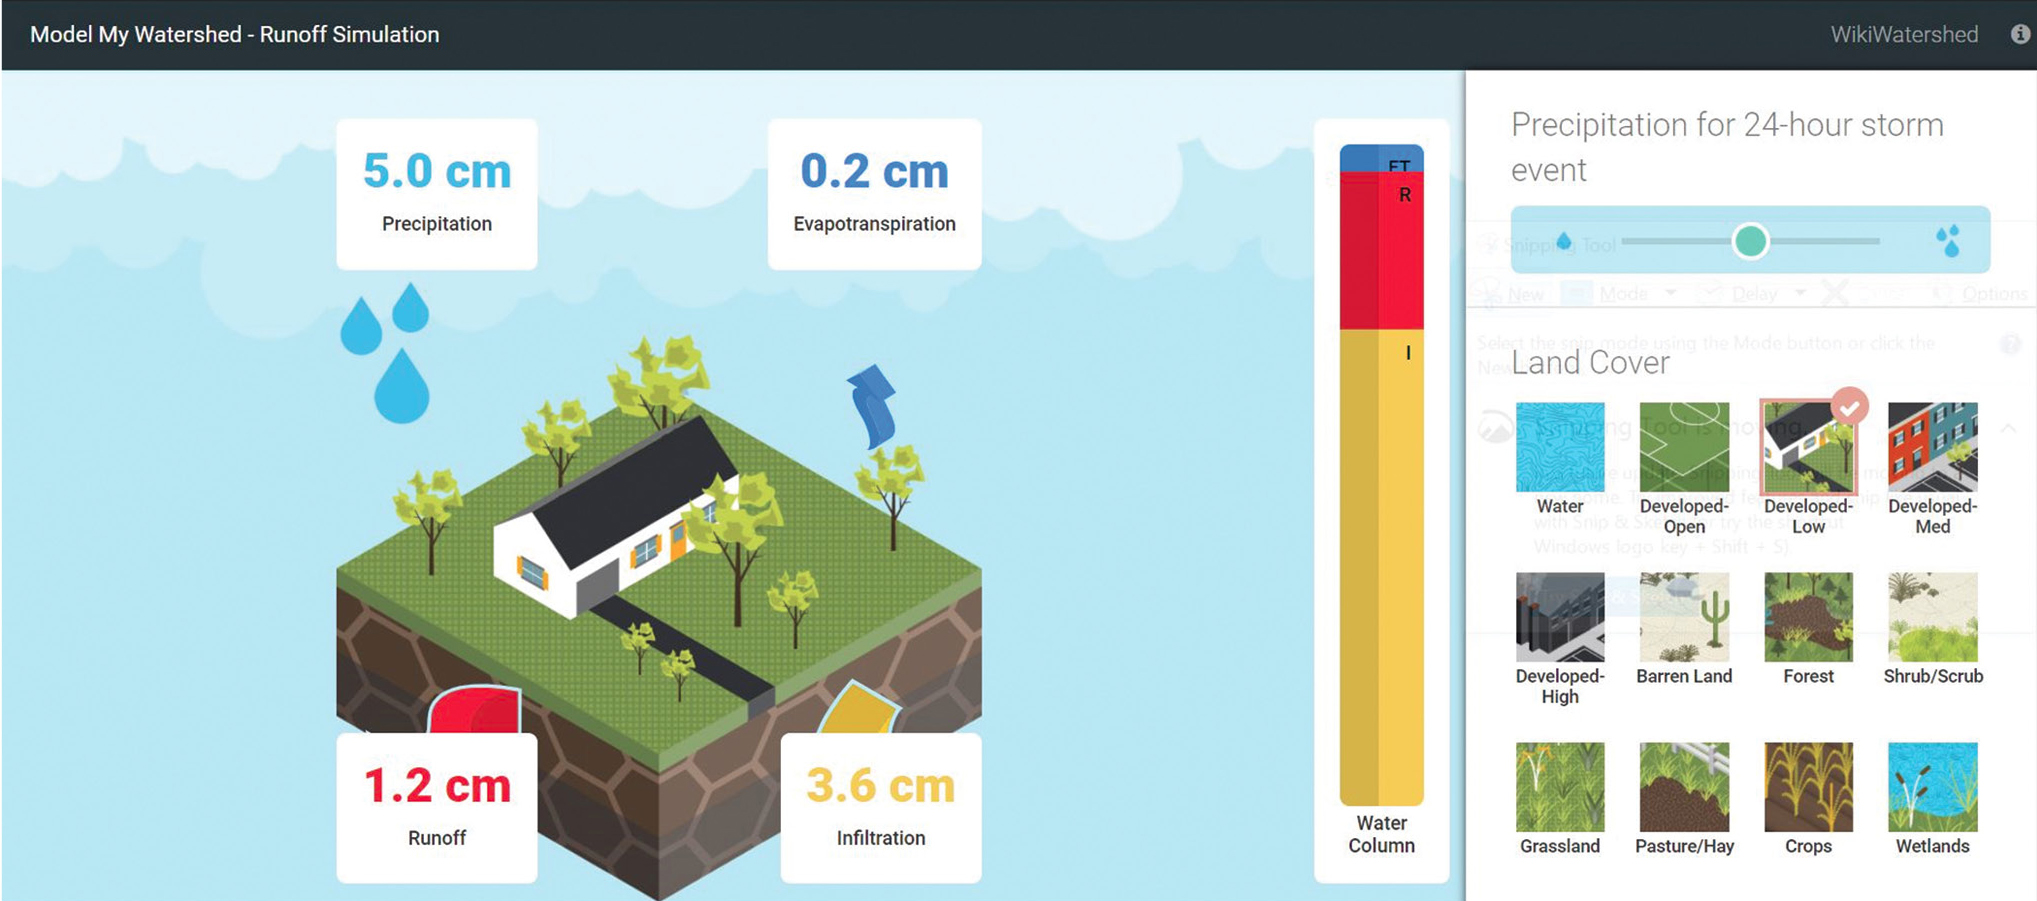
Snapshot of WikiWatershed runoff simulation.
This app allows users to see the difference in stormwater runoff based on type of land cover and amount of precipitation.
A hands-on station investigated how to make contaminated water “drinkable” with a contest to design and create the best water filter using Science News in High School’s Martian Water Challenge (see Online Connections). Students worked with an English teacher to investigate different issues facing the environment. At this station, the students matched these issues to definitions and appropriate actions to address the issue. Finally, the art teacher led a station where the students learned about ways to help keep our water clean (see Taking Care of Our Watershed Google Site; and Figure 5) and then designed a beverage coaster advertising the importance of clean water. The top four coaster projects were then used in a community-wide social media campaign to determine which coaster would be printed and distributed at a local restaurant (see Figure 6). The top coasters were selected based on design, appeal, and topic relevance.
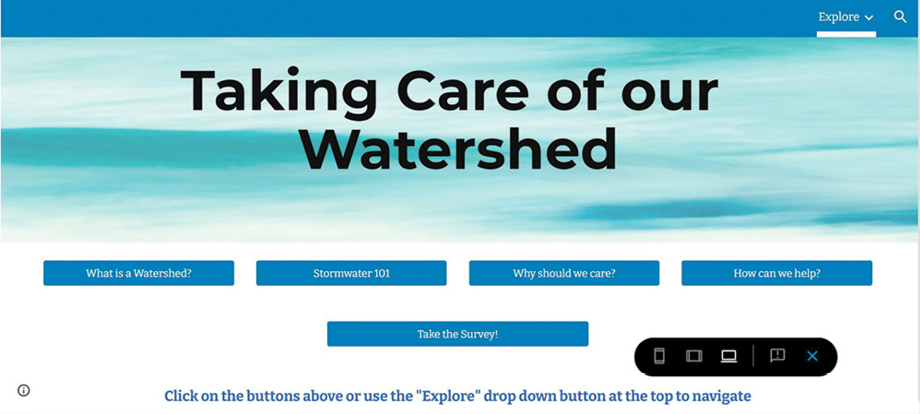
Snapshot of Taking Care of Our Watershed Google site.
A Google site was created for student and community use during the MWEE and social media campaign.
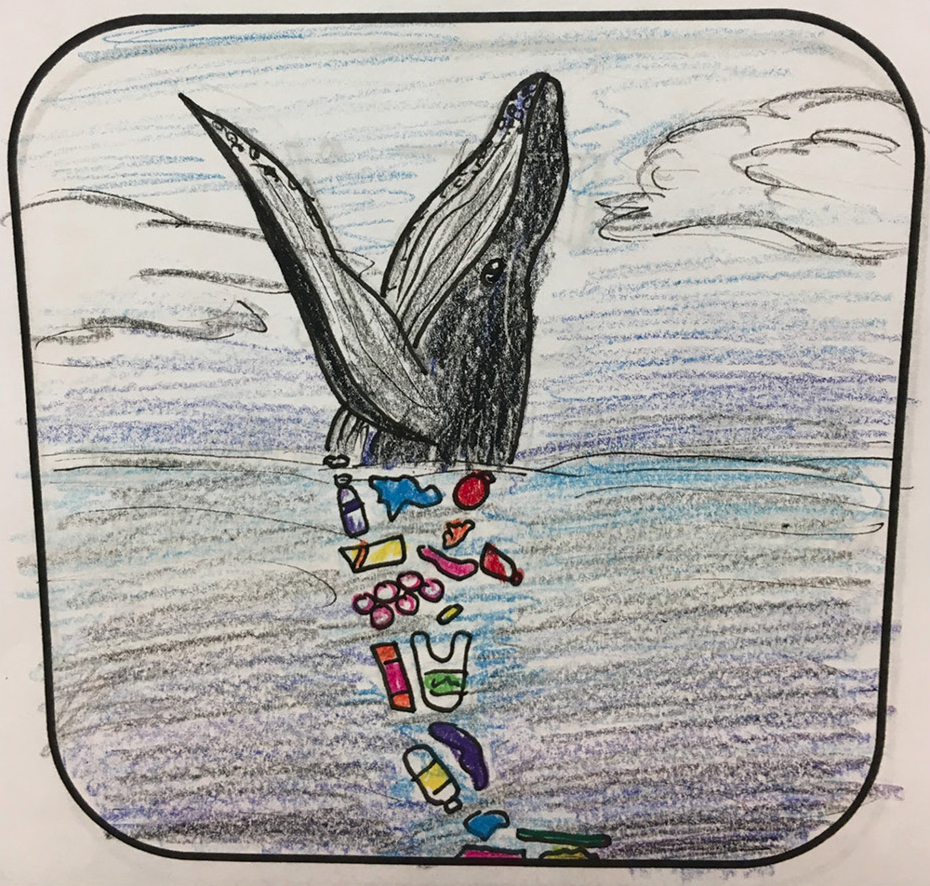
Winning coaster designed by a ninth- grade student.
As part of the action project, coasters were manufactured using the NOAA grant and made available to patrons at a local restaurant in the community.
Student groups were primarily organized by homeroom (alphabetized) to create a heterogeneous mixture of academic levels. A nurse was present for one of the field study days for students who had additional health concerns. The walking path connecting each of the field study stations gave students wheelchair access. Several students with additional special needs had the support of an aide during the field study as well as additional support resources (i.e., microphone for hearing disabilities).
What does the data tell us about stream health?
AP Biology students used the data collected on stream health to complete the Data Driven Stream Health Lab (see Supplemental Materials). The goal of this lab was to compare the upstream location and the downstream location (pond) using a student’s t-test to identify if there was a statistically significant difference between these locations based on their biological, chemical, and physical evidence. To learn how to conduct a student’s t-test using Excel, the AP students completed the HHMI Biointeractive Spreadsheet Tutorial #4: t-test (see Online Connections). The students worked together as a class and were responsible for their specific group’s data parameter (physical, chemical, or biological). Each student completed an informal lab report including a null and alternative hypothesis and generated a conclusion on the overall health of the two locations (see Data Driven Stream Health Lab in Supplemental Materials).
The lab report was assessed using a course-specific informal lab rubric (see Informal Lab Rubric in the Supplemental Materials) implemented at the beginning of the year and used in various labs throughout the course. The students were assessed on their ability to identify an appropriate null and alternative hypothesis and complete statistical analysis of the data (using mean, standard deviation, standard error, and a student’s t-test). Their lab conclusion was assessed based on their ability to answer the investigatory question, support or reject their hypothesis (with evidence from the data), infer patterns of environmental impacts, and provide suggestions for improvement of the stream and pond area. This data analysis was summarized and shared with the ninth-grade students who then were assessed on a written “report card” for the overall health of the stream using the data they collected. The ninth-grade student report card assessment was differentiated by level by the ninth-grade teachers. The honors students were assessed individually on their writing, which required a claim, evidence (citing specific data), and reasoning (CER). The lower academic-level students worked as a class to put together their report card.
Students found downloading the data from the Water Quality app on the iPads to be cumbersome. The app would be more appropriate if one “report” included all parameters explored (chemical tests, macros, and physical descriptions). However, since each student group was in charge of only one parameter (biological, chemical, or physical), 12 separate reports needed to be downloaded and manually entered into Google Sheets. Recommendations for the future are to record data directly on Google Sheets to enable more efficient group data analysis.
Community outreach action project
Sarah Goodman created a Google site “Taking Care of Our Watershed” (see Online Connections; Figure 5) to be used by students in the coaster design station and also community members during a social media campaign shared on Facebook, Instagram, and Twitter. The campaign surveyed 168 members of the community who voted on their favorite coaster design, checked a list of actions they would be willing to implement in the future to reduce stormwater runoff, and identified the definition of a watershed. The winning design (see Figure 6) was printed and made available in June 2019 to patrons of a local restaurant. This enabled students to share their experience with the community and also promote stream health.
Conclusion
Overall, the 2019 MWEE Taking Care of Our Watershed was a success. Based on the student’s research findings, we developed a plan for the next MWEE to include an investigation of land use impacts on water and soil quality with a restoration action project. The action project called for planting native plants near high stormwater flow areas on the Lower Dauphin School District campus. This collaboration was scheduled to take place alongside a local conservancy group, Manada Conservancy (see Online Connections), which volunteered to design and recommend the appropriate plants for each location. The conservancy also planned to provide the plants for purchase during their annual Native Plant sale in May. However, because COVID closed the school district from March 2020 to the end of the year, the 2020 MWEE – Impacts of Land Use was unable to be completed; hopefully the activity can be completed in the future.
In addition, teacher participants completed a reflection survey to provide suggestions on improvements for our future field studies. Although most of the ninth-grade students previewed the chemical, physical, and biological testing prior to the field experience, the teachers stationed in the field felt the students could have had more background knowledge on what the tests were looking at and the science behind them. Overall, the teachers found the attention to detail and organization by the science teachers leading the MWEE to be critical. The information and resources necessary for their station were disseminated at least a month prior and an after-school meeting was held for the teachers to go over the MWEE plan. To better deal with discipline issues and bathroom trips, an additional adult present for each of the six groups (ideally parent/guardian volunteers) is recommended.
The MWEE was also a success in terms of community outreach on the issue of watershed conservation. The results from our survey indicated 88% of the social media campaign participants could correctly identify the definition of a watershed after viewing the Google site. In terms of helping to keep our watershed clean, approximately 77% of the participants would be willing to pick up trash and 76% would be willing to reduce single-use plastic consumption. This was a positive start to making a difference in the community. Overall, the experience provided the students an opportunity to get their hands dirty while gathering practical data outside and explore ways to address a real-world conservation issue at the local community level, in an effort to clean up our watershed. I’m hopeful the program’s outreach will make a difference in how we take care of our watershed in the future!
Acknowledgments
I would like to thank Rebecca Cassel and Darby Fischl, who worked tirelessly beside me to design and implement this MWEE. The impact this project had on the school and community would not have been possible without their hard work, dedication, and enthusiasm. I’m grateful for the team of teachers who ran the stations in the MWEE for their help in planning and facilitating this experience. I would also like to thank The Chesapeake Bay Foundation (especially Tarrea Potter) for providing the education, support, and assistance required to facilitate the MWEE. Thank you to the National Oceanic and Atmospheric Administration (NOAA) Chesapeake Bay Office for providing the 2018 B-WET funding (NA18NMF4570319: Systemic Solutions: Advancing Environmental Literacy and Supporting Clean Water Initiatives in the Susquehanna Watershed). The grant money was used for the production of our action project (the coasters) and the summer B-WET educational experience. Finally, my personal conservation journey and the inspiration to write this article can be attributed to Miami University of Ohio’s Project Dragonfly, where community, conservation and voice are on the forefront of inspiring the development of environmental stewards around the world. ■
Online Connections
Chesapeake Bay Foundation (CBF): https://www.cbf.org/
MWEE: https://www.cbf.org/join-us/education-program/mwee/
CBF School Yard Report Card: https://www.cbf.org/document-library/education-resources/schoolyard_reportcard28aa.pdf
Connecting to the Next Generation Science Standards: https://bit.ly/3lLgEnV
Data Driven Stream Health Lab Handout (Supplemental Materials): https://bit.ly/3lLwS0l
DCNR Watershed Education Curriculum: http://www.watersheded.dcnr.state.pa.us/overview/index.html
HHMI Biointeractive Spreadsheet #4 t-test: https://www.biointeractive.org/classroom-resources/spreadsheet-tutorial-4-ttest
Informal Lab Report (Supplemental Materials): https://bit.ly/3lLwS0l
Manada Conservancy: www.manada.org
Marine Debris Tracker: http://marinedebris.engr.uga.edu/
Project Noah: https://www.projectnoah.org/
Science News Martian Water Challenge: https://www.sciencenews.org/snhs/guide/component/teacher-guide-martian-water-challenge
Stormwater Guide: https://www.stormwaterguide.org/
Stroud Water Research Center: WikiWatershed Toolkit https://wikiwatershed.org/
Curriculum Guides: https://wikiwatershed.org/curricula/
Taking Care of our Watershed Google Site: https://sites.google.com/miamioh.edu/takingcareofourwatershed/explore
Teach the Earth: https://serc.carleton.edu/teachearth/index.html
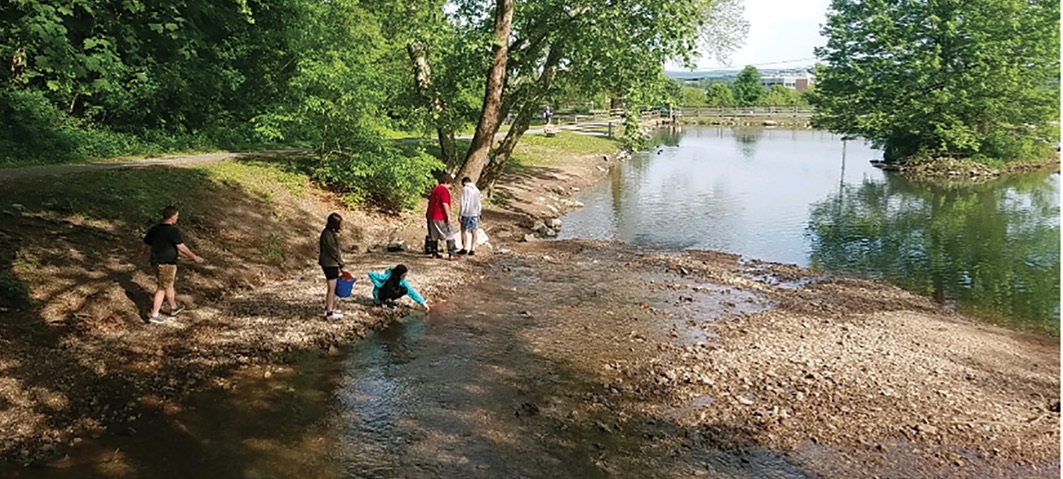
Students measure physical parameters of the stream.
Sarah Goodman (sgoodman@ldsd.org) is a Biology Teacher at Lower Dauphin High School, Hummelstown, PA.
Computer Science Engineering Environmental Science Life Science Science and Engineering Practices STEM Technology High School