
Start With Phenomena
Making It Bounce
Investigating properties of materials by observing balls
Science and Children—November/December 2020 (Volume 58, Issue 2)
By April Mitchell and Kimberly Lott
Elementary students are experiencing scientific phenomena outside of school every day. As students observe these phenomena, such as a shadow, the motion of a swing, or worms on the sidewalk when it rains, they feel curious and start to ask questions. These questions can naturally lead to investigations in the classroom in which students gather evidence to support an explanation. By bringing everyday phenomena into the classroom, teachers can more readily engage students in authentic scientific inquiry.
Current science education reform documents such as A Framework for K–12 Science Education advocate for the use of phenomena in science classrooms beginning in the earliest grades (NRC 2012). Furthermore, students are to construct explanations for phenomena based on evidence throughout the K–12 experience. We have found that even young students can gather evidence and construct written explanations for phenomena with guidance from a teacher (McNeil 2017). In doing so, they deepen their understanding of science and the nature of science.
When working with young children, the best phenomena are those that students can directly experience and investigate. Meaningful phenomena can be identified by watching children at play, listening to the conversations they have with peers, and observing the local environment. Questions to consider when choosing a phenomenon include, Can students directly observe or experience the phenomenon? Can students actively explore and investigate the phenomenon? Is the phenomenon meaningful and of interest to students? Will students need to use disciplinary core ideas to explain the phenomenon?
If you have a standard in mind that you are about to teach, you will develop a heightened awareness of the everyday phenomena in your world related to that standard. We have found it helpful to keep an ongoing list of phenomena as we become aware of them. Once we identify a phenomenon that could be a good match, we write a simple explanation for the phenomenon at a level we might expect from a proficient student. We make sure the explanation requires the use of disciplinary core ideas featured in the standard. If it does, then we know the phenomenon is likely worthwhile (Krajcik 2015). Our written explanation can also be used in an iterative backward design process to plan opportunities for students to gather measurable, observable evidence to support the explanation.
Here we describe a 5E learning sequence on properties of materials in which the learning is driven by the phenomenon of a bouncy ball. Second-grade students explore what makes a bouncy ball so bouncy, gathering evidence and using scientific reasoning to develop a written explanation for this everyday phenomenon. The lessons are aligned to Next Generation Science Standards (NGSS) 2-PS1-1, Plan and conduct an investigation to describe and classify different kinds of materials by their observable properties, and 2-PS1-2, Analyze data obtained from testing different materials to determine which materials have the properties that are best suited for an intended purpose (NGSS Lead States 2013). We conclude the article with a discussion of the value of crosscutting concepts and how we use them to support student sensemaking.
Engage (Days 1–2)
During recess, I noticed a group of students playing with a bouncy ball on the playground. The children were trying to make the ball bounce as high as they could. They chased after it, trying to catch the ball as it bounced away from them. The wonder and the laughter of the children made me smile. That’s a phenomenon, I thought. I decided to use the bouncy ball to drive our upcoming lessons on the properties of materials.
I introduced the phenomenon by bouncing a ball on the desks of the classroom. The ball bounced so high it touched the ceiling. After observing the phenomenon, I asked students to reflect on what they were curious about. What questions did they have about the bouncy ball? Students recorded a question in their science notebook, then shared the question with a partner. The question on everyone’s mind was, “What makes a bouncy ball so bouncy?”
I invited students to consider, “How bouncy is this ball? Is it really the bounciest ball of all? If we wanted to measure “bounciness,” how could we do it?” One student suggested we measure how high the ball bounces. Another student suggested we count the number of bounces (i.e., how many times the ball bounces before it comes to a stop). I then held out the ball to my shoulder and dropped it. We used my body as a measuring stick. The ball bounced back to my shoulder. I dropped the ball again and we counted the number of bounces. The ball bounced 18 times before it stopped! I showed the students a basket full of sports equipment, including basketballs, baseballs, golf balls, tennis balls, and more. I asked, “How could we gather evidence to test the idea that a bouncy ball is the bounciest ball of all?” I suggested we plan an experiment to investigate like scientists.
To support the planning process, I provided a graphic organizer called the Fair Test Organizer (see Resources). Students worked with a partner to choose one thing they would change (different sports balls), one thing they would measure (number of bounces), and three things they would keep the same to make it a fair test. To help students develop their understanding of a fair test, I provided non-examples. I asked, “Would it be a fair test if we bounced one ball on the carpet and another ball on the tile? Would it be a fair test if we dropped one ball from shoulder height and another ball from the top of the stairs?” By giving these non-examples, even my young second-grade students could understand the meaning of planning a fair test. As a class, we decided to go with the counting method of measuring bounciness. The plan was to count how many times each ball bounced before coming to a stop. To make it a fair test, we would bounce the balls on the same surface and drop (not throw) the balls from the same height.
The next day we carried out the investigation we had planned. Students were placed in groups of three based on ability to carry out the investigation. Specific jobs were assigned to each student in the group, including ball dropper, bounce counter, and data recorder. Data was recorded in a provided table (see Lesson Materials in Resources). Back in the classroom, I showed students how to graph and analyze the data they had collected. We now had observable, measurable evidence that a bouncy ball is the bounciest ball of all. Note that if you are experiencing distance learning or do not have access to a variety of sports balls, we have provided a video of a person bouncing different types of sports balls (see Internet Resources). Students can watch the video and count the number of times each ball bounces then record the data in the table.
Explore (Day 3)
Following the investigation, we brainstormed ideas about what causes a bouncy ball to be so bouncy. Students came up with lots of different ideas we could test. For example, the size or weight of a ball could be important, or perhaps a ball must be squishy (not hard). Maybe it’s the air inside a ball that makes it bouncy. One student suggested a ball is bouncy because of the material that it is made of. To help us explore these ideas, I suggested we sort the balls into two groups, high bouncers and low bouncers, then look for patterns. The high bouncing group included the tennis ball, golf ball, soccer ball, basketball, and of course the bouncy ball. The low bouncing group included the baseball, ping-pong ball, steel ball, and marble. To find a pattern, we looked for similarities and differences between the balls in the two groups.
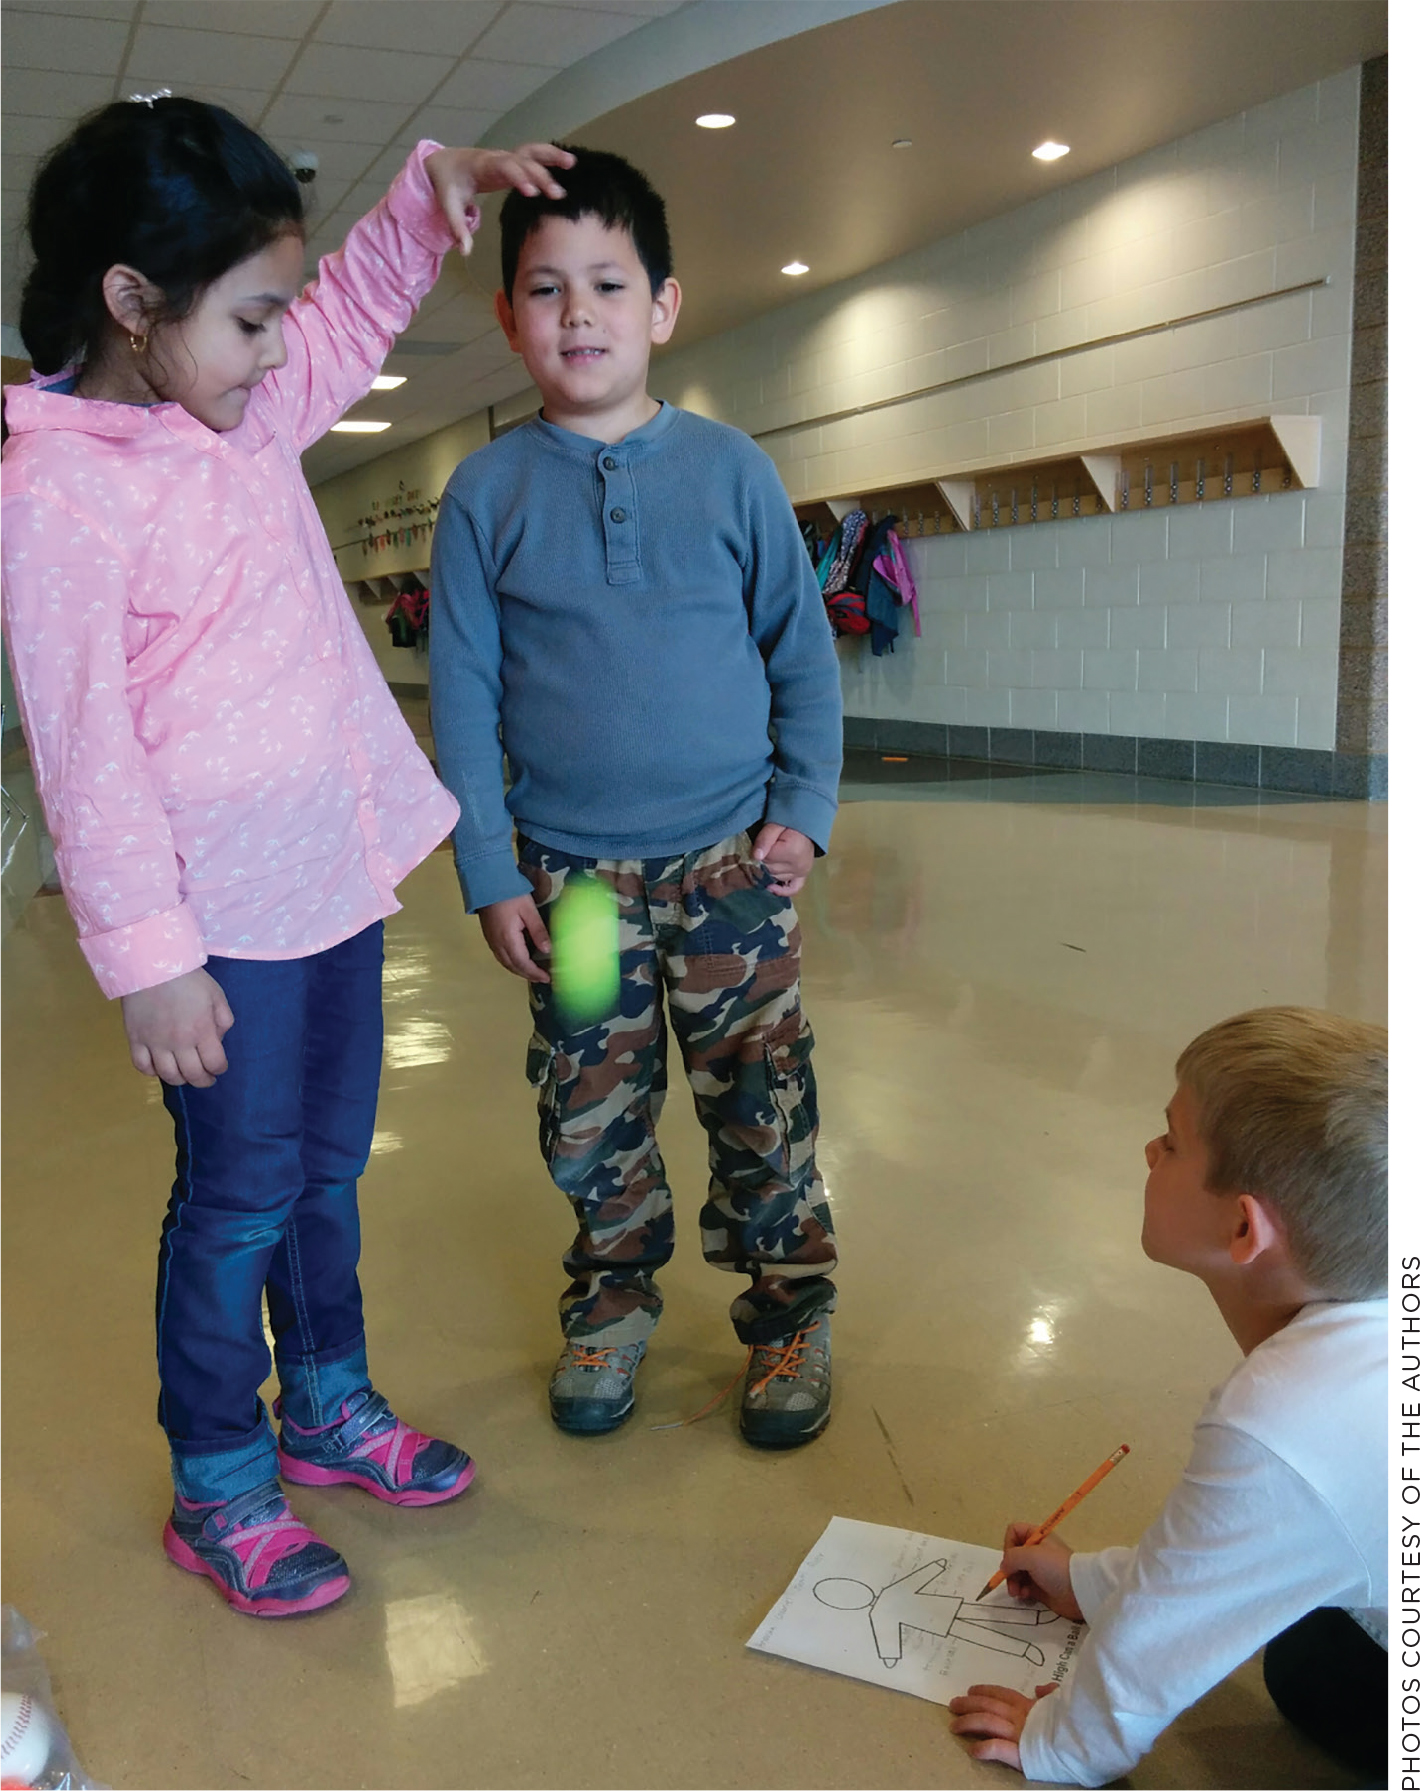
Students collect data to compare the “bounciness” of various balls.
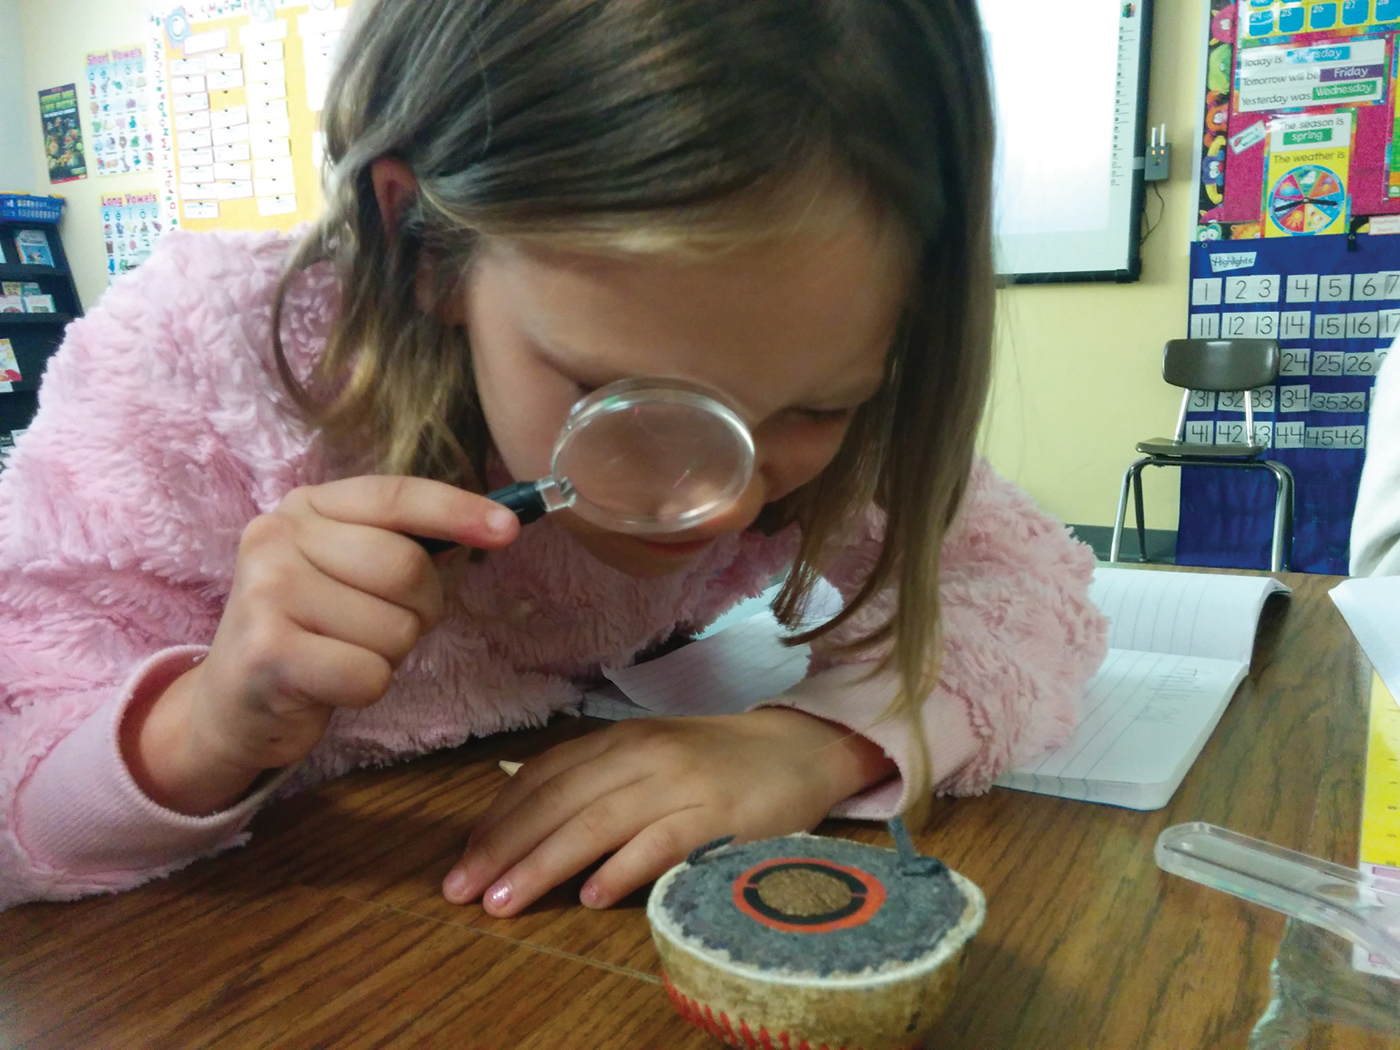
A student makes observations of the materials inside a baseball.
Students noticed that most high bouncers were soft (meaning squishy) and most low bouncers were hard. The golf ball was the only exception. Students also noticed that high bouncers were made of different materials than low bouncers. One student said the bouncy ball was made of rubber. We wondered, “Is rubber important for making a ball bounce? Do other balls also have rubber inside them? How could we find out?” A student then suggested we cut the balls in half to see what’s inside. “Let’s do it!” I said. To their delight, I brought out a set of sports balls I had cut in half using PVC pipe cutters (see How-to Video in Internet Resources). I had a set for each table group. If you are experiencing distance learning, provide photos or watch a video of a person cutting sports balls in half (see Lesson Materials and Video in Internet Resources).
Scientists make observations using their senses. So, I encouraged students to touch, smell, and closely examine (using a hand lens) the different materials each ball was made of. Together we generated a list of the different materials we had observed, including felt, leather, wood, yarn, plastic, and rubber. I taught students how to draw and label diagrams to describe what each ball is made of. What we discovered was that all the high bouncers had some kind of rubber inside. (One of the golf balls was actually filled with little green rubber bands.) We also discovered the bouncy ball did not have air inside. It was entirely made of rubber!
Students recorded a claim (answer to their question) in their science notebook. I documented our findings visibly in the classroom as Evidence #1. We reflected on how patterns can be used as evidence in science. Then I asked, “Why do you think each ball is made of different materials?” Students came to the conclusion that balls are made of different materials because they are used for different purposes. I emphasized the disciplinary core idea: A material can be described by its observable properties. Different properties are suited to different purposes. I mentioned that during our next literacy block, we would read about the properties of rubber and try to figure out what makes this material so special.
Explain (Day 4)
I found several books in our school library from the Material World series by Claire Llewellyn, including a book called Rubber (2002). I showed students the series of books and explained that the materials that make up our world each have different properties, which makes them useful for different things. I also explained that materials are made of matter, or tiny particles too small to see. We then read the book about rubber together as a class. I asked students to pay close attention to how the author described rubber. We would be organizing five words that describe rubber into a bubble map (see Internet Resources). To differentiate learning, advanced students could read this text independently or jig-saw to teach each other about the different properties of rubber. English-language learners could use a different text at a lower reading level, such as Rubber by Abby Colich from the Exploring Materials series (2014).
After reading the text, students worked individually to list the five properties of rubber in their science notebooks, which included flexible, stretchy, springy, waterproof, and strong (because it doesn’t break). I then asked students to evaluate which property of rubber they think is most important for making a ball bounce. After discussing this with a partner, students recorded what they were thinking in their science notebooks. Samples of student work are available in Lesson Materials (see Internet Resources). Most students reasoned that rubber is bouncy because it is stretchy and springy. When rubber stretches, it springs back to its original shape. We discussed how we could gather measurable, observable evidence to support this idea. I explained that a materials scientist would measure and test the properties of the material. How could we measure “stretchiness?” And, how could we show that being stretchy is important for making a ball bounce? Does a bouncy ball stretch when it bounces?
Elaborate (Day 5)
To answer our first question, we decided to use a ruler to measure the length of a rubber band before and after stretching it. Working with an elbow partner, students also measured the stretchiness of other materials for comparison. (Make sure students are wearing safety glasses during this activity. Demonstrate how to safely stretch a rubber band and measure it.) Some materials did not stretch at all (e.g., wood, metal). Other materials stretched a little bit (e.g., felt, leather, and yarn). We found that a plastic bag was very stretchy, but not springy. It couldn’t return to its original shape. Only the rubber band was both stretchy and springy. In fact, a rubber band could stretch up to 12 inches then return to its original shape of 3 inches. Students recorded the measurement in their science notebook as Evidence #2.
To answer our second question about whether stretchiness is important for making a ball bounce, we needed to change scale. I filmed a bouncing ball in slow motion. We also obtained videos from the internet of balls bouncing in slow motion (see Internet Resources). Sure enough, we observed that each ball stretches or flattens when it hits the ground then returns to its original shape. One student commented, “I think the stretchiness is giving the ball a boost.” From these observations, students concluded that stretchiness is important for making a ball bounce. I asked students to draw and write about this observation in their science notebooks, documenting this as Evidence #3. Specifically, I prompted students to draw how the shape of a ball changes before, during, and after it bounces. Students then reflected on all that they had written in their science notebooks about how rubber makes a ball bounce. Students shared the explanation they had written with a partner. Together we celebrated our accomplishments. We now had a good explanation for the phenomenon supported by evidence from our own investigations.
Evaluate
Following this sequence of investigations, I noticed that students began asking lots of questions about what things are made of. I placed the book series about properties of materials in the classroom library. These information books became popular reading choices for several weeks following. To formatively assess students’ understanding of properties of materials, I used the work students produced in their science notebooks. Students wrote in their science notebooks after each investigation, constructing an explanation for the phenomenon over time. Sentence frames were provided to support developing writers. Alternatively, you could invite students to complete a graphic organizer to summarize the evidence they have gathered (see Lesson Materials in Internet Resources). Students could then use the organizer to write an evidence-based explanation for the cause of the phenomenon. A suggested rubric for assessing students’ written explanations is provided (see Lesson Materials in Internet Resources).
Supporting Student Sensemaking
Developing a classroom culture where students gather evidence to explain everyday phenomena is challenging. We can support students’ developing ability to reason about phenomena by explicitly teaching them to use crosscutting concepts as strategies for sensemaking. Teachers can ask open-ended questions framed in the language of the crosscutting concepts to guide or facilitate student sensemaking (Table 1). The crosscutting concepts have also been referred to as “lenses” that help students focus their attention on what is relevant to understand when investigating a phenomenon (Rivet et al. 2016). To model and explicitly teach students how (and when) to use a crosscutting concept, I created a set of oversized eyeglasses each labeled with a key word or phrase (Figure 1). I wear the glasses when I want to emphasize or cue students to use a crosscutting concept that will help them make sense of a phenomenon.
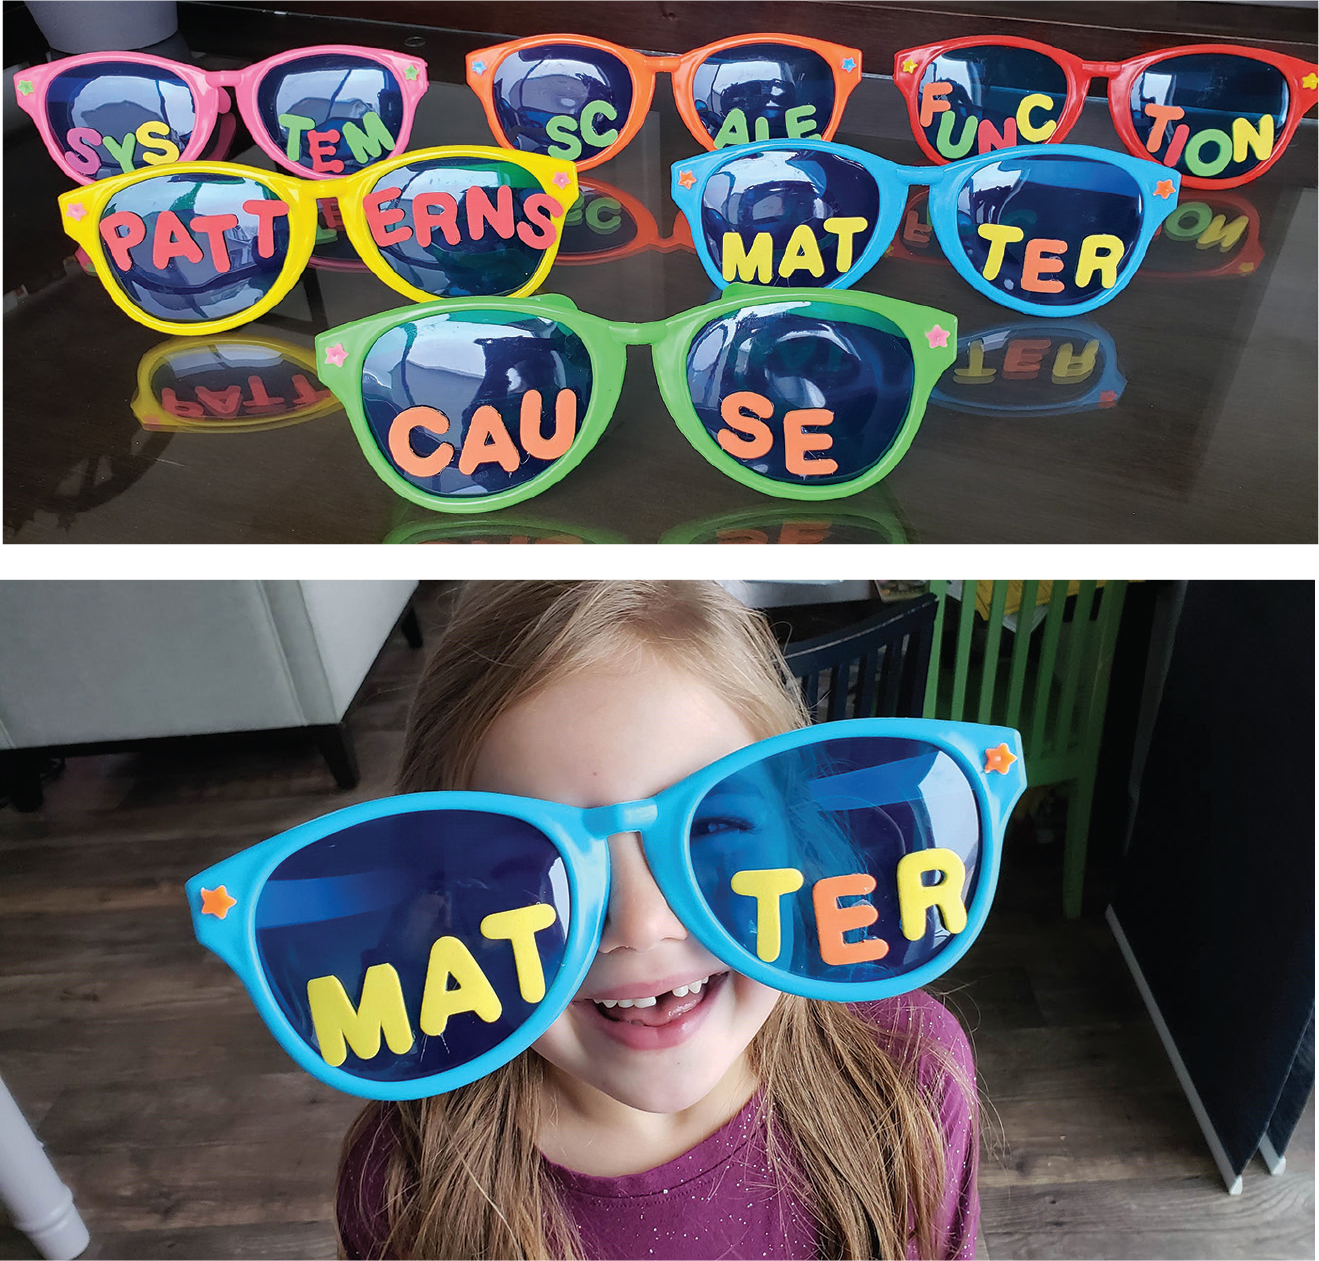
Glasses labeled with crosscutting concepts support student sense-making.
| Table 1. Supporting K–2 students in sense-making using crosscutting concepts. | ||||||||||||||||
|---|---|---|---|---|---|---|---|---|---|---|---|---|---|---|---|---|
|
In this lesson, for example, I put on the Cause and Effect glasses when I introduced the bouncy ball phenomenon. I asked students to identify what causes the ball to be so bouncy. I put on the Patterns glasses when we interpreted the data in our graph and sorted the balls into two groups (low versus high bouncers) to look for similarities and differences. I put on the Matter glasses when we read the book about rubber, identified its properties, and tested the stretchiness of different materials. I put on the Scale glasses when we changed time scales and observed a ball bounce in slow motion. I returned to the Cause and Effect glasses when I asked students to write an explanation for the cause of the phenomenon.
I have found that teaching students to use the crosscutting concepts as strategies for making sense of phenomena promotes metacognition and builds confidence. When students feel stumped, they know they can grab a pair of glasses and use a science strategy to learn more. Students feel empowered as they grow in their ability to do science. When we model how to use and apply crosscutting concepts to make sense of phenomena, we help students become more adept at using these strategies independently and better prepare them to reason scientifically in upper grades.
Conclusion
When we start science lessons with observable phenomena, students are motivated to ask questions and construct an explanation. Students’ everyday experiences and interests can be leveraged to drive learning in science. With guidance from a teacher, even young students can construct written explanations for phenomena based on evidence they have gathered from their own investigations. As students engage in authentic scientific inquiry that is meaningful and relevant to understanding their everyday experiences, they deepen their understanding of science and develop the ability to apply disciplinary core ideas and crosscutting concepts to make sense of phenomena.
Internet Resources
Fair Test Organizer from Scholastic https://images.scholastic.co.uk/assets/a/d0/7f/fair-test-organiser-1116647.pdf
How-to Video for PVC Pipe Cutters https://www.commercial-industrial-supply.com/resource-center/how-to-use-pvc-pipe-cutters/
Lesson Materials (Google Slides and Data Table) https://sites.google.com/view/3dsciencelessons/physical-science/matter-its-interactions/balls-bounce?authuser=0
Slow-motion Videos of Balls Bouncing
- https://www.youtube.com/watch?v=sVTJNv3-mWk (bouncy ball)
- https://www.youtube.com/watch?v=zd2V4_FNMls (tennis ball)
- https://www.youtube.com/watch?v=AkB81u5IM3I (golf ball)
Thinking Map for Describing: Bubble Map https://www.thinkingmaps.com/why-thinking-maps-2/
Video: Sport Balls Bouncing https://www.youtube.com/watch?v=pZlYl0l2lFs
Video: Sports Balls vs Waterjet https://www.youtube.com/watch?v=bmtBXgIVy2k
April Mitchell (april.mitchell@aggiemail.usu.edu) is a former elementary science specialist and a current doctoral student in the School of teacher education and leadership at Utah State University in Logan, Utah. Kimberly Lott (kimberly.lott@usu.edu) is an associate professor of science education at Utah State University.
5E Earth & Space Science Instructional Materials Phenomena Science and Engineering Practices Early Childhood Grade 1 Grade 2 Grade K