
Middle School | Daily Do
Are There Differences in How People Are Affected by the COVID-19 Pandemic in the United States? If So, Why Are There Differences, and What Should We Do About the Disproportionate Impact of COVID-19?
By Todd Campbell, Okhee Lee, Eileen Murray, and John Russell
Biology Crosscutting Concepts Disciplinary Core Ideas Engineering Equity Is Lesson Plan Life Science NGSS Phenomena Science and Engineering Practices STEM Three-Dimensional Learning Middle School Grades 6-8
Sensemaking Checklist


Introduction
In today's task, students answer this question: Are there differences in how people are affected by the COVID-19 pandemic in the United States? If so, why are there differences, and what should we do about the disproportionate impact of COVID-19?
Students use science and engineering practices alongside disciplinary core ideas and crosscutting concepts to identify and explain differences in how people are affected by the COVID-19 pandemic. Then they propose justice-centered solutions for addressing the disproportionate impact of COVID-19.
Today’s Daily Do extends our previous lesson—How can we make informed decisions to keep ourselves and our communities safe during the COVID-19 pandemic? Daily Do by Todd Campbell and Okhee Lee—to address systemic racism associated with the COVID-19 pandemic (Lee and Campbell 2021). Today’s task was co-designed with Eileen Murray and John Russell.
Daily Do Playlist: Tracking COVID-19 in the United States
Are there differences in how people are affected by the COVID-19 pandemic in the United States? If so, why are there differences, and what should we do about the disproportionate impact of COVID-19? is a stand-alone task. However, it can be taught as part of an instructional sequence in which students are provided authentic opportunities to develop and use the science and engineering practice Using Mathematics and Computational Thinking to make sense of the spread of COVID-19 through the U.S. population and the disproportionate number of cases and deaths in non-white communities. Students further use data to support them in identifying actions they can take to keep their families and communities safe and implementing their proposed solutions to ending health disparities.
Part 1: Can we identify differences in how COVID-19 is impacting specific racial and ethnic populations in the United States? [Data Science, Mathematical and Computational Thinking, and Critical Consciousness]
Activity A: What do you notice and wonder? What questions or comments do you have?
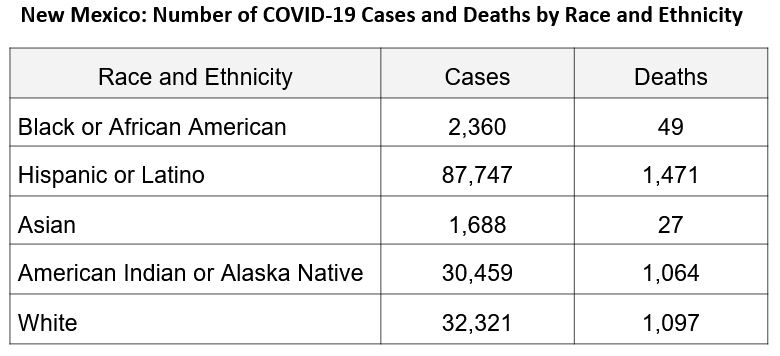
Table 1 below presents the numbers of COVID-19 cases and deaths by race and ethnicity in New Mexico as of March 7, 2021.
Note to Educators. Because of the disproportionate impact of COVID-19 widely reported in the news, New Mexico was selected as an important state for students to examine, alongside two others (students’ home state and another of their choosing), in this Daily Do.
Students record their noticings, wonderings, and questions or comments under Activity A in the student handout or in their science notebooks.
Additional Distance-Learning Support. You may choose to use the student handout in either face-to-face or virtual settings. We’ve also provided a series of Google Slides templates you might use to support virtual synchronous and/or asynchronous small-group discussions. If you choose to use the Google Slides templates, ask one student to make a copy for their group, then share the link with you and their group members. The first Google Slides set, Can we identify differences in how COVID-19 is impacting specific racial and ethnic populations in the United States? Part 1, supports small-group work in Part 1, Activities A and B.
Then students discuss their work from Activity A in small groups of 3–4.
Next, students do the following:
- Write an argument about which racial and ethnic group is most affected by COVID-19.
- Using the data in the table above, provide evidence for your argument.
- Determine if you need any other data to strengthen your argument.

Activity B
Students explore information collected by The COVID Tracking Project, a volunteer organization launched by journalists at The Atlantic magazine who are dedicated to collecting and publishing data to help people better understand the COVID-19 outbreak in the United States.
Using the link to the project’s racial and ethnic data dashboard (https://covidtracking.com/race/dashboard), students enter the name of the state they live in and take a screenshot of the data that come up. Students insert their screenshot into the appropriate table in the student handout. Then students enter the name of another state of their choice and take a screenshot of the data for that state. Students also add this screenshot to the appropriate table in the student handout. A sample screenshot for New Mexico appears in Figure 1.
Note: Not all states report COVID-19 data for their specific racial and ethnic populations. If your state or the other state you select does not report COVID-19 data sorted by race and ethnicity, please select another state that does. However, please keep these differences and limitations in COVID-19 data reporting in mind for possible action you can take in Part 5!
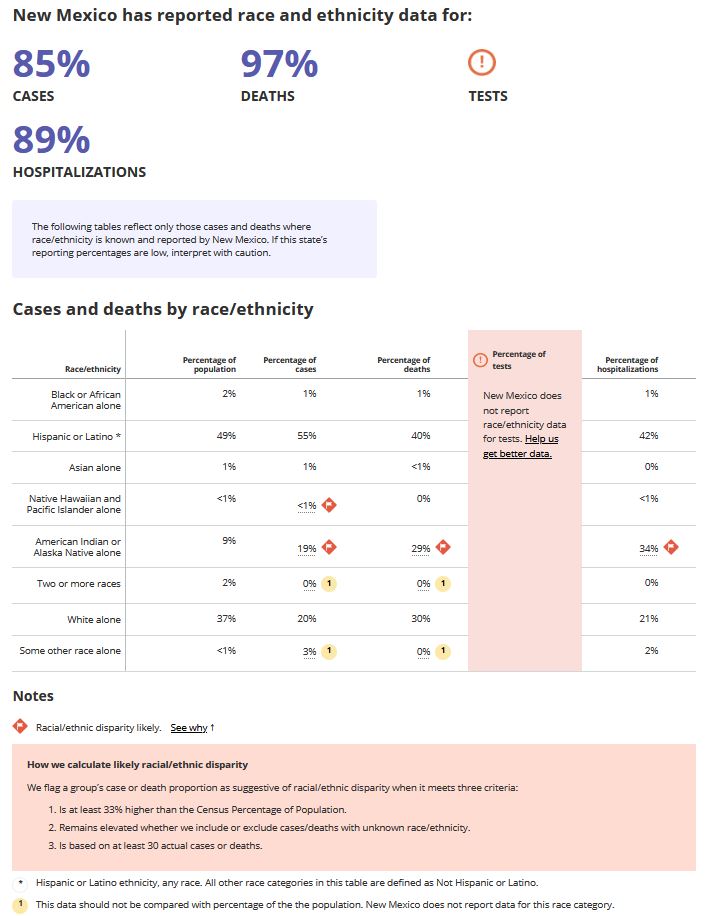
The purpose of this activity is to allow students to explore the impact of data representation, particularly the difference between the number of cases (or deaths) in Table 1 versus the percentage of cases (or deaths) in Figure 1. Students should modify their initial argument based on the data representation and discuss patterns across states.
After students paste the data about New Mexico (Figure 1) and their two states in the student handout, they discuss the following questions in their small group.
- How is this data the same as or different from the data you used as evidence to support your argument in Activity A?
- New Mexico (Figure 1) has a red flag, indicating a likely racial and ethnic disparity. Read “How we calculate likely racial/ethnic disparity” at the bottom of Figure 1. Discuss how this explanation might impact your argument from Activity A.
Look at the data across New Mexico (Figure 1), your state, and the other state you selected, and answer the following:
- Describe any patterns in the reporting of racial and ethnic data across the three states.
- New Mexico reported racial and ethnic data for 79% of cases and 96% of deaths.
- What percentages of cases and deaths were reported by race and ethnicity in your state and the other state you selected?
- States report higher or lower percentages of cases and deaths by race and ethnicity. How could the differences in the amount of data reported affect decision-making?
- Does having this additional data strengthen or weaken your argument from Activity A?
- If the data strengthen your argument, revise your argument by incorporating the data in Activity B.
- If the data weakens your argument, make a new argument using all the data provided in both Activity A and Activity B.
Part 2: Are there different ways we can examine our data to make comparisons among different racial and ethnic groups affected by COVID-19? [Mathematical and Computational Thinking]
In Part 1, students compared the percentages of cases and deaths among racial and ethnic groups in the three states.
In Part 2, students explore another way of organizing the data. They compare the rates of cases and deaths among racial and ethnic groups in the three states per 100,000 people.
Activity A
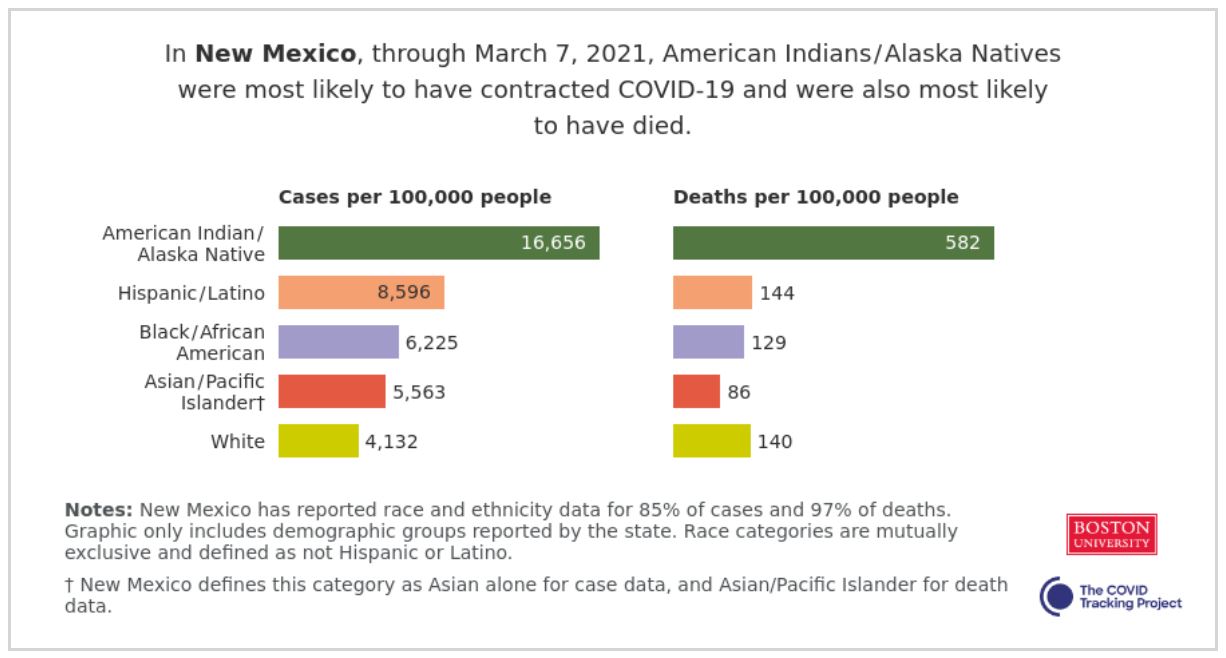
Students explore the numbers of cases and deaths per 100,000 people in New Mexico on March 7, 2021, in Figure 2.
Students discuss the following questions that are introduced in the student handout:
- What does “cases per 100,000” mean?
- What do the notes at the bottom of Figure 2 about the percentage of reported data mean? In what ways might this data impact your argument from Part 1?
- Does having this additional data strengthen or weaken your argument from Part 1, Activity A?
- If the data strengthen your argument, revise your argument by incorporating the data.
- If the data weaken your argument, make a new argument using all the data provided in both Part I, Activity B, and Part 2, Activity A.
In Figure 2 above, the data are reported as the number of individuals per 100,000 people of a certain racial and ethnic group in the state.
Activity B
Using The COVID Tracking Project’s Infection and Mortality by Race and Ethnicity Dashboard (https://covidtracking.com/race/infection-and-mortality-data), students find their two states. Students take screenshots of the data for each state and insert the screenshots in the appropriate tables in the student handout, or direct student groups to create a copy of the Google Slides template Can we identify differences in how COVID-19 is impacting specific racial and ethnic populations in the United States? Part 2.
After students paste the screenshots of their two states in the student handout, they discuss the following questions in their small group:
- How is this data the same as or different from the data you used as evidence to support your argument in Part 1, Activity A?
- New Mexico indicates a likely racial and ethnic disparity. Discuss how this data might impact your argument from Part 1, Activity A.
Look at the data across New Mexico, your state, and the other state you selected:
- Describe any patterns in the reporting of race and ethnicity data across the three states.
- Does having this additional data strengthen or weaken your argument from Part 1, Activity A?
- If the data strengthen your argument, revise your argument by incorporating the data in Part 2, Activity A.
- If the data weaken your argument, make a new argument using all the data provided in both Part 1 and Part 2.
Part 3
Students learn that the numbers of cases and deaths in Part 1, Activity A, are represented differently as (a) percentages in Part 1, Activity B, and (b) rates or numbers of cases/deaths per 100,000 people in Part 2, Activity A. Using the percentages and the rates, students answer the following questions in the student handout:
- In Part 1, how were you able to find racial and ethnic disparities using the percentages of cases and deaths in the three states?
- In Part 2, how were you able to find racial and ethnic disparities using the rates of cases and deaths per 100,000 people in the three states?
- From the percentages in Part 1 and the rates in Part 2, how do these two representations provide the data that complement each other to provide more complete data?
- From Part 1 and Part 2, what conclusions do you draw about racial and ethnic disparities in the three states?
Students recognize that the same data (i.e., the numbers of cases and deaths in Table 1) can be represented differently (e.g., percentages in Figure 1 and rates in Figure 2). Regardless of the different representations, the racial and ethnic disparities for COVID-19 in the United States are visible!
Part 4: What are possible causes for the disproportionate impact of COVID-19? [Critical Consciousness]
In Parts 1 and 2, students identified racial and ethnic disparities.
In Part 4, students explore possible causes for the racial and ethnic disparities apparent in the COVID-19 data. Each student reads two of the following four news articles in a way that each small group reads all of the articles:
- The Fullest Look Yet at the Racial Inequity of Coronavirus
- How COVID-19 Is Highlighting Racial Disparities in Americans’ Health
- Many Latinos Couldn’t Stay Home. Now Virus Cases Are Soaring in Their Communities.
- Exclusive: Indigenous Americans Dying From COVID at Twice the Rate of White Americans
After reading the above news articles, students complete the graphic organizer in the student handout, which also appears below, or ask student groups to access the Google Slides template Can we identify differences in how COVID-19 is impacting specific racial and ethnic populations in the United States? Part 4. To begin, students identify three major causes for the disproportionate impact of COVID-19 highlighted in the readings. Then based on the information from the readings, students identify evidence to support their argument for each cause of racial and ethnic disparities.

Part 5: What justice-centered solutions can we propose to help solve the problem of the disproportionate impact of COVID-19?
In Part 4, students read about the causes for the disproportionate impact of COVID-19 on certain racial and ethnic groups.
In Part 5, students select one of the causes they identified. Then they write about one solution for this cause in the student handout.
The Daily Do concludes with students being encouraged to work with a parent, guardian, or teacher who can help them if they want to put their solution into action.
Note: If students have difficulty finding justice-centered solutions, the following article (also linked in the student handout) may give them some ideas:
Moving From the Five Whys to Five Hows: Addressing Racial Inequities in COVID-19 Infection and Death
References
Lee, O., and T. Campbell. 2021. How Can STEM Disciplines and STEM Education Work in Concert to Address Systemic Racism and the COVID-19 Pandemic? Creating a New Normal for STEM Education. American Association for the Advancement of Science (AAAS) Advancing Research and Innovation in the STEM Education of Preservice Teachers in High-Needs School Districts (ARISE) Blog post. https://aaas-arise.org/2021/01/26/how-can-stem-disciplines-and-stem-education-work-in-concert-to-address-systemic-racism-and-the-covid-19-pandemic-creating-a-new-normal-for-stem-education/