
feature
Remote Labs 2.0 to the Rescue
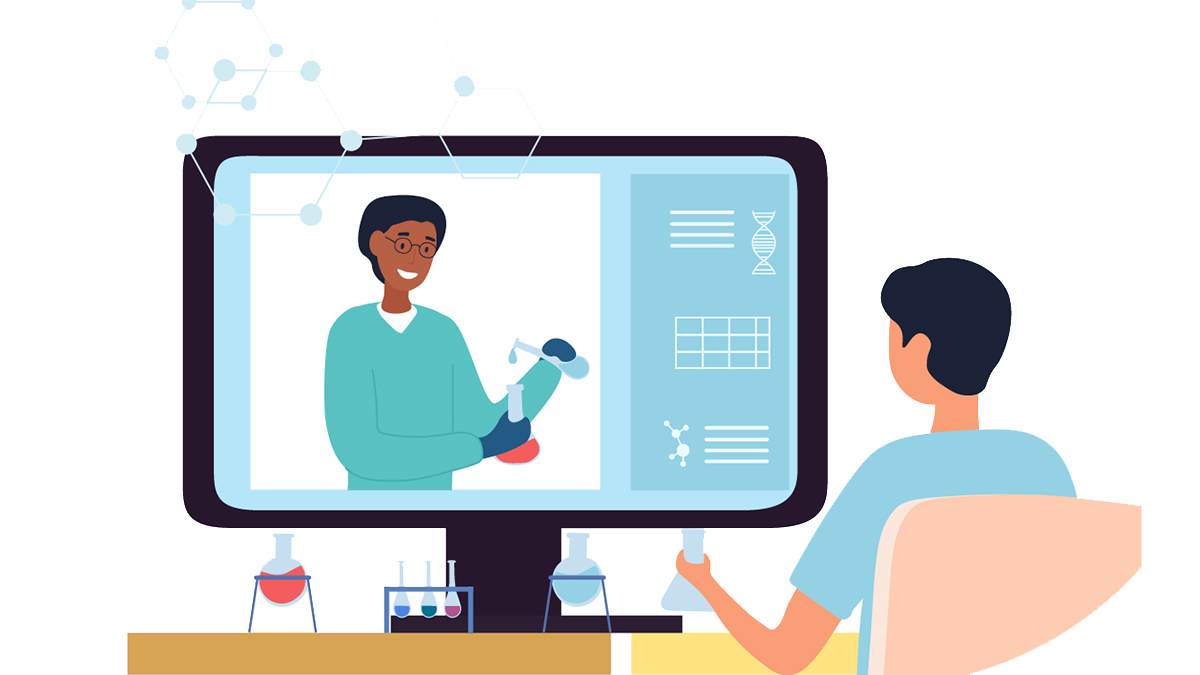
Doing science in a pandemic
The Science Teacher—July/August 2021 (Volume 88, Issue 6)
By Rundong Jiang, Chenglu Li, Xudong Huang, Shannon Sung, and Charles Xie
Laboratory experiences are a staple of science education (National Research Council 2006): Not only do they provide students with an avenue to acquire authentic skills needed for scientific research, referred to as science and engineering practices by NGSS, but they also allow students to go beyond rote memorization of facts to deepen their understanding of science through inquiry.
Unfortunately, with schools struggling to deal with the COVID-19 crisis, in-person labs are not a priority for many teachers. A popular alternative is virtual labs (Vasiliadou 2020). Virtual labs, however, cannot provide complete laboratory experiences. A better option is remote labs (Ma and Nickerson 2006), where real experiments are carried out. Compared to virtual labs, remote labs preserve some key aspects of experimental science, such as uncertainty and errors.
However, previous remote labs are based on a somewhat centralized model, where experts design and conduct experiments of a certain type with prescribed user options (Sauter et al. 2013). Such centralized remote labs didn’t achieve widespread applications because they offer little room for teachers and students to choose their own topics and subjects for investigation. It is also difficult for students to propose their own hypotheses, design new experiments with their teachers to test them, and then analyze the data collected from those experiments.
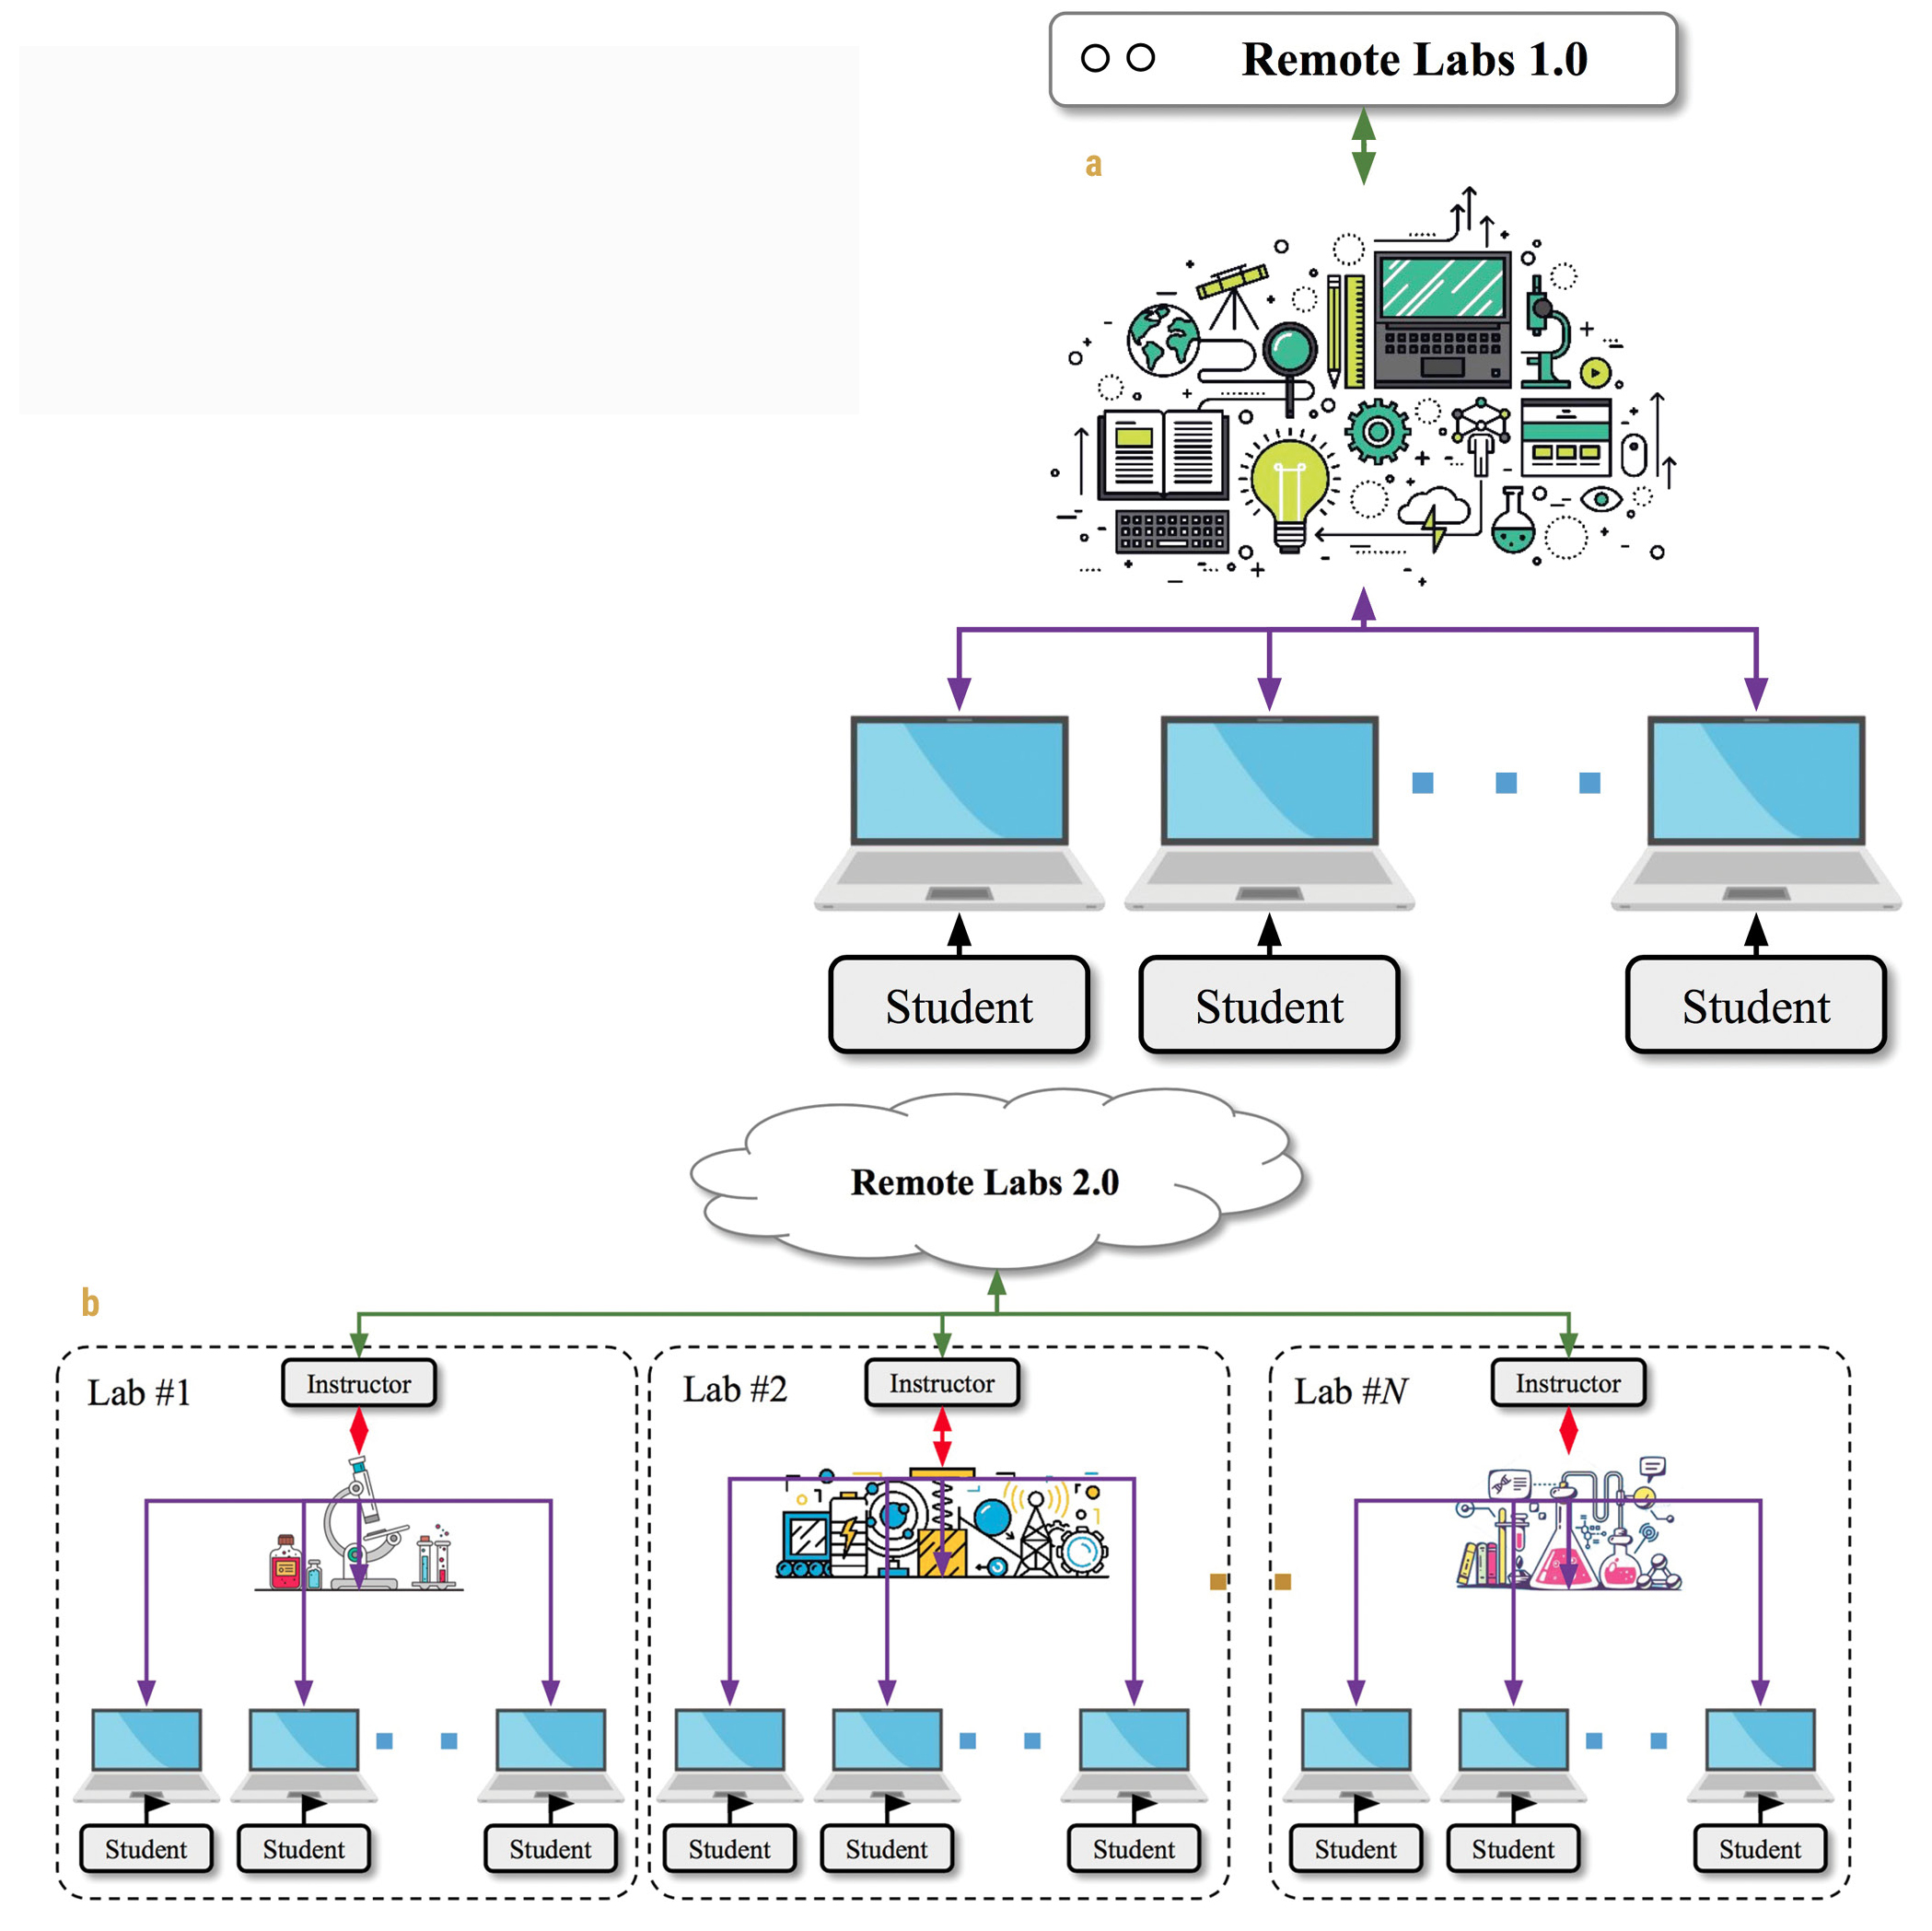
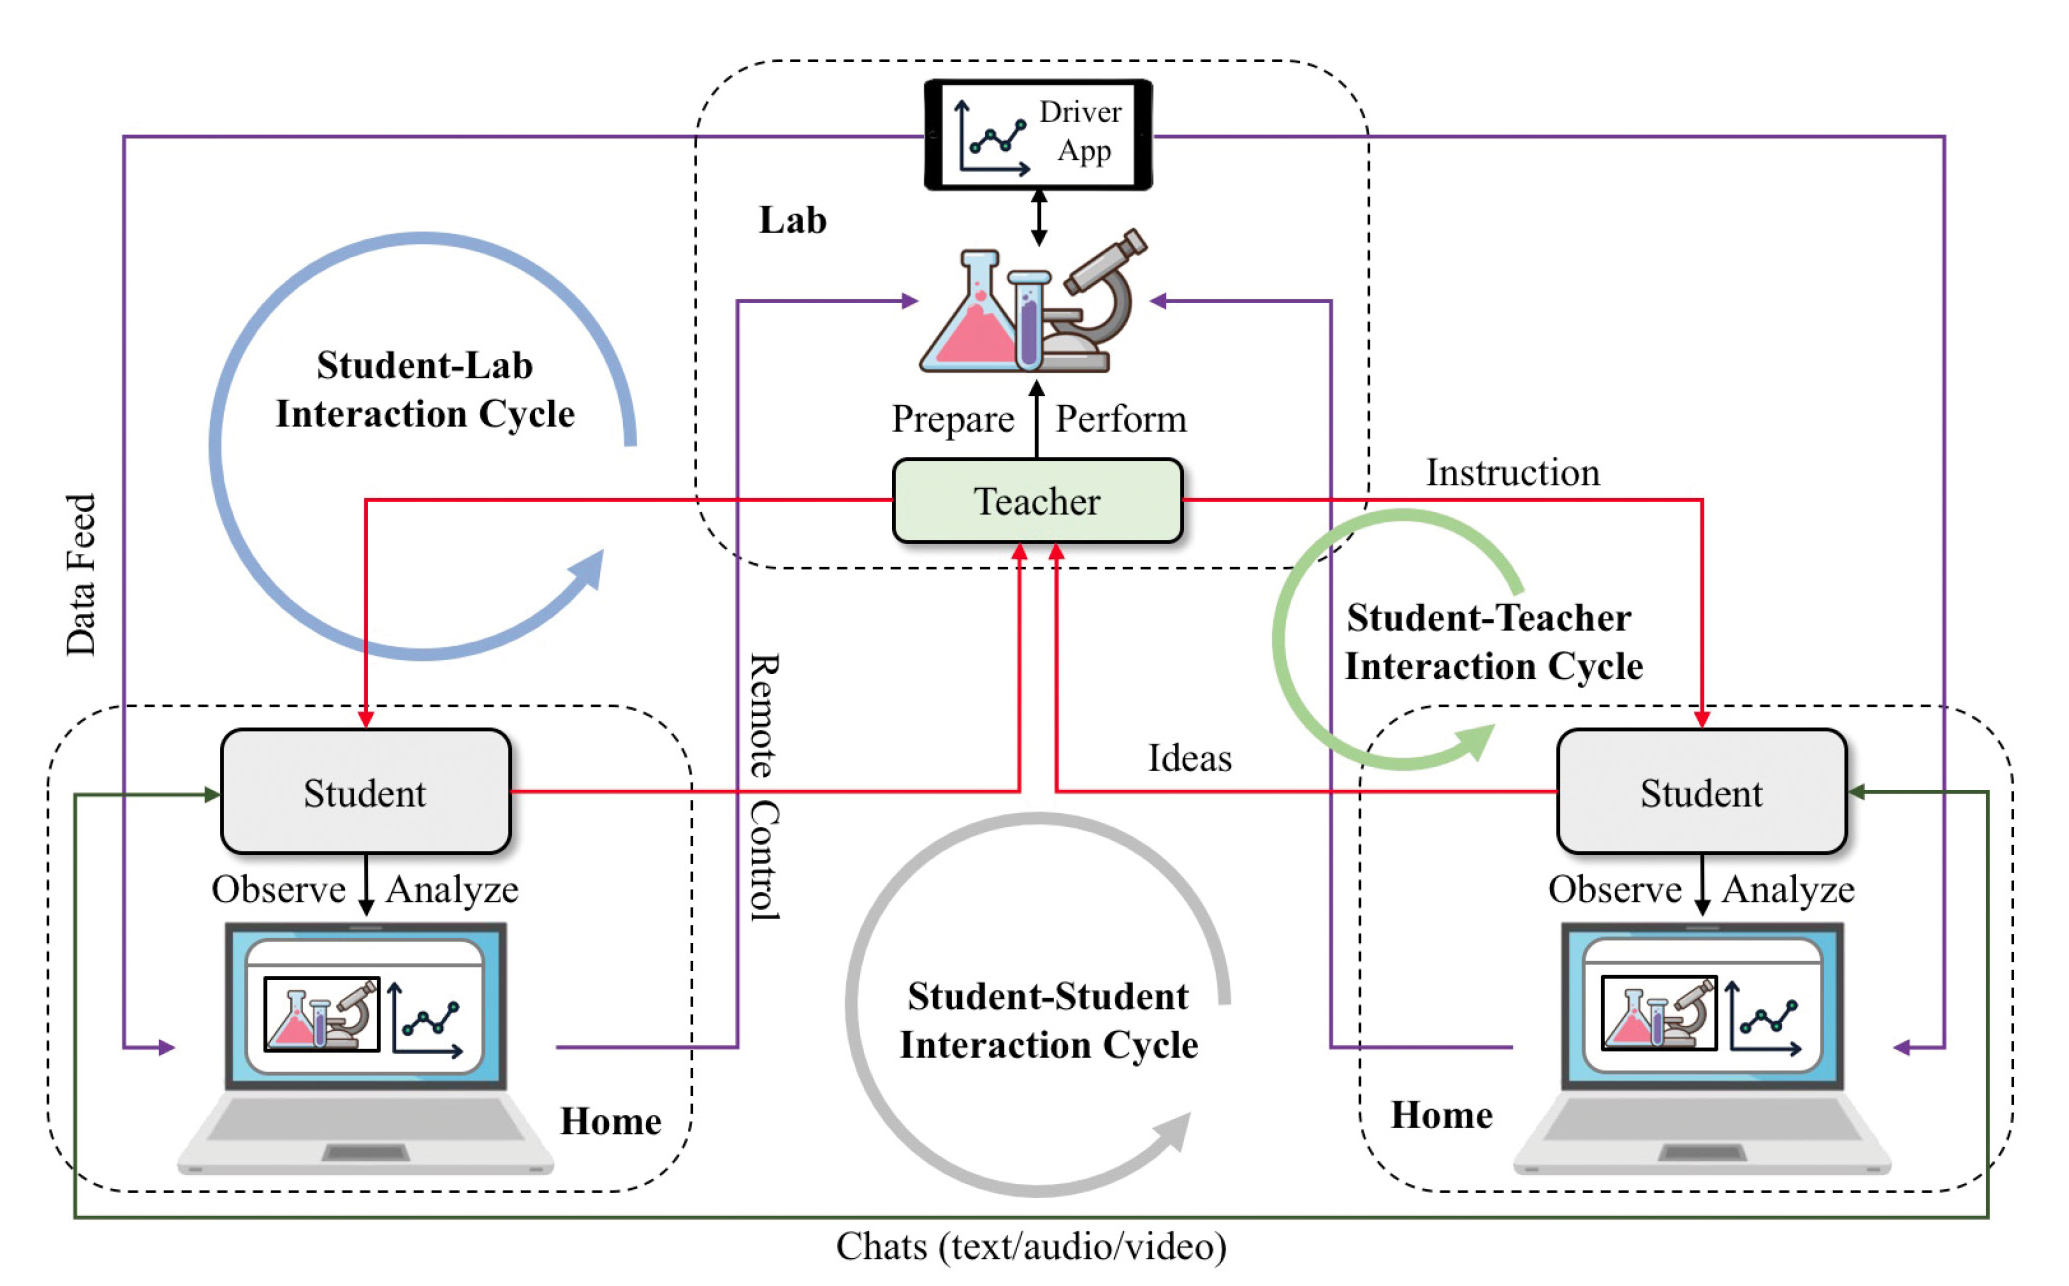
The status quo calls for a distributed model of remote labs, where students regain their autonomy over inquiry and teachers reclaim their mentorship. We refer to this new model as remote labs 2.0. Similar to the transformation of the web from 1.0 to 2.0, which democratized content creation, this new technology allows teachers to create their own remote labs and share with their own students (Figure 1). As such, they promise to enrich experimental science on the internet, providing an important cyberinfrastructure for science education from a distance.
An Implementation of Remote Labs 2.0
Telelab, our implementation of remote labs 2.0, is open-source and freely available for non-commercial use. The platform consists of sensors that collect data, smartphone apps that transmit data and videos from anywhere, and a web app that provides a user interface to view, analyze, and control remote experiments. Based on this platform, any science teacher can broadcast their own experiments to any number of students, who will not only observe the experiments unfold over a livestream of images but also receive real-time sensor data for independent analyses. The platform also allows teachers to record experiments along with sensor data and upload them to a repository, so students who miss the live sessions can also catch up by working with these pre-recorded experiments. As a video- and data-streaming platform, Telelab allows teachers to conduct experiments in the same way they would in a physical classroom under normal circumstances, which paves the way for a comfortable transition to remote labs.
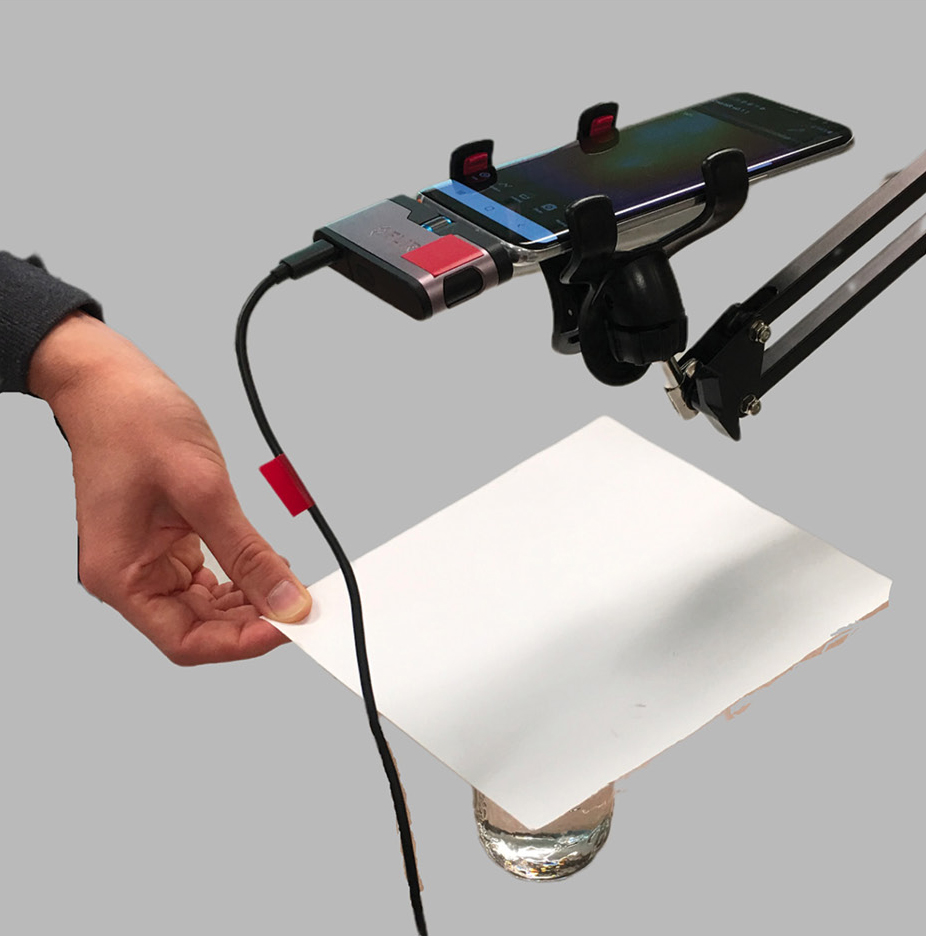
In the following sections, we demonstrate how Telelab can assist remote teaching with three common examples. For all the examples, a low-cost infrared (IR) thermal camera (Figure 2) is used as a high-throughput sensor to collect large quantities of temperature data in real time. Thermal imaging has been found to be a powerful inquiry tool for science education (e.g., Xie 2011; Xie and Hazzard 2011). Note that Telelab is not limited to only applications of thermal imaging.
Basic Live Session:
Students are familiar with the phenomenon that darker objects often feel warmer in the sun. To facilitate a structured inquiry (Martin-Hansen 2002) into this phenomenon, the teacher simply prints out varying shades of gray on a piece of paper, mounts a smartphone above the paper, and connects the IR camera to the phone, such that the paper is at the center of the view window. Using the Infrared Explorer, an app that we developed to support Telelab, the teacher then connects to a Telelab live room, where the thermal image of the paper and the temperature data are automatically streamed. Students who connect to the live room using their own devices can both view the thermal image and analyze the temperature data in real time (Figure 3).
Each student can add their own “thermometers,” which will display real-time temperature readings on the thermal image. A livestream of the teacher’s app screen allows the teacher to demonstrate how to use the thermometers and graphs to analyze the ongoing experiment. Using the built-in chat channel, the teacher can invite students to explain their thermometer placement or determine whether measuring the ambient temperature is necessary, for example. The teacher can also follow the Predict-Observe-Explain (POE) framework (White and Gunstone 1992) by asking students to predict what they will see when the paper is moved into the sun.
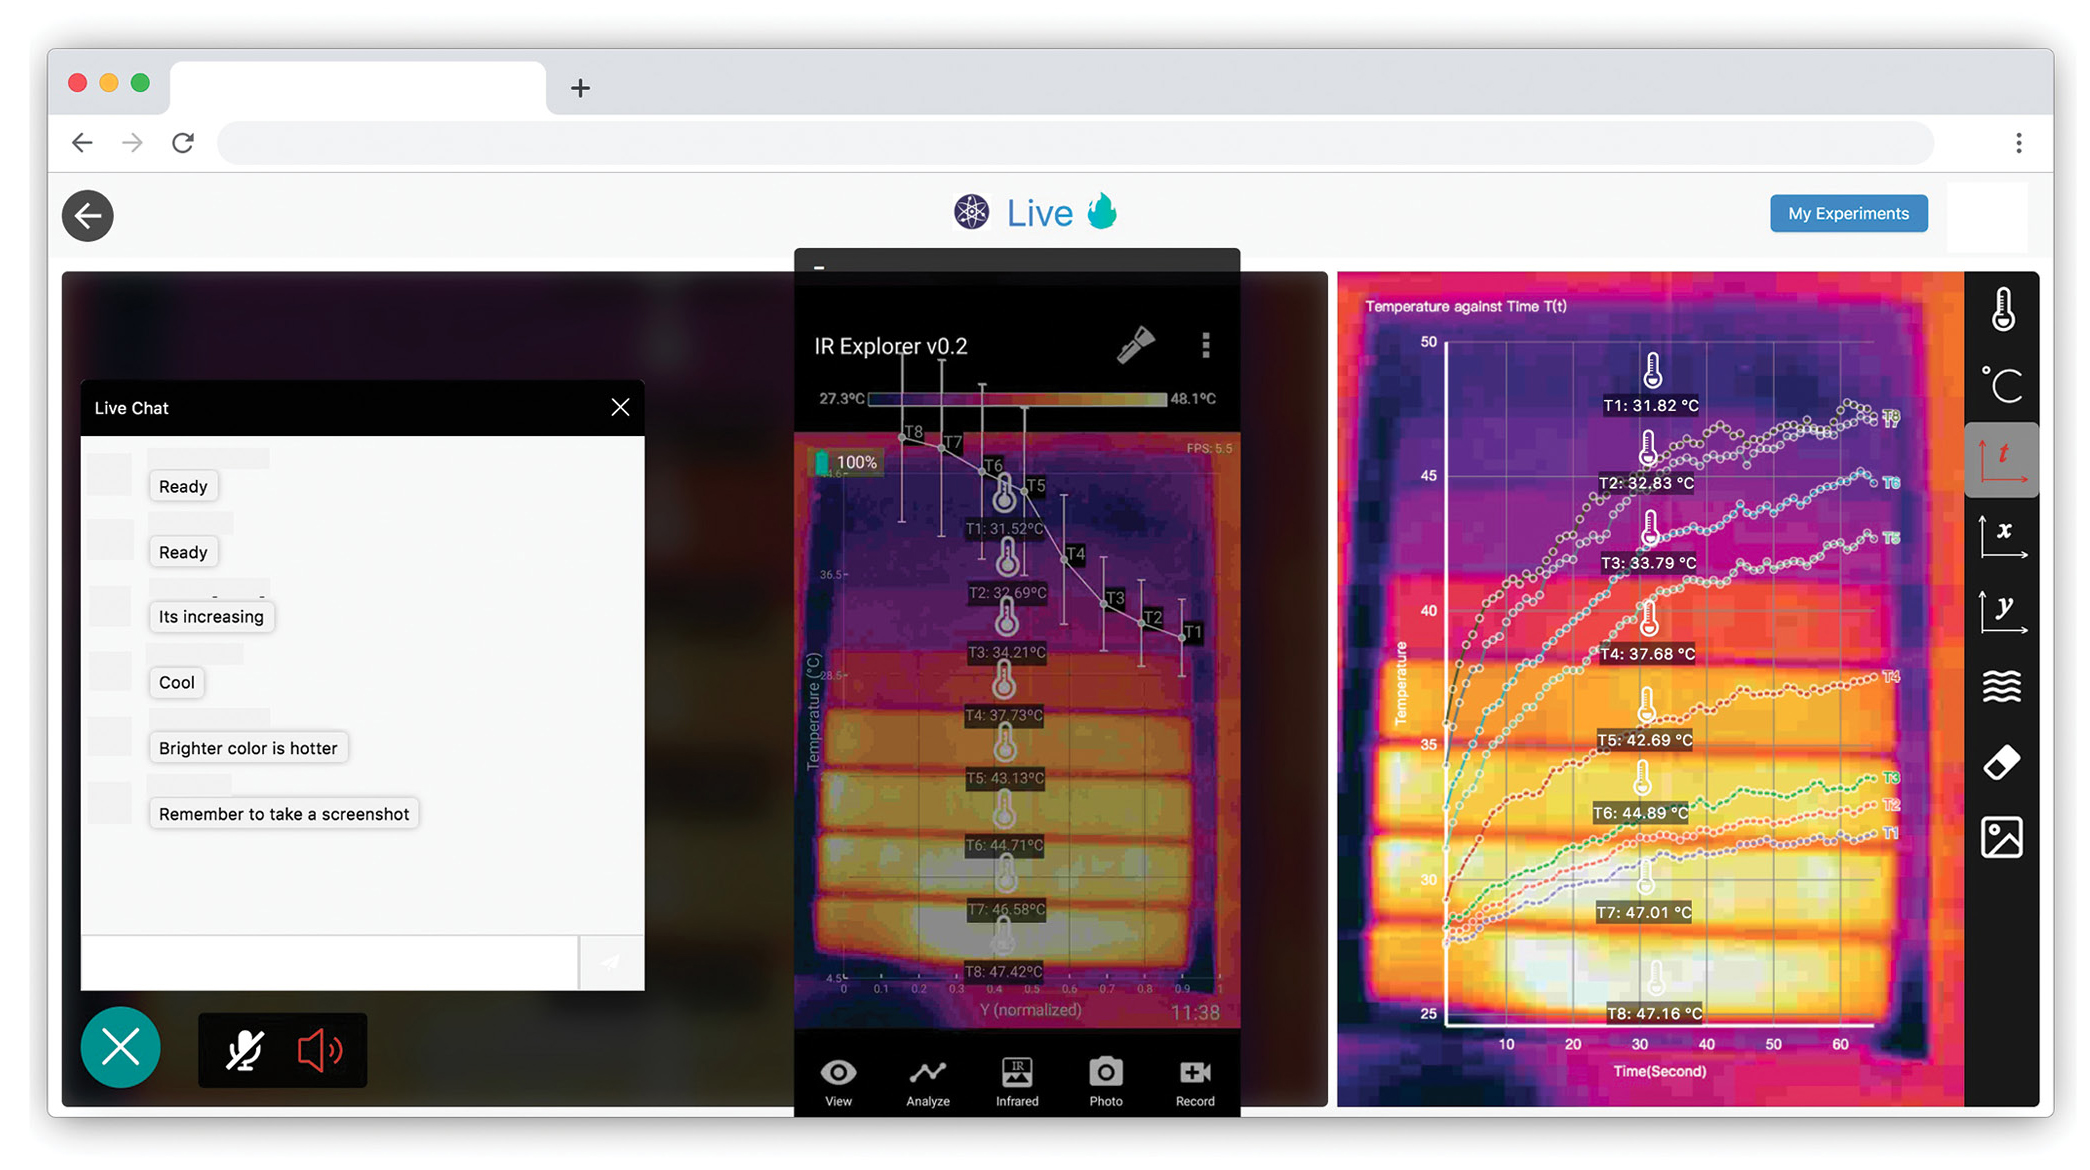
As sunlight shines onto the paper, students will observe a color gradient from blue-purple to yellow-orange in the thermal image, indicating that surfaces with darker shades of gray are warmer. If students place a thermometer on each gray strip and turn on the graph, they will also see a gradual rise in temperature as time passes (Figure 3). Together with numeric thermometer readings on top of the thermal image, these different visualizations provide multiple representations of the same data, which helps students learn complex, multifaceted concepts (Ainsworth 2008).
The entire experiment is automatically recorded in the cloud, so that once the teacher ends the live session, each student will have access to the full IR video and temperature data, which they can now use for further analysis. For instance, as the last step of the POE framework, students use the screenshot tool to collect both qualitative and quantitative evidence for their lab reports and analyze it to determine whether darker colors lead to higher surface temperatures in the sun. The teacher then provides a microscopic explanation of how light energy is converted to thermal energy. Finally, students use the Claim-Evidence-Reasoning (CER) framework (McNeill and Krajcik 2011) to synthesize their findings in their lab reports.
Remote Inquiry: An Instructional Model for Science Investigations Online
Take the light absorption experiment above as an example. After the initial experiment, one student may be curious how different colors absorb light energy, while another may wonder if different materials of the same color absorb the same amount of light energy, and they may each propose a different hypothesis for their teacher to test. Traditional physical labs afford such helpful classroom interactions that allow students to take ownership of their knowledge building, develop their epistemic agency, and become “doers of science” (Miller et al. 2018). Part of these activities can be facilitated with remote labs 2.0 operated by teachers.
Designed to exploit the pedagogical affordances of remote labs 2.0, remote inquiry (Figure 4) is an instructional model that reinstates these classroom interactions in a remote setting and supports many levels of inquiry (verification, structured, guided, and open), where students design the experiment procedures to be conducted remotely by a teacher, a teaching assistant, or even a robot. As the teacher selects student proposals, performs them, and shares them with the whole class, students have the opportunity to learn from and build on one another’s ideas. This type of collective inquiry (Slotta, Quintana, and Moher 2018) is a hallmark of laboratory experiences, which can now be realized remotely via Telelab.
Multiple Inquiry Cycles: The Reaction Between Baking Soda and Vinegar as an Example
The baking soda and vinegar experiment is a widely used chemical reaction that feeds into rich discussions about thermodynamics and chemical equilibrium, and it often takes not one, but multiple inquiry cycles with increasing depth and open-endedness for students to fully explore and explain the phenomena. With Telelab, chemistry teachers can kick off the instructional sequence with a structured inquiry of exothermic versus endothermic reactions and ease into a guided inquiry about key factors that affect the reaction rate.
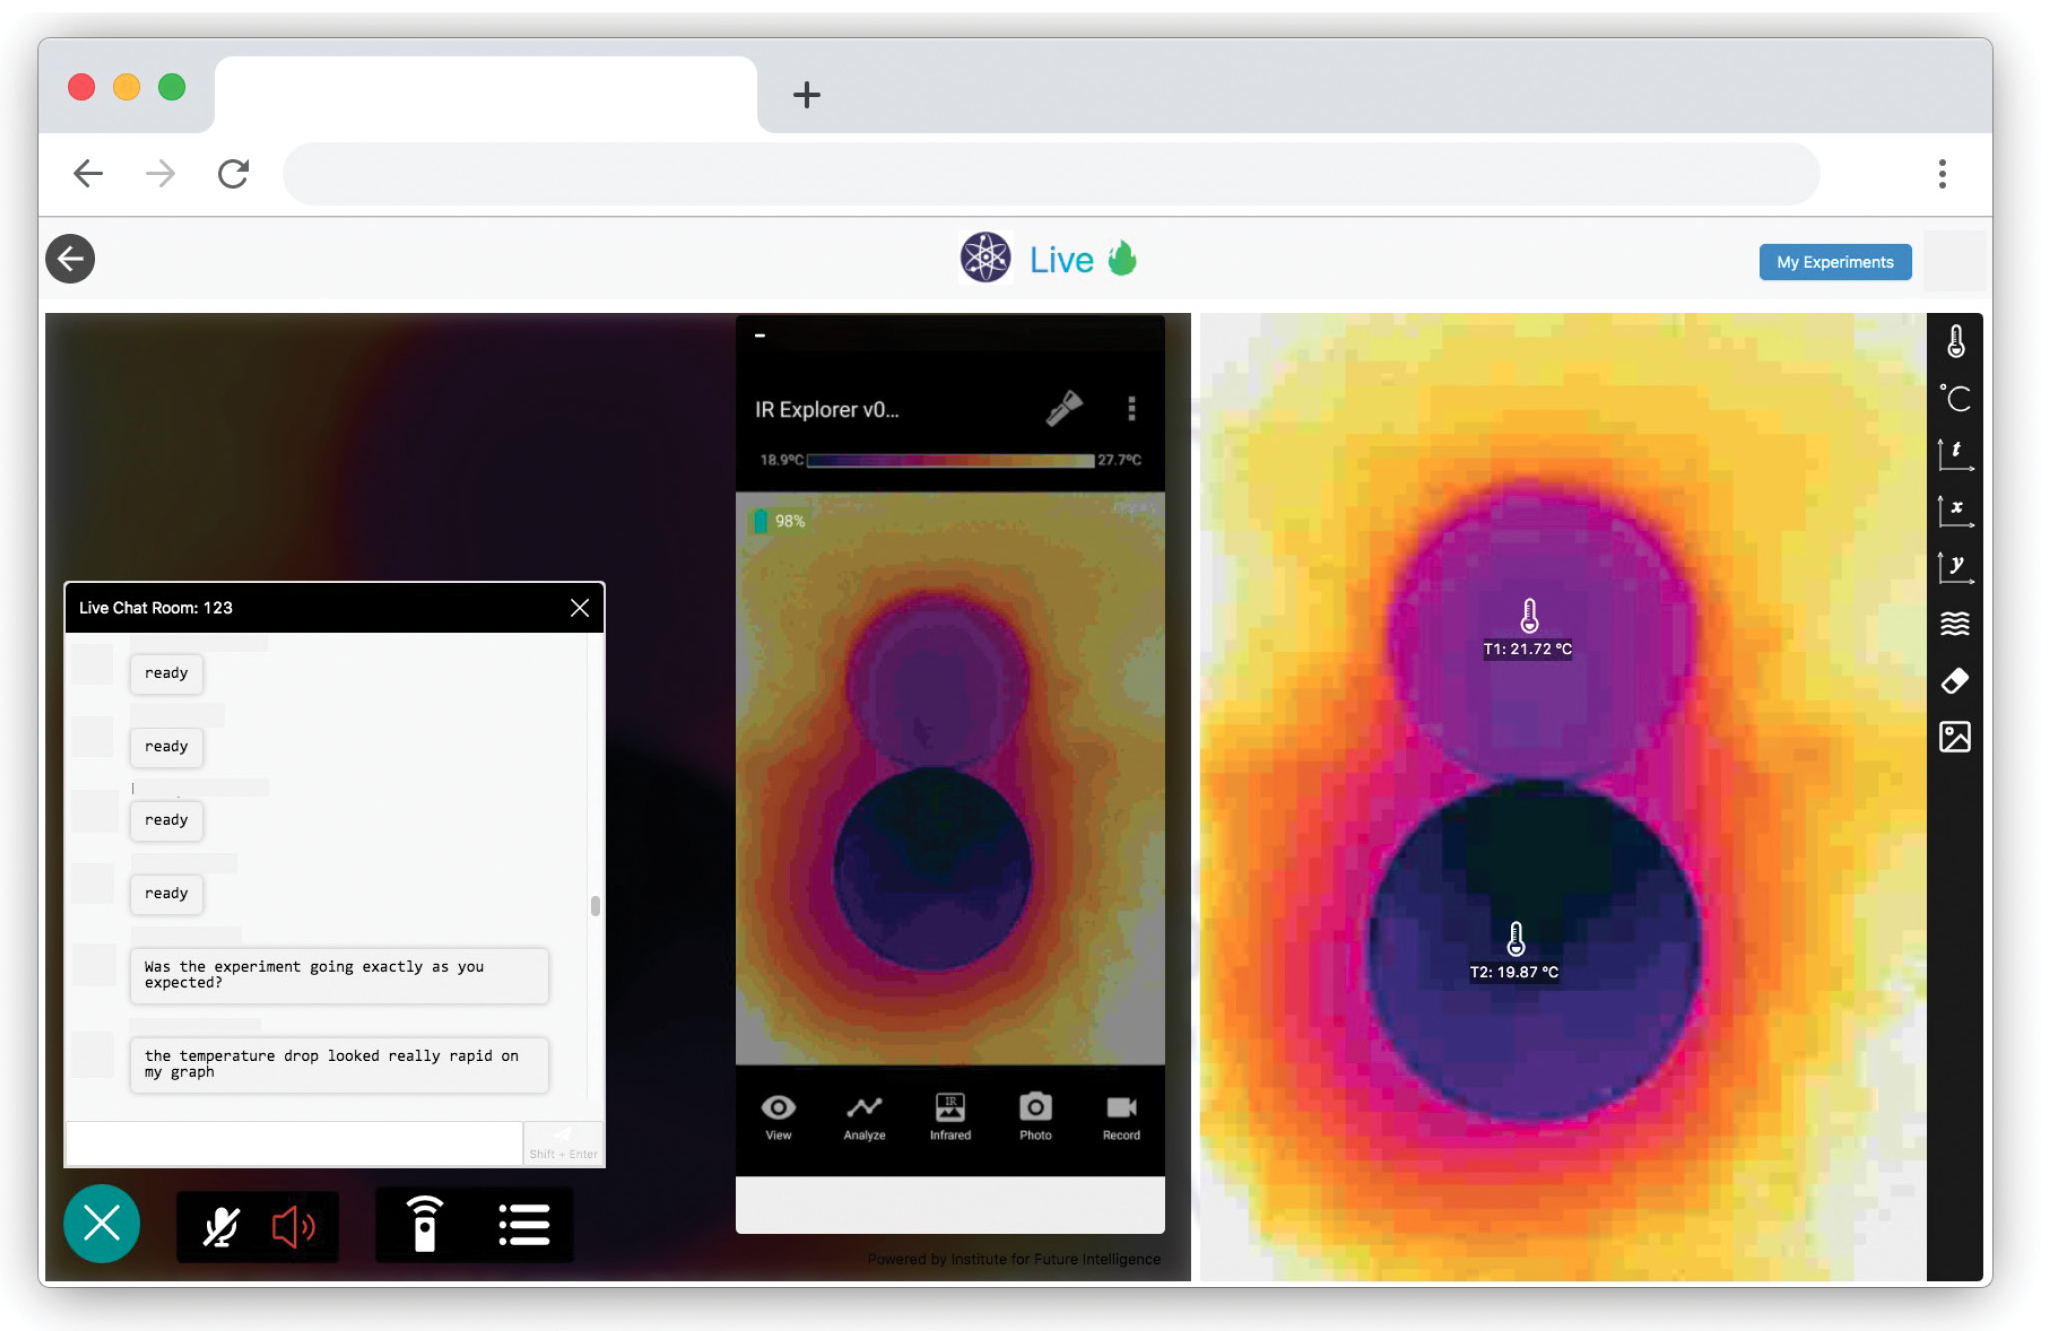
To set up the first inquiry cycle, “How do we know if a chemical reaction absorbs or releases energy?” the teacher fills two petri dishes with vinegar, mounts the smartphone and the IR camera the same way as described in the previous examples, and starts the livestream by asking students to predict how the temperature within the petri dish will change when baking soda is added to vinegar.
When the teacher adds baking soda into one of the dishes, students will observe a drastic color change in the dish from yellow-orange to blue-purple on the thermal image, indicating a decrease in temperature (Figure 5). After the initial observation during the live experiment, students then use the recorded data to collect and analyze evidence, including thermal images, a graph of temperature versus time, and thermometer readings, to determine whether the reaction is exothermic or endothermic.
After observing a temperature change during a chemical reaction in this first experiment, the teacher can direct students to think about the reaction rate, which can be represented by how fast the temperature drops, and initiate a new guided inquiry by asking students what factors they think may speed up or slow down the reaction. Students may come up with reasonable guesses such as temperature or concentration, or they may suggest irrelevant factors such as volume. Note that all questions are worth exploring and enable science learning; the only limitation is the availability of class time.
The teacher can let students vote on the factor they want to explore the most. Assuming students vote for temperature, they now need to design an experiment that can answer the question, “How does temperature affect reaction rate?” The teacher can guide students through the experiment design process with a template provided in the student worksheet (see Online Connections) and explain key concepts such as independent variables, dependent variables, and controlled variables.
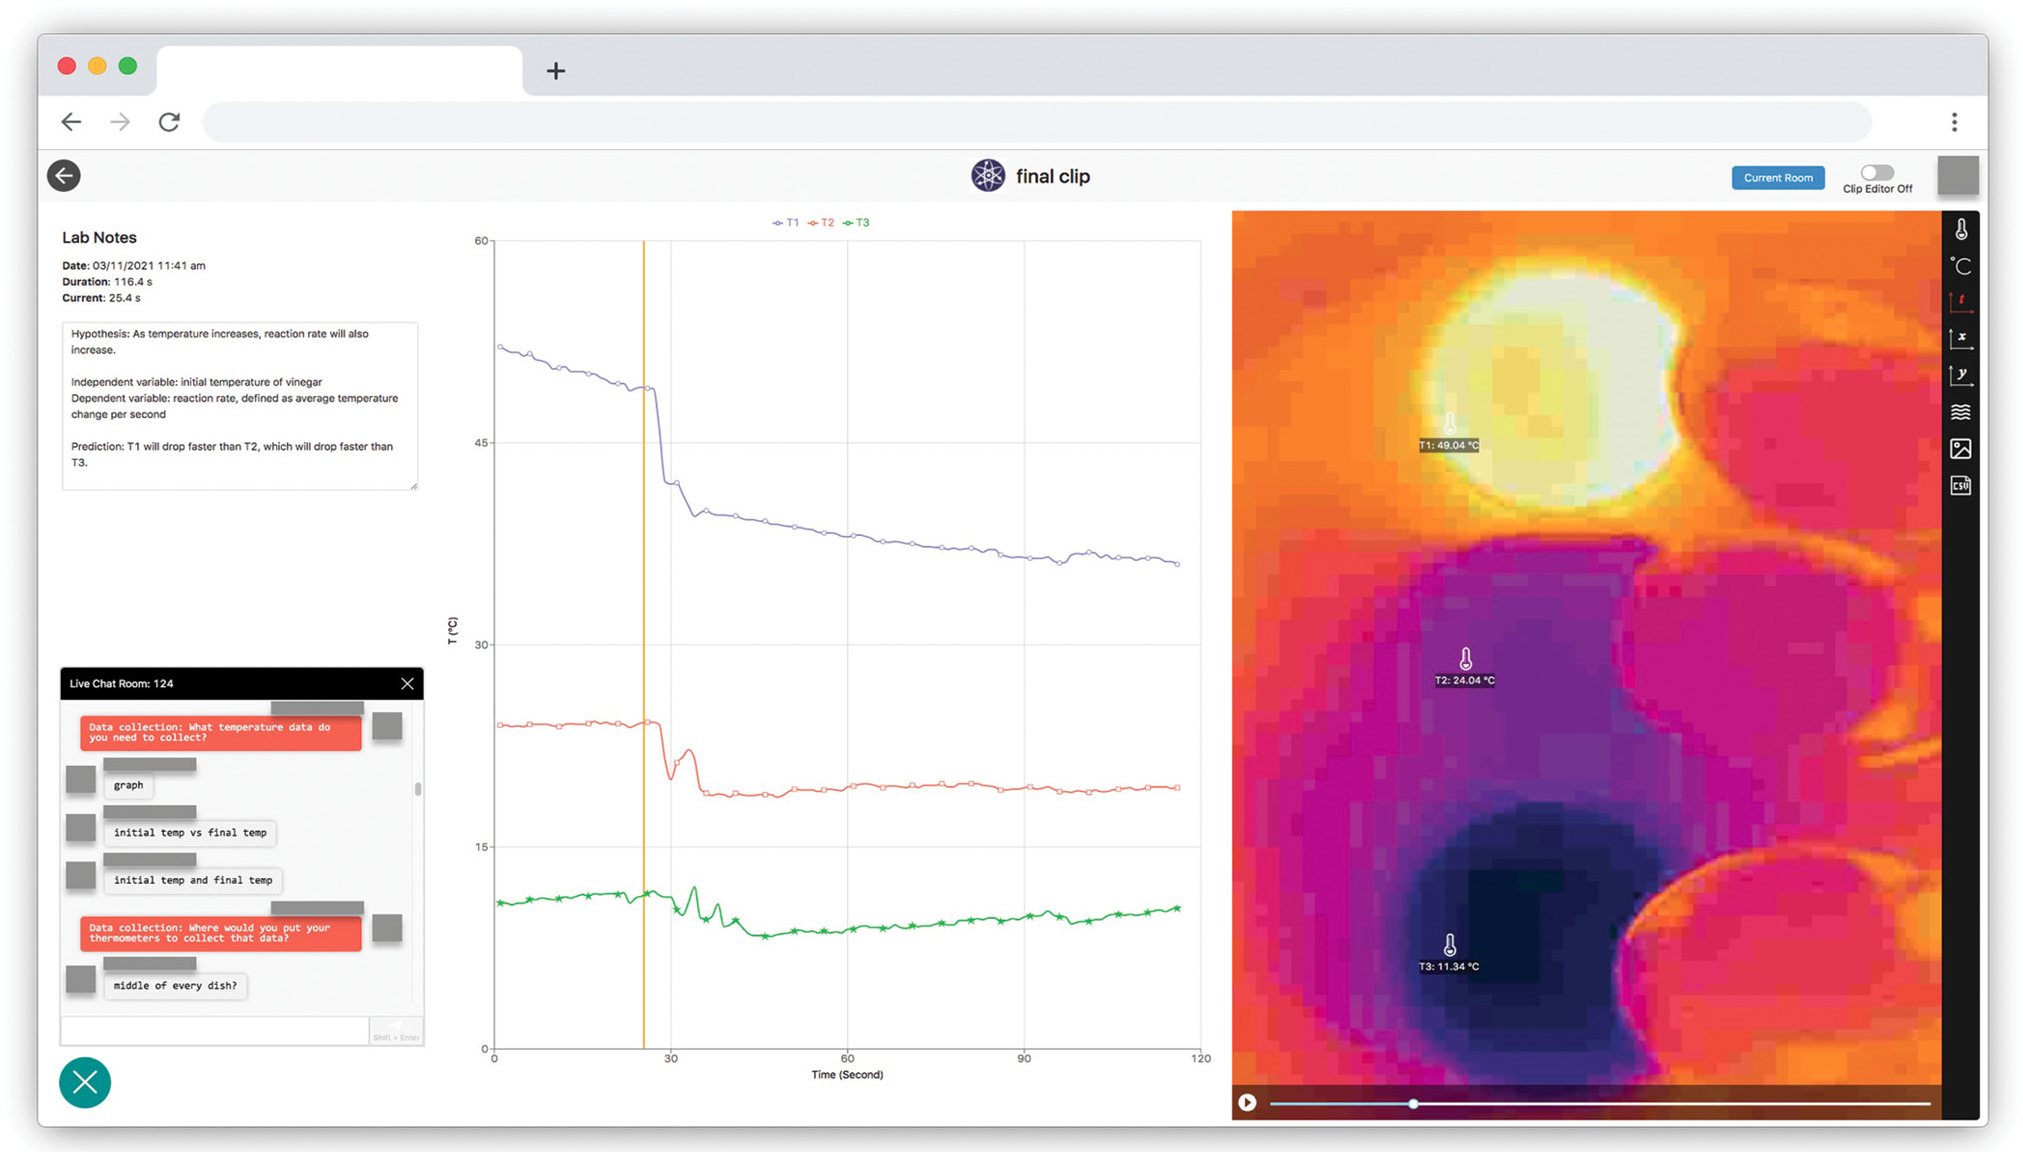
After students submit their experiment designs, the teacher can either provide feedback on their designs directly or assign peer feedback. Finally, the teacher selects the best experiment design to carry out for the students, considering criteria such as feasibility, robustness, and rationale of data collection. The rest of the inquiry cycle again follows the POE framework, where the teacher asks students to predict how different initial temperatures of vinegar will affect the degree of temperature drop once baking soda is added, observe the experiment, collect evidence from the recorded data using the built-in functions (including thermometers, graphs, and screenshots), and explain the relationship between temperature and reaction rate (Figure 6).
An additional advantage of remote inquiry is that teachers can tailor their instruction to the specific needs of their students. If students are unfamiliar with chemical reactions, the teacher can add a structured inquiry at the beginning to investigate the characteristics of a chemical reaction, before shifting the focus to energy change during a reaction. On the other hand, the teacher can also increase the challenge by appending more open-ended inquiries that allow students to explore additional factors that might affect the reaction rate.
Authentic Scientific Instruments for Deepening Remote Inquiry
Inquiry-based learning works best when the phenomena under investigation are familiar and relevant to the students, but students sometimes lack tools that can probe deeply into those phenomena. One such example is the question, “Why does metal feel colder than wood?” an everyday phenomenon that is difficult to explain because it involves the concept of thermal conductivity and is further complicated by the mechanism of how the human body perceives temperature.
A lab in a cash-strapped school may not have the proper equipment to measure and collect the data needed for this inquiry, but those underprivileged students can now use Telelab to investigate this question and dispel misconceptions around it.
In-Depth Inquiry:
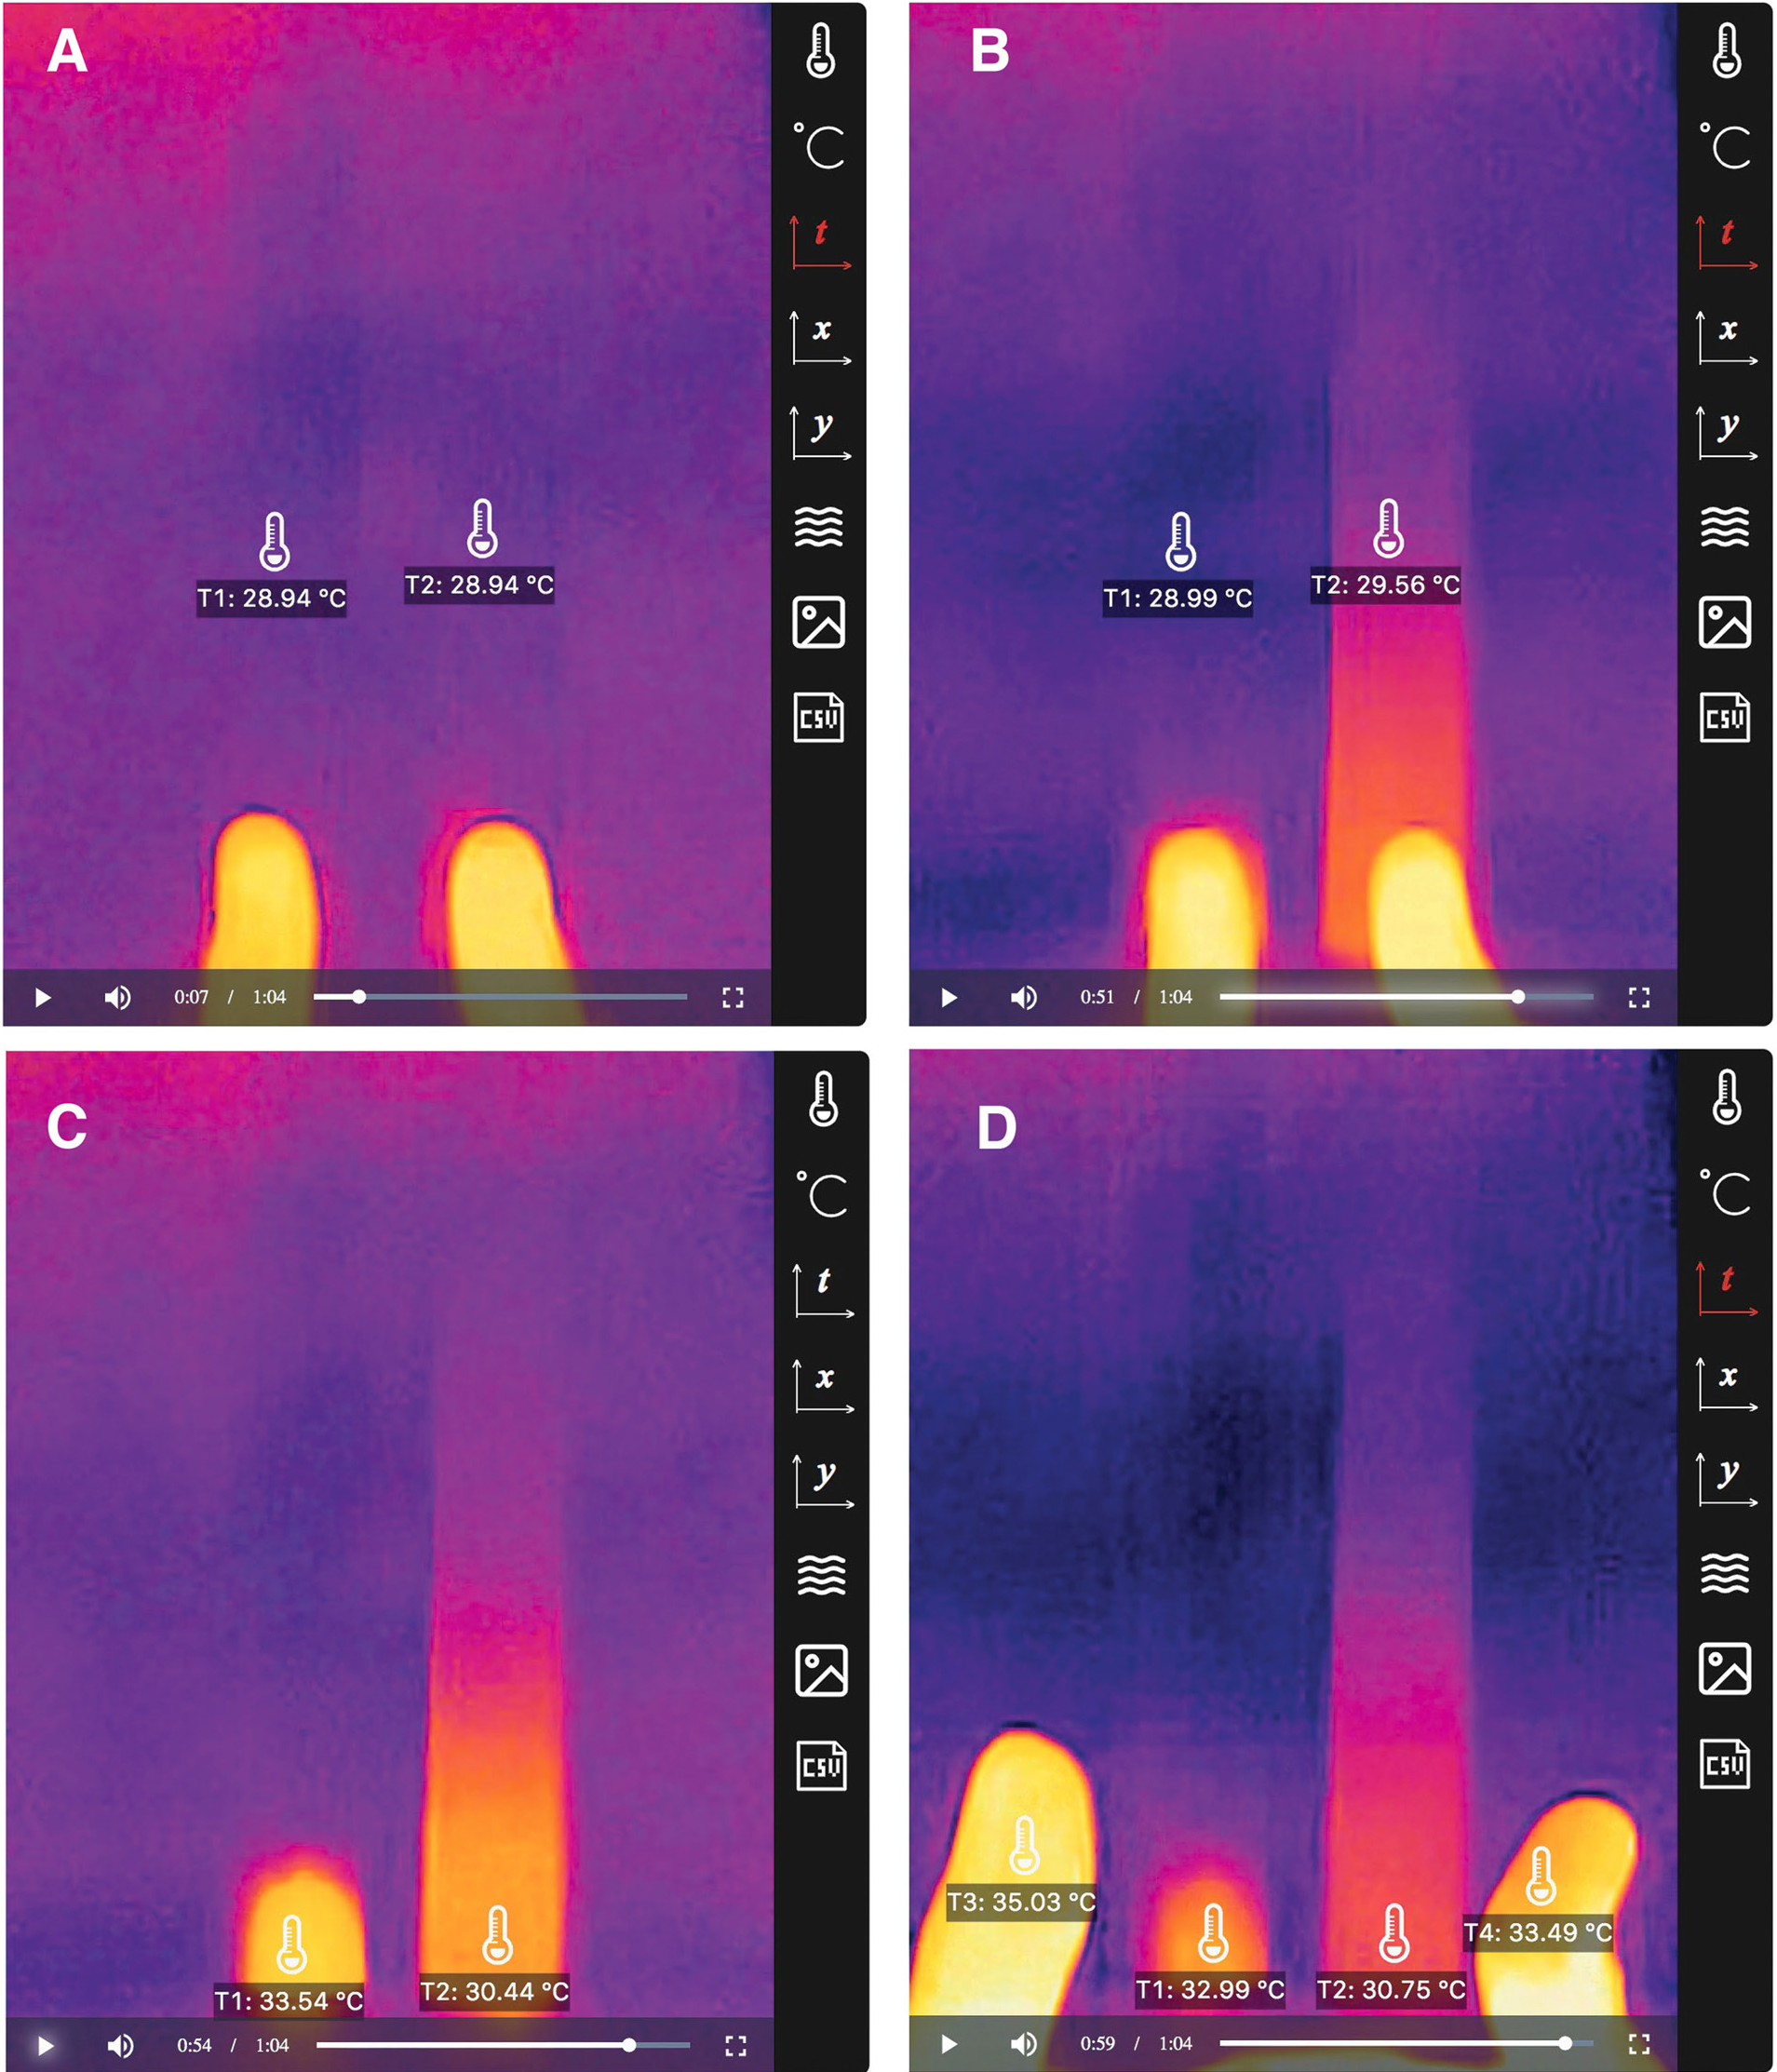
This investigation uses a variation of guided inquiry, where the experiment setup remains the same, but students iteratively collect more data. To set up, the teacher places two rulers (one wooden and one metallic) on a flat surface (ideally insulating, to minimize interference from the environment) and mount the smartphone and sensor directly above. The first inquiry cycle begins with the teacher probing the prior knowledge of students with the question: “What do you already know about thermal conduction?” Students predict which material is a better conductor, as well as the temperature along the rulers as the teacher initiates thermal conduction by pressing on the rulers with two thumbs. Thermal imaging will show heat traveling a longer distance through the metallic ruler than the wooden one.
After students conclude that metal is a better conductor, the teacher initiates a second inquiry cycle to connect this new knowledge to the original phenomenon of metal feeling colder by prompting students to collect more temperature data from the recording of the same experiment, with options including the thumbnails, the parts of the thumbs touching the rulers, and the parts of the rulers touching the thumbs (Figure 7). Thermal imaging will show heat dissipating faster along the metallic ruler and localizing at the contact area on the wooden ruler, as well as the thumb having a lower temperature after touching the metallic ruler (Figure 7). Through Telelab, students are able to capture evidence including instantaneous surface temperatures, which would have been difficult to measure without an IR camera, and use them to establish a chain of reasoning that leads them to the conclusion that the metal feels colder because metal absorbs heat from the thumb faster due to its higher conductivity.
Preliminary Results from Online Classes
Early teacher adopters of Telelab noted how remote labs 2.0 allowed students to explore experimental data and engage in scientific inquiry even in a remote learning context. In a teacher’s own words, “In real labs, I ask students to do free exploration before giving specific instructions on where to observe and what to analyze. Then we share, as a whole class, what we find. With Telelab, I can do the same thing. They can add thermometers anywhere and share what they find. Some focus on purple colors (cold) and some focus on red colors (hot). From their choices of places, they start to ask questions of why it happens as it shows.”
We also conducted a pilot test that involved 44 students in two online high school chemistry classes, using the baking soda and vinegar experiment as a testbed. Pre/post-tests showed an improvement in students’ conceptual understanding of chemical reactions after the Telelab intervention (Sung et al. 2021). When asked what they enjoyed the most about remote labs in exit surveys, students identified scientific instruments, social interactions, and live experiments as the three engaging factors. The following shows some selected quotes from the exit survey:
- “[The thermal cameras] gave us a nice visual representation of what was happening during the experiments.”
- “[I enjoyed] making observations and reflecting on my thoughts with the evidence gathered from the lab.”
- “I thought it was really cool that although we are all so far apart in distance, we were all able to participate in the live experiment together in real time.”
- “[What engaged me the most was] being able to interact and post our things/answers in the chat, as well as interacting with others and hearing what they think.”
- “I was engaged by the questions being asked. Especially when it was other students asking questions that I could follow along with as often it was the same questions I was thinking and therefore wanted to pay attention to.”
- “The experience of observing all the experiments live was quite fascinating.”
In addition to studying the effectiveness of remote labs 2.0 in comparison to their local counterparts, we are also expanding the types of sensors supported by Telelab, improving the user experience, and designing more lesson plans to help teachers adopt remote labs. Born as a response to the COVID-19 pandemic, Telelab has the potential to initiate a paradigm shift in terms of how science teachers everywhere can deliver lab experiences to their students, even beyond the pandemic: with topics and methods of their own choice; with data that is automatically collected and accessible to every student at any time, from anywhere; within an environment that fosters curiosity and exchange of ideas. ■
Acknowledgments
This work was supported by the National Science Foundation (NSF) under Grants 2054079 and 2131097. Any opinions, findings, and conclusions or recommendations expressed in this article are those of the authors and do not necessarily reflect the views of NSF.
Online Connections
Student worksheets, teacher guides (including answer keys), and a scoring rubric can be downloaded from http://intofuture.org/telelab.html.
Rundong Jiang (rundong@intofuture.org) is the Director of Curriculum and Instruction at the Institute for Future Intelligence (IFI) in Natick, MA. Chenglu Li (kabelee92@gmail.com) is a PhD student specializing in educational technology at the University of Florida in Gainesville, FL. Xudong Huang (xudong@intofuture.org) is a Learning Scientist at IFI. Shannon Sung (shannon@intofuture.org) is the Director of Assessment and Evaluation at IFI. Charles Xie (charles@intofuture.org) is the Founder and Chief Scientist at IFI.
Biology Chemistry Inquiry Instructional Materials Labs Lesson Plans NGSS Phenomena Physical Science Physics Science and Engineering Practices STEM Technology High School