
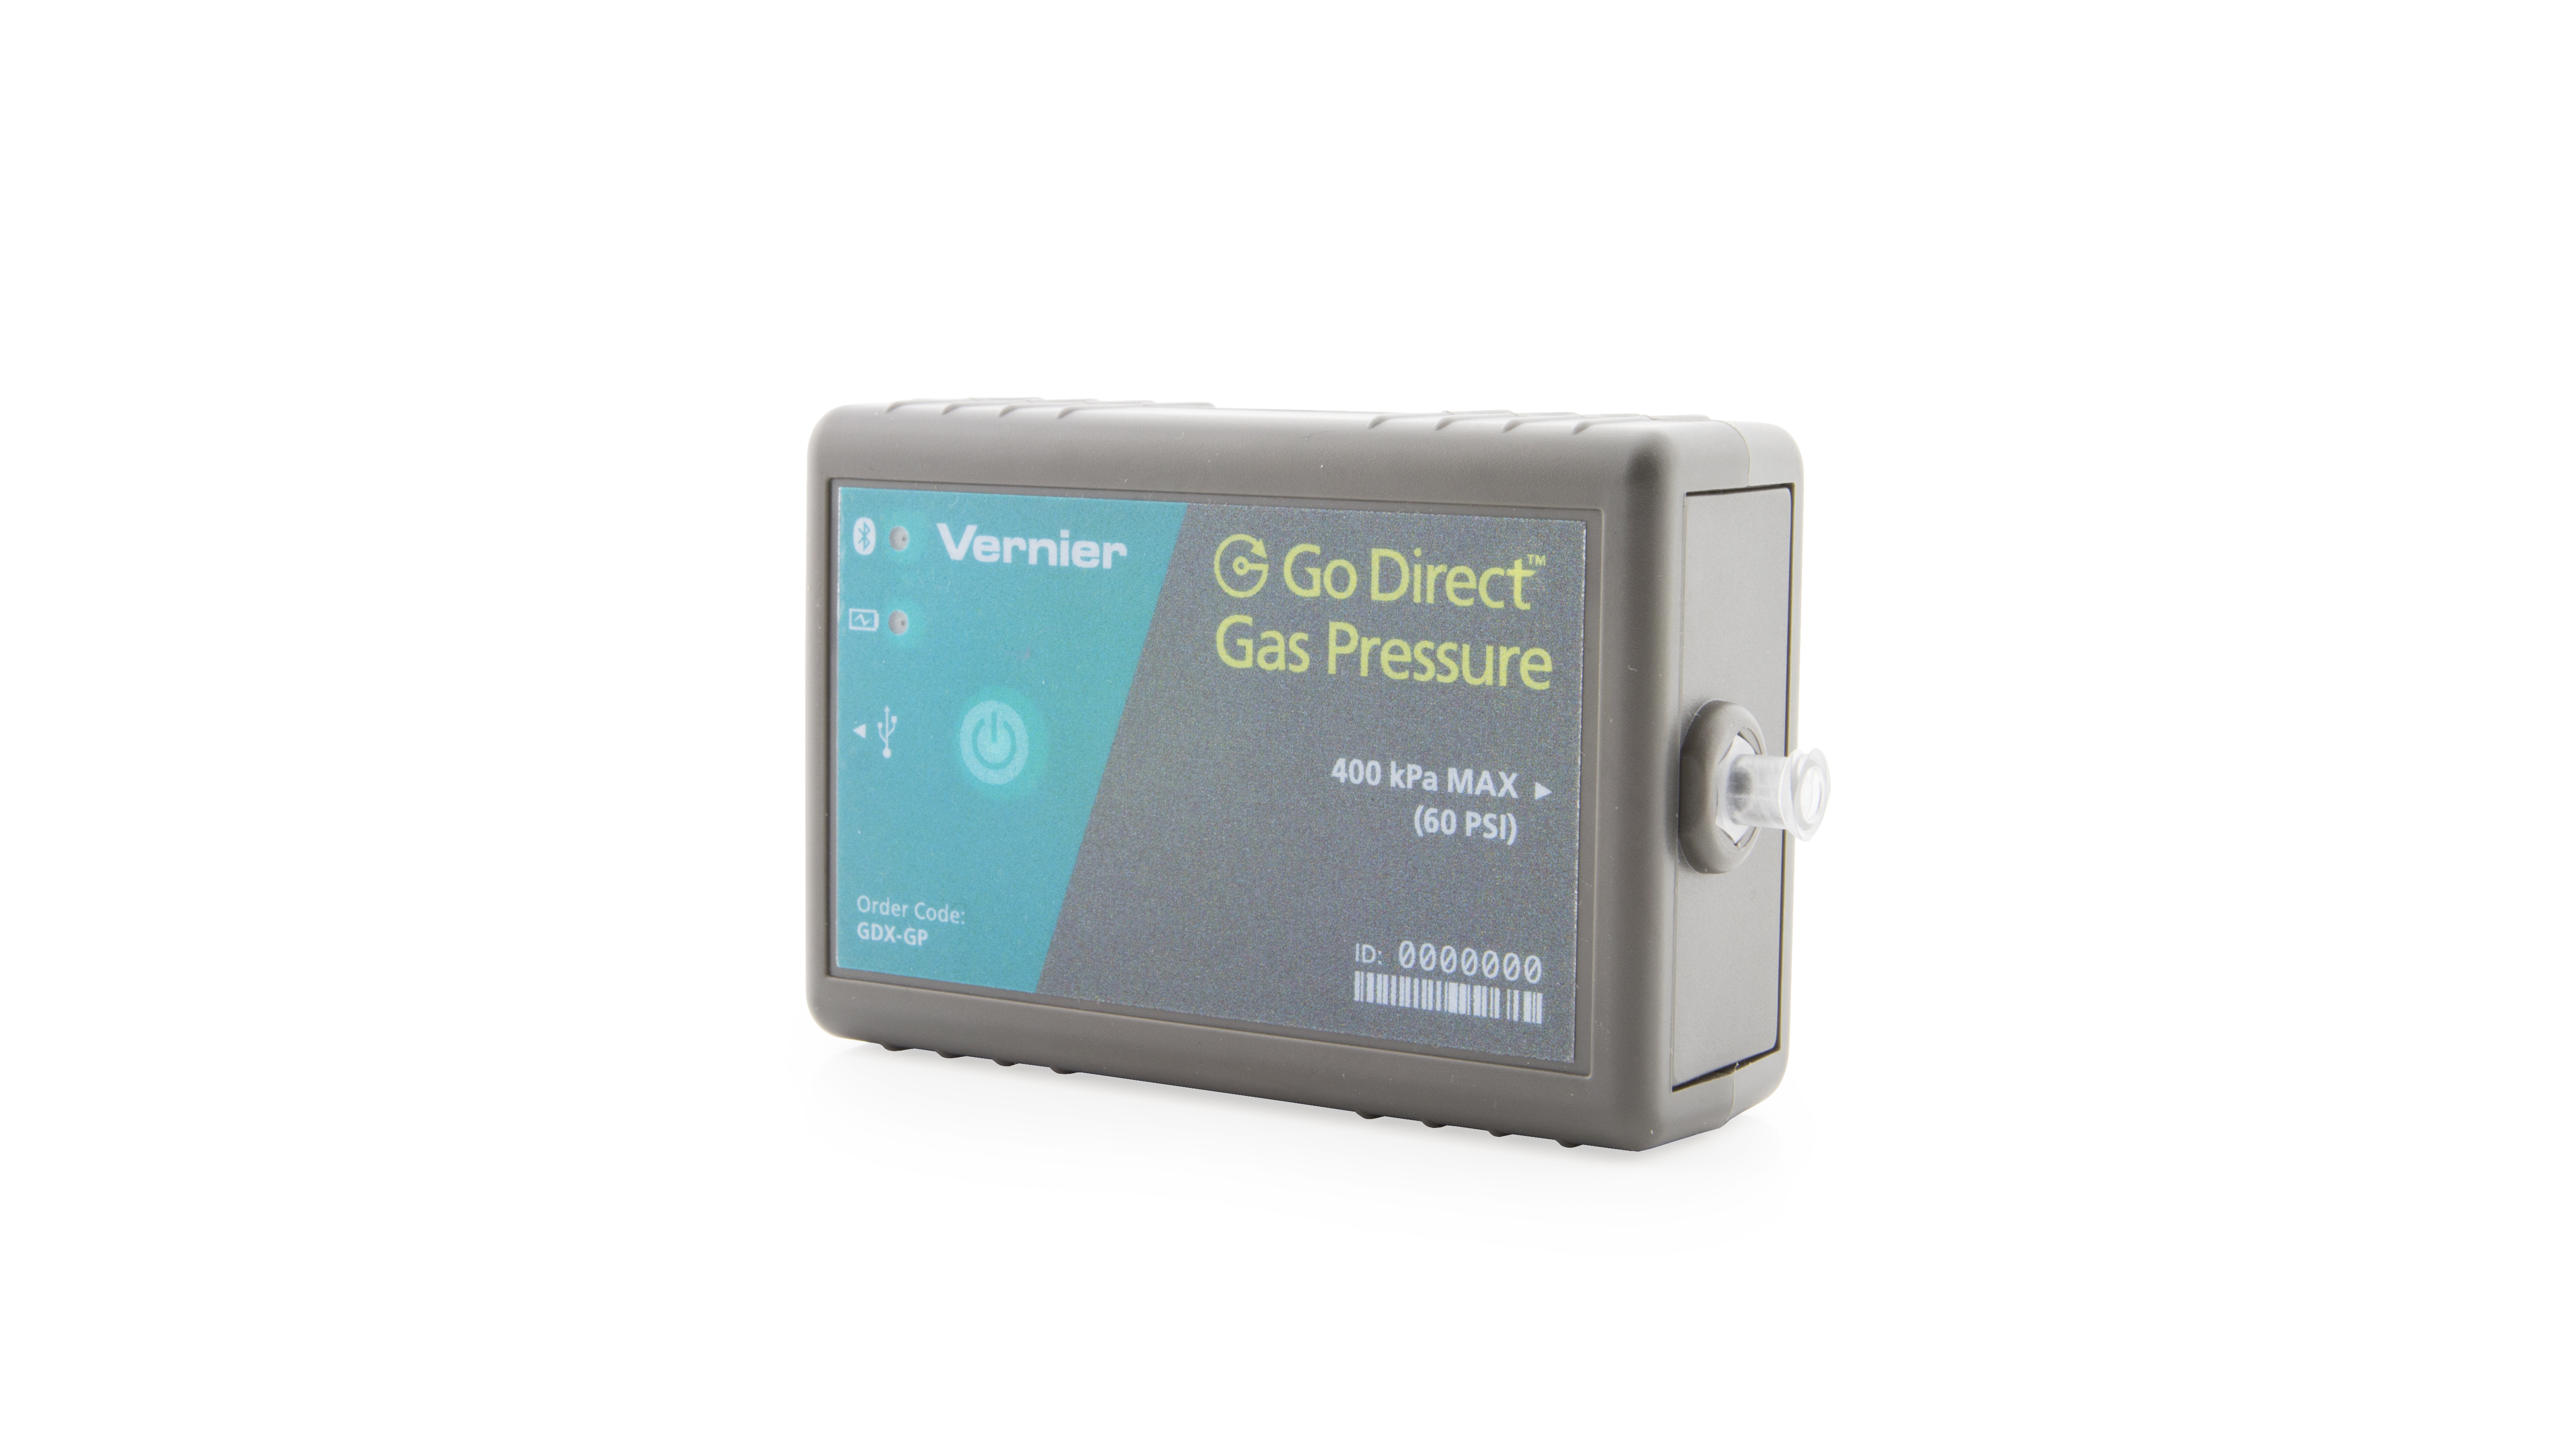
Go Direct® Gas Pressure Sensor
By Edwin P. Christmann
Posted on 2018-03-01
Introduction
The Go Direct Gas Pressure Sensor is used to monitor pressure changes during gas-law experiments. Subsequently, science teachers can use it for graphical analysis and integrate its use in both mathematics and science instruction. In addition, it comes with a free “Graphical Analysis™ 4 app,” which produces real-time graphs from experimental data and is very easy to use.
Once students have collected data, the software generates a variety of statistics that students can use for data analysis and include in their laboratory reports, e.g., central tendency, range, curve fits, etc. In addition the free “Graphical Analysis™ 4 app,” in combination with the supported hardware, makes it possible to use your mobile device for data collection with other Vernier sensors, e.g., temperature, motion, force, pH, etc.
What’s Included
• Go Direct Gas Pressure Sensor
• Two tapered valve connectors & No. 5 stopper
• One tapered valve inserted into No. 1 stopper
• One two way valve
• Two Luer-lock connected to either end of plastic tubing
• One 20 mL syringe
• Two tubing clamps
• Connecting USB cord
How it Works
The sensor has a flexible membrane that reacts when the pressure changes and is arranged to measure absolute pressure. One side of the membrane is vacuum-like and the other side is open to the atmosphere. Hence, a pressure change is detected and the sensor produces an output voltage that is transmitted to the “Graphical Analysis™ 4 app,” which results in a graphic. The following video shows how to set-up the device:
Video Link:
Key Features
1.Data Collection
• Collect data from multiple sensors simultaneously, either with a multiple-channel interface such as LabQuest Stream or by using multiple Go Direct sensors. Use Data Sharing to retrieve data from just about every Vernier sensor.
• Select time-based or event-based data collection, including events with entry.
• Adjust data-collection rate and duration as needed.
• Trigger time-based data collection on sensor values
• Calibrate sensors, although most of the time this is not needed.
• Enter data manually or using the clipboard.
• Change display units on many sensors.
2. Data Analysis
• Display one, two, or three graphs as needed.
• Set the graph scale.
• Select what is graphed on each axis, and select line or point style graphs.
• Calculate descriptive statistics your data.
• Fit lines and curves to some or all of your data.
• Define calculated columns based on sensor columns.
• View data in a table.
• Highlight and read values from a graph.
• Interpolate and extrapolate using graphed data.
3. Data Sharing
• Receive data shared from Lab Quest or a computer running Logger Pro.
4. Data Storage
• Store and retrieve previously shared data collection and analysis sessions.
Screenshot Examples:
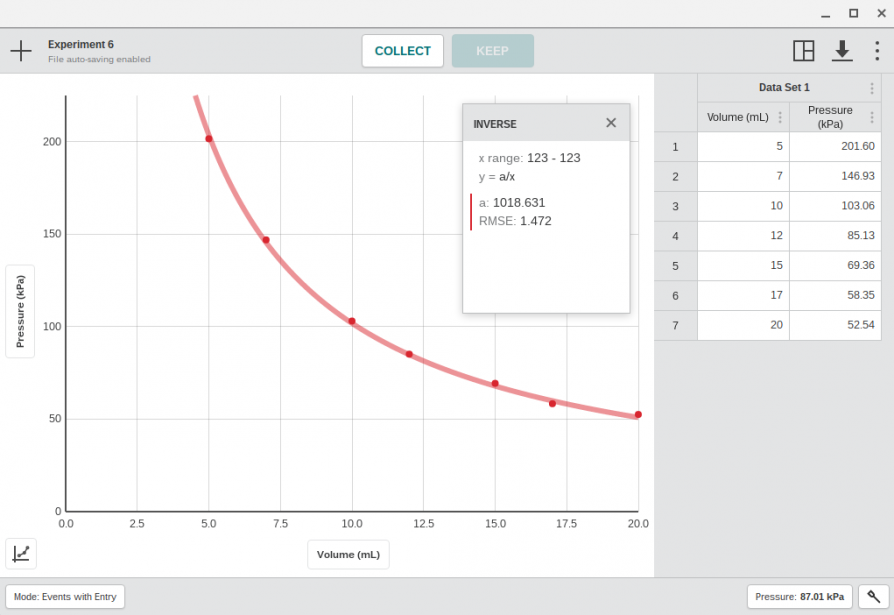
Choose from standard curve fit equations to analyze experimental data. Example: Boyle’s Law
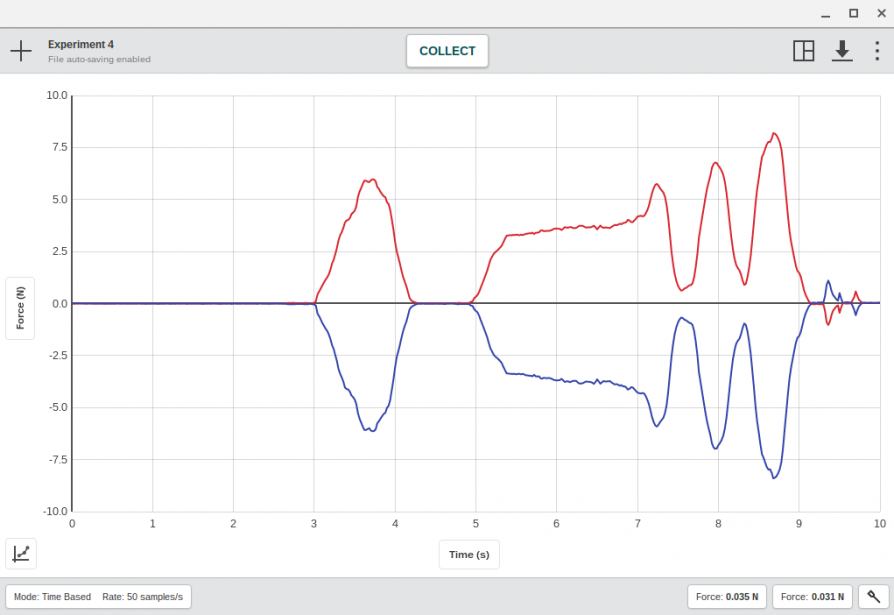
Collect data from multiple sensors simultaneously using two force sensors. Example: Newton’s third law.
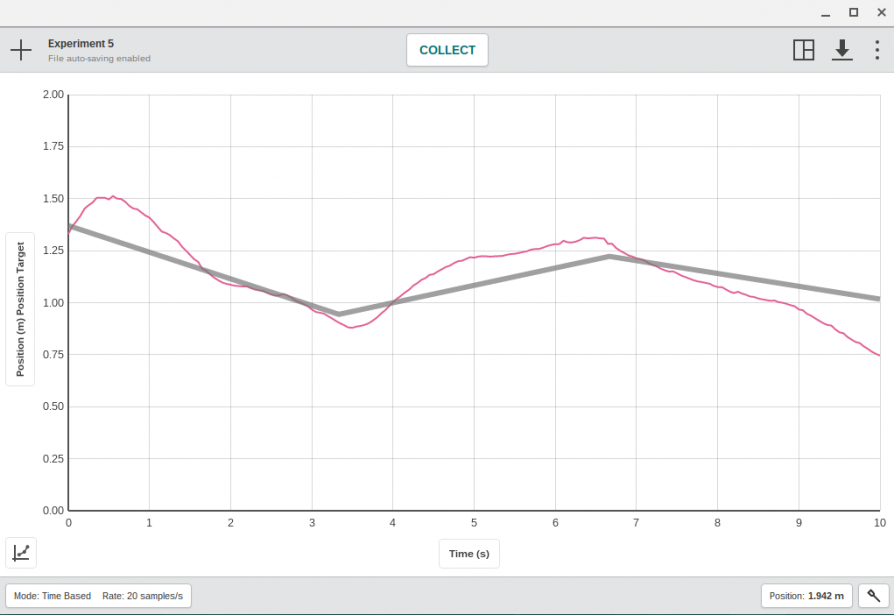
Perform graph math exercises with a motion detector
Requirements for software download
• Windows
Computer running Windows 7 or Windows 10. Only Windows 10 computers with compatible Bluetooth® radios will support Bluetooth connections.
• Mac OS
Computer running Mac OS, USB and Bluetooth.
• Chromebook
Chromebook running Chrome OS 53 or newer. USB and Bluetooth.
• iOS Devices
iOS 9 or newer
iPad (4th generation or newer), iPad mini, iPad Air, and iPad Pro
iPhone (5th or newer)
iPod touch (5th generation or newer)
• Android Devices
Android 4.3 or newer
Tablets: Nexus 7, Nexus 10
Phones: Nexus 5, Samsung Galaxy series, Android devices running 4.1–4.2.2 can download Graphical Analysis v1.2 from Google Play.
The Android version of Graphical Analysis 4 will be available in the first quarter of 2018 with updated system requirements.
Summary
After reviewing the Go Direct® Gas Pressure Sensor, we found it to be a user-friendly device that is an excellent fit for scientific investigations and data collection in both middle-level and secondary classrooms. At $89.00, its cost is reasonable and coupled with the free data analysis software, it is a technology application that we think will enhance scientific inquiry in any science classroom. Undoubtedly, Vernier has a great reputation in the science education community and the Go Direct® Gas Pressure Sensor is another fine example of how Vernier’s excellent products are high quality and help make learning interesting and meaningful for science students!
Cost: $89.00
Edwin P. Christmann is a professor and chairman of the secondary education department and graduate coordinator of the mathematics and science teaching program at Slippery Rock University in Slippery Rock, Pennsylvania. Caitlin Baxter is a graduate student in the mathematics and science teaching program at Slippery Rock University in Slippery Rock, Pennsylvania.
Disclaimer: The views expressed in this blog post are those of the author(s) and do not necessarily reflect the official position of the National Science Teaching Association (NSTA).