
Music visualization
By Mary Bigelow
Posted on 2013-05-30
 From reading various tweets and blogs, I often find interesting projects and applications. Some are definitely related to science and math, while others have more of a tangential application. I recently found one of the latter (and it’s pretty cool).
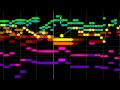
On the Open Culture site, there was a posting about music visualization, specifically one of Bach’s Brandenberg Concertos. This features the work of Steven Malinowski in translating musical sounds into graphics. As you play the music, shapes and colors move across the screen to illustrate the notes.
Although one could follow the notes in a score or a piece of sheet music (assuming one can read music), this is a different experience. I can read music and I’ve played a lot of Bach’s organ music, but seeing colors for each instrument or voice is fascinating. The patterns, intricacies, tempo, and overlaps are more evident. There is a link to a YouTube page with even more of these visualizations from other composers.
My colleague and I often played classical music in the background as students worked on projects. The first day we tried this, a student closed his eyes and said “Ahhhh…Mozart.” This was a student we would never have suspected as knowing much about classical music! My colleague loved opera, but we found (with student feedback) that students preferred instrumental music (“The words confuse our thinking.”) I’m wondering how these visualizations might be used to calm down or transition at the beginning of class or as a demonstration of patterns? Or just for fun?
Disclaimer: The views expressed in this blog post are those of the author(s) and do not necessarily reflect the official position of the National Science Teaching Association (NSTA).