
The Pasco Wireless Dissolved Oxygen Probe VS. Winter Water
By Martin Horejsi
Posted on 2015-01-12
The power of a Bluetooth-connected Dissolved Oxygen probe is not only from the DO data, but the places the data can be collected, and the ways the data is presented. Over the holidays I took the Pasco wireless DO probe up in the mountains to generate some data and answer some questions. Since my winter/spring lesson plans will address the use of the probe outdoors, I needed to be more than a little familiar with it, and ensure that any limits or barriers of the technology were of my choosing or creation.
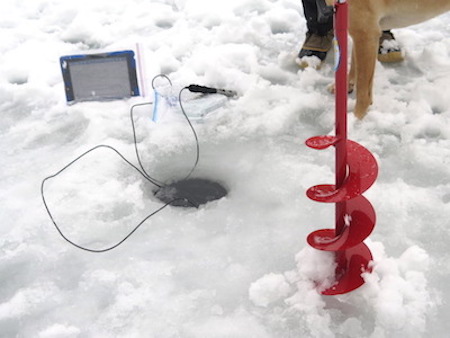
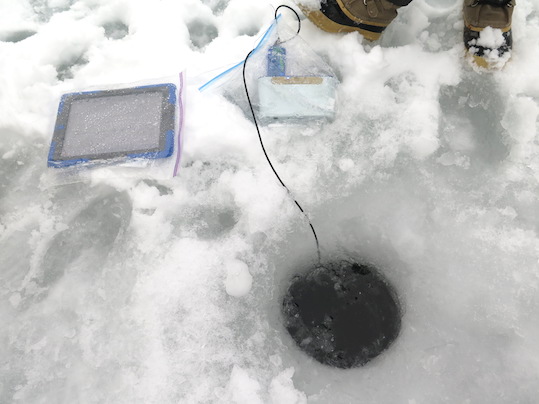
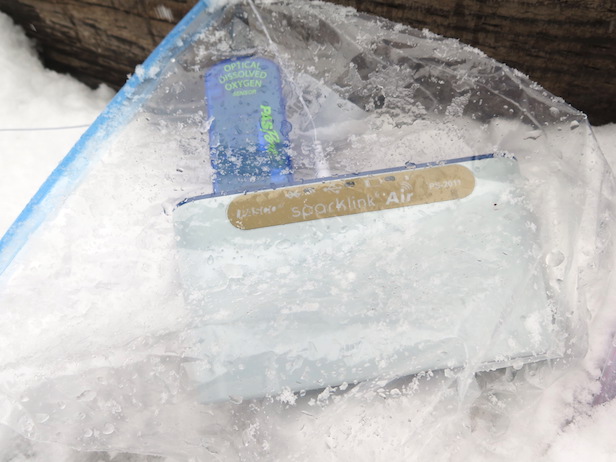
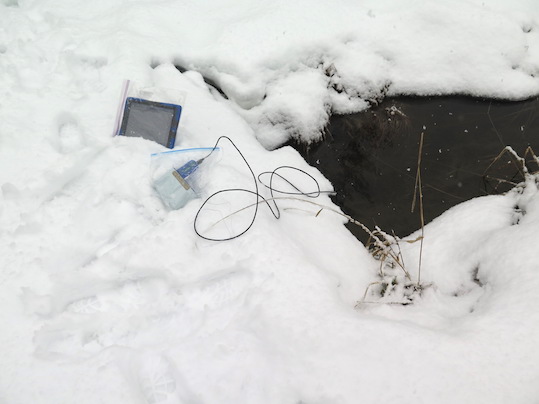
Three sites were chosen in which to measure the DO; a ice-covered pond, a small creek, and a rushing mountain stream. The DO probe connected to a Bluetooth transmitter called a SPARKlink Air to my iPad Air protected by both a UZBL Shockwave case and a Ziploc® bag.
Needless to say, the DO Probe, the Bluetooth basestation, and the iPad worked flawlessly. The biggest hurdle was simply trying to view the iPad screen though a soggy plastic bag and against the glare of a snow-covered landscape.
The durability of the Pasco DO probe was obvious, and while I don’t recommend any abuse, I do encourage data collectors to push the envelope.
As you can see in the pictures, the weather was a bit of a challenge, but nothing that a pair of Ziploc® bags couldn’t fix. I’ve used the iPad in temperatures so low that only a few minutes of touch-display would work before the iPad had to be warmed up again before responding to a fingertip. Battery life was not a problem, but it was definitely less than under optimum conditions according to the battery-life indicators.
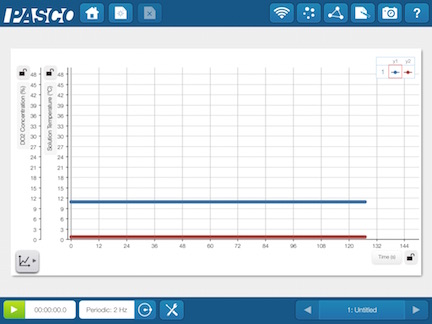
The Pasco DO Probe was lowered half-meter by half-meter with pauses at each interval until it reached its full 3m length.
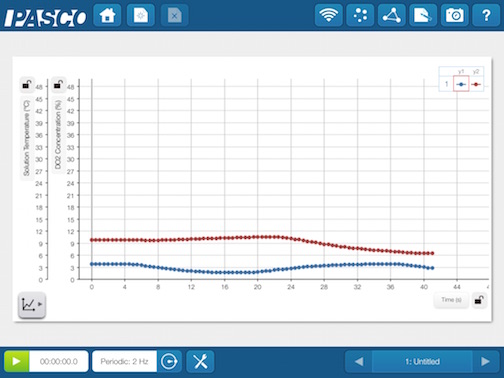
The data from the pond shows changes in both DO and Temp during the probes decent. The probe was paused for about five seconds every half-meter. The inverse relationship between DO and Temp is clearly presented in the graph, and occurred at approximately the middle depth of the pond which from summer measurements is slightly less than 3m deep. A joy in data such as this is found in the inspection of either DO or Temp across depth in isolation, and in relation to each other across depth.
A plastic bag stopped the snow, but not the Bluetooth radio signal from the Pasco SPARKlink Air. I intended to use both Bluetooth ports to collect windspeed as well, but the heavy snowfall changed my plans.
The next stop was a slow-moving creek wandering though a snow-covered meadow.
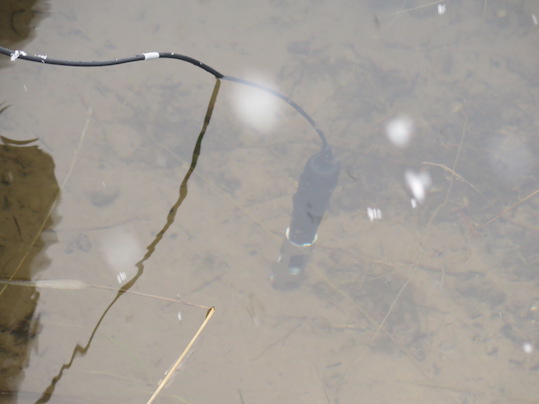
The probe sat on the bottom of the creek for the entire data collection. The steel cover-weight made positioning and stabilizing the probe underwater much easier. Ice chunks are visible in the flow visually documenting the water temperature.
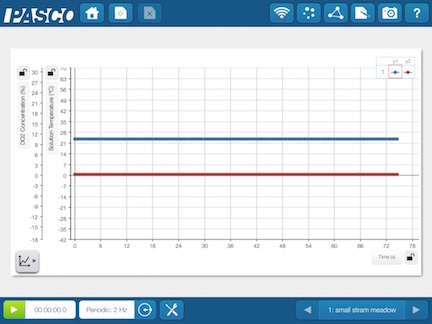
The data shows a stable temperature just above 0 degrees C as well as a healthy DO level.
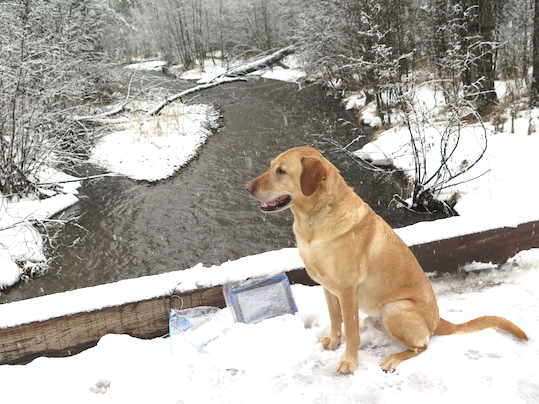
A bridge above a small stream provided an excellent basecamp to collect DO measurements in the center of the flow. The 3m cable length was just enough to reach the water. The beefy UZBL case provided plenty of grip even while wearing gloves to make working ten feet above the water of less concern then slipping around in my own boots.
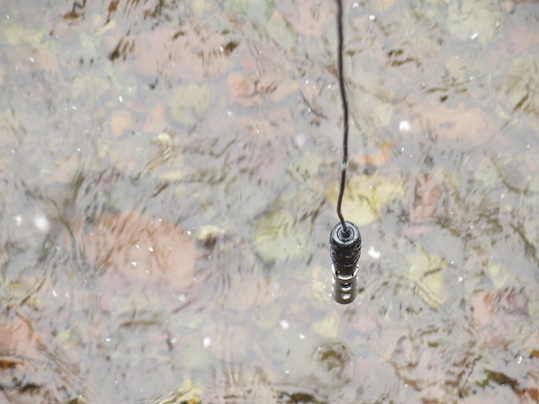
The Pasco DO probe was lowered into the flow, but because of the current, the probe remained near the surface just as a fishing lure approaches the surface when in motion.
The river DO data was very similar to the meadow numbers, but with a slightly higher temperature and a surprisingly lower DO concentration.
The slow moving meadow water often had chunks of ice in it testifying to its transitional temperature where water straddles two of its physical states.
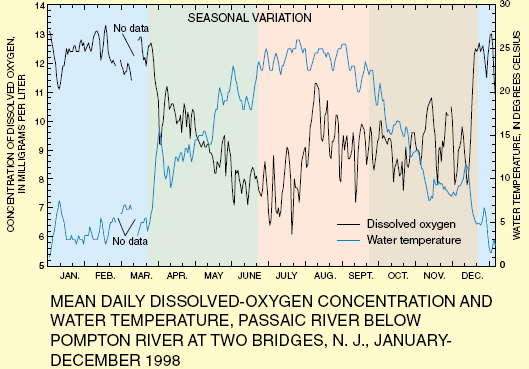
Using a DO/Temp graph provided by USGS Water Quality website, it is clear that the data collected was well within expectations based on water type and seasonal temperature.
Disclaimer: The views expressed in this blog post are those of the author(s) and do not necessarily reflect the official position of the National Science Teaching Association (NSTA).