
PASCO Wireless Pressure Sensor
By Edwin P. Christmann
Posted on 2019-04-25
Introduction:
The PASCO Wireless Pressure sensor is easy to use and connects via Bluetooth to the user’s cell phone or to another electronic device, e.g., IPad. The sensor has a range of 0-400 kilopascals (kPa)- with its most accurate reported measurements reported over 20 kPa. Prior to using the sensor, users must charge it with a micro USB charging cable. Subsequently, the micro USB end of the cable is inserted into the sensor and the USB end of the cable is inserted into a USB port (e.g., the USB port of a computer) for approximately 3 hours. According to the website description of the product (which can be found at https://www.pasco.com/prodCatalog/PS/PS-3203_wireless-pressure-sensor/index.cfm ) the battery has an expected life of approximately 3-4 months with normal use after a full charge and the LED light blinks red to indicate to users that the battery is charging.
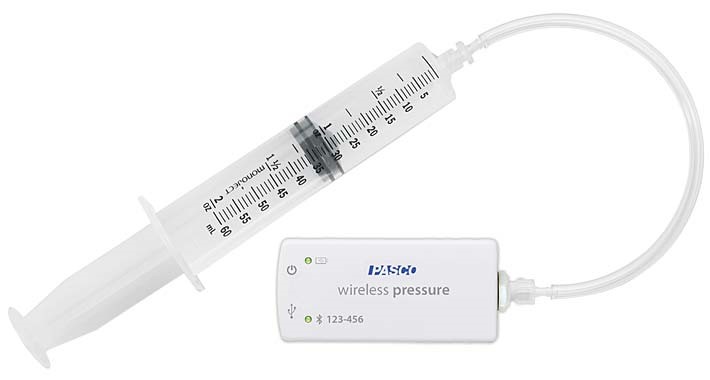
Image 1: A picture of the PASCO Wireless Pressure sensor.
Once the battery is fully charged, via a Bluetooth connection, users can open SPARKvue or PASCO Capstone to connect their device to the sensor. In order to connect the sensor via Bluetooth, users must first launch the PASCO data collection software, i.e, SPARKvue or PASCO Capstone. We selected SPARKvue which is compatible with Mac, Windows, iOS, Android, and Chromebooks. However, PASCO Capstone is compatible with Mac or Windows and is also easy to use.
Once the the PASCO data collection software is ready, users select the Bluetooth icon, and then select the device from the “Wireless Devices” list that matches the Device ID number on the bottom left portion of their sensor. The Bluetooth LED light blinks green to indicate that the device is connected via Bluetooth and can begin data collection!
Users then choose the “Start New Experiment” option, which has a two options: 1) build a new experiment or 2) open a saved experiment (see Image 2). We chose to open a PASCO experiment which is shown below in Image 3.
The experiment that we used came from the Essential Chemistry section, which is taken from the list of experiments shown in Image 4, i.e., 12B- Boyles Law, which is one of PASCO’s Essential Chemistry Investigations. Once users click on an experiment, a blank graph and table appears for users follow along with the instructions to complete a lab handout for data collection (see Image 5). The data appears in the table and is exported into a graph after data collection. Multiple runs of data can be collected, which is commensurate with the computation of descriptive statistics and inferences (see Image 6).
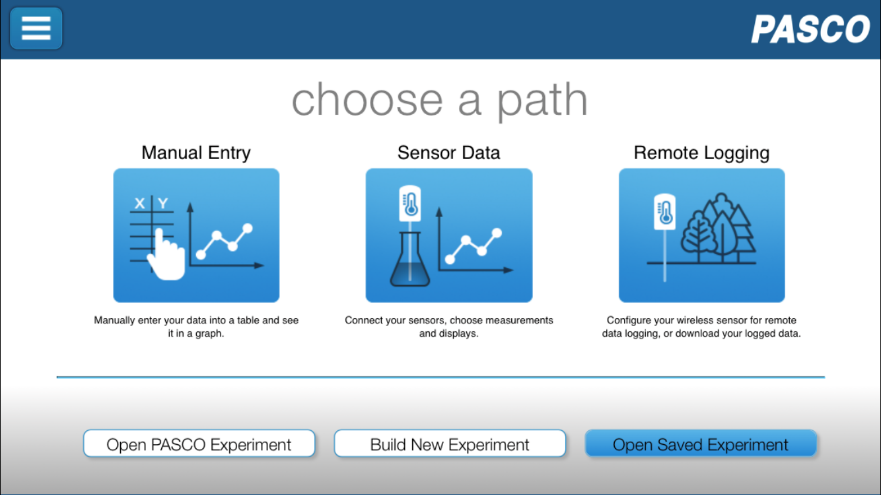
Image 2: A picture of the screen users see where they are prompted to select how they wish to continue their data collection.
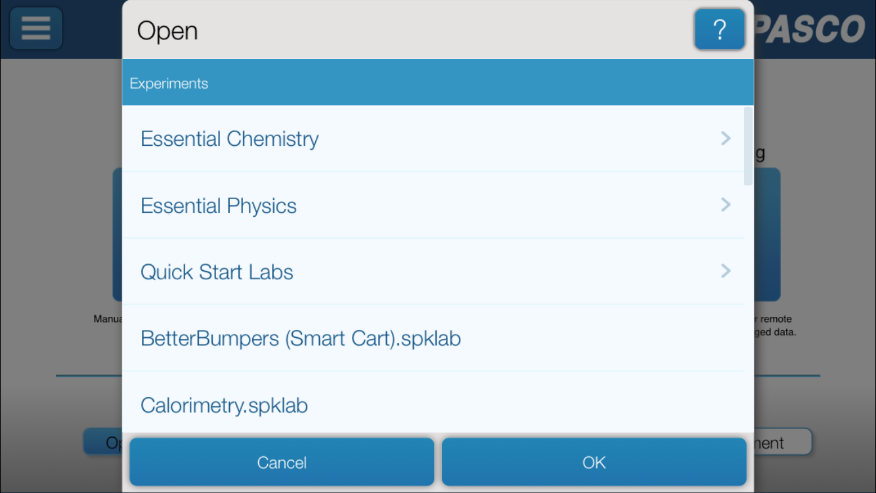
Image 3: A picture of some of the subject choices users are provided with if they choose to open a PASCO experiment.
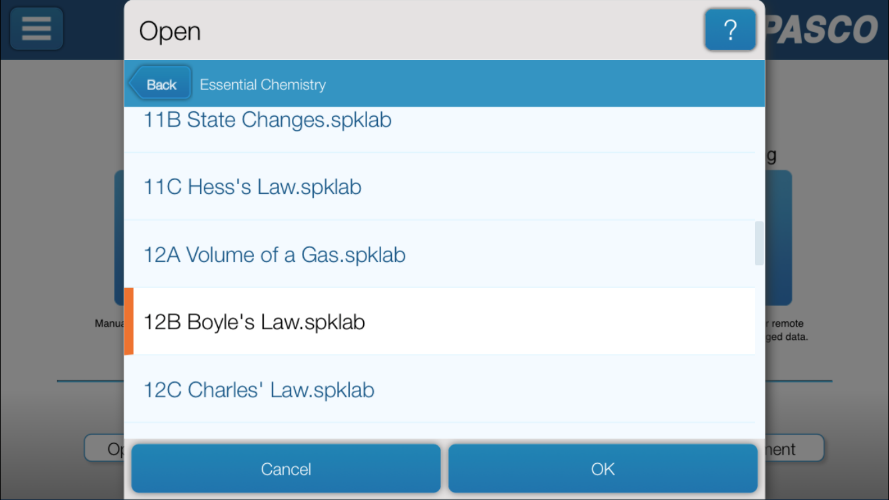
Image 4: A picture of some of the experiment choices in the Essential Chemistry category. Experiment 12B: Boyles Law is highlighted as this is the experiment we used to test the sensor.
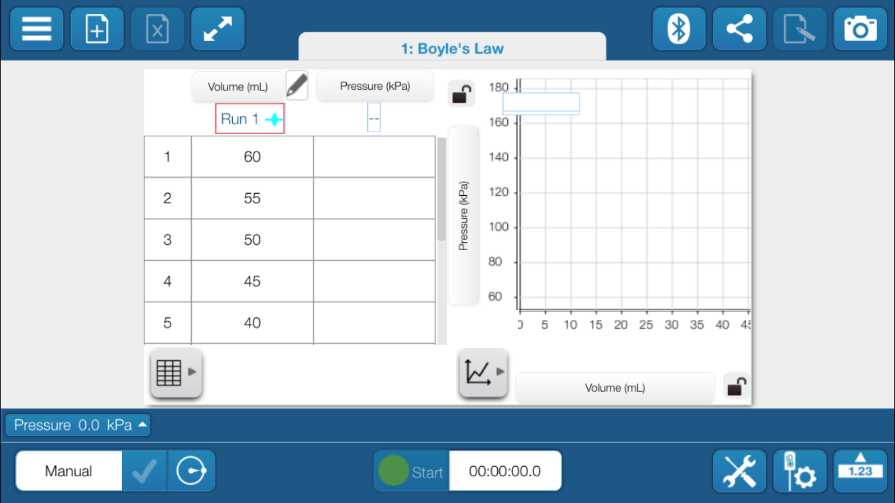
Image 5: A picture of the empty graph users see when they first open the Boyle’s Law experiment.
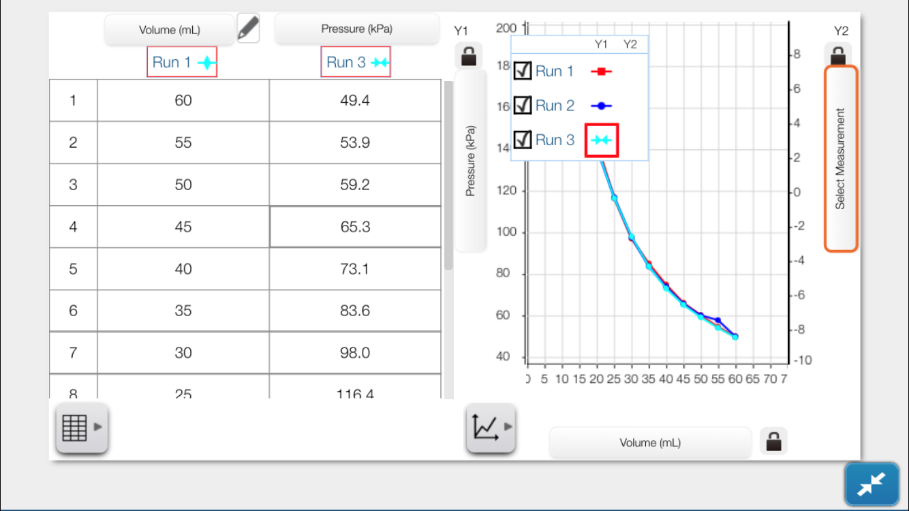
Image 6: A picture of the completed data table and graph. The graph has the data from three different runs displayed so the data can be compared. Users can switch the data displayed in the table to be from Run 1, 2, or 3 by clicking on the boxes at the top left of the screen.
Classroom Use:
This device could be useful in science subjects such as chemistry and physics. For more information, visit the website description of this product (found at https://www.pasco.com/prodCatalog/PS/PS-3203_wireless-pressure-sensor/index.cfm). You will find examples of experiments and teacher guides that can be used in a variety of science courses. Resources are available for purchase and free experiments are available under the Training and Resources.
There are a multitude of different topics science teachers can use this sensor for. The pressure sensor could be used directly to verify Boyle’s Law. Hence, students can see the way that pressure and volume interact in a closed system. With the addition of a temperature sensor that was placed in an ice bath and then into boiling water, the sensor can be used to plot changes in pressure and volume for various scenarios including: constant pressure, volume, or temperature, and also for adiabatic scenarios. As a result, students can see the effects of manipulating variables and can see the physical and graphical representations of how heat engine at work in real time.
****************************
Mechanically, the sensor could be used with varying tubes/types of syringes to observe hydraulics and how we can use hydraulics to lift a car or break rock with heavy equipment. This extension would involve employing the various connectors and different diameter hoses. The science teacher is positioned to set up a sort of balance (scales of balance) to observe how a small amount of weight can lift a large amount of weight by varying the cross sectional area and thus changing the force to keep a constant pressure.
Students can use the sensor with the syringe and flat surface as a type of scale for measuring the weight of an object. The science teacher could have several of these scales denoted around the classroom to provide different stations where something new should be found at each. For example, one station might tell the students what the area is, and they will have to measure the weight of an object by multiplying the pressure and the respective area. Afterwards, students would place the object on the makeshift scale. Other stations may tell the students the weight of objects and ask for the area of the tube below the flat part of the scale. All these little experiments would culminate in students understanding the relationship between pressure, force, and area (P=F/A).
The syringe could be set up at the end of a cart track and students can try to design a cart to hit the syringe with as minimal forces as possible. This can be conceived through the car safety crash test dummies, or the ever-popular egg drop experiments in which students try to drop an egg without breaking it by building shock absorbing mechanisms and the like. The sensor would provide students a graphical image of the pressures that are involved during the collision (and therefore the forces) to determine which group had the “safest” cart.
Anything related to pressure can probably be rigged up with the device and some modifications to suit the need. But there are tons of applications with weather, fluid dynamics (e.g. Bernoulli’s Principle and how the pressure changes relative to the velocity of flow), ideal gases, engine heat cycles, hydraulics, and the physical definition of pressure as P=F/A.
A possible chemistry application utilizing this probe signals a classroom experience where students infer temperature and thus exothermic vs endothermic reactions. Many reactions will change the speed that they occur when they are in different pressure environments, and some reactions change the pressure of their surroundings when they are in a closed system. While other gauges (such as a temperature probe in this particular case), the extra step involved of manipulating a variable that at first glance appears to students to be completely unrelated will reinforce learning outcomes and meaning-making forged in critical thinking. (e.g. NGSS HS-PS1-4)
Specifications:
– Range
o 0-400 kPa (values under 20 kPa may not be reliable or accurate)
– Resolution
o 0.1 kPa
– Accuracy
o +/- 1 kPa
– Max Sample Rate
o 1000 samples per second via BLE or USB connection
– Battery
o Rechargeable Lithium-Polymer
o 3-4 month expected battery life per charge with normal use
– Logging
o Yes
– Connectivity
o Direct USB or via Bluetooth Smart (Bluetooth 4.0)
– Max Wireless Range
o 30 meters (unobstructed)
What’s Included:
– Pressure sensor
– 0.6 m of polyurethane tubing
– Double barbed tube connector
– Male barbed Luer lock connector (2)
– Female barbed Luer lock connector
– 60 cc syringe
– USB cable (for recharging and optional direct connection)
Cost:
$69 per device
Edwin P. Christmann is a professor and chairman of the secondary education department and graduate coordinator of the mathematics and science teaching program at Slippery Rock University in Slippery Rock, Pennsylvania. Emily Ferraro is a graduate student in the mathematics and science teaching program at Slippery Rock University in Slippery Rock, Pennsylvania.
Disclaimer: The views expressed in this blog post are those of the author(s) and do not necessarily reflect the official position of the National Science Teaching Association (NSTA).