
Next Gen Navigator
Storylines Allow Students to Own Their Learning
By Scott Goldthorp and Lauren Pasanek
Posted on 2020-03-24
“I don’t think this data tells us enough; we only know the temperature close to the ground,” Andy* told his peers. “Hail forms in the clouds. We need to know what the temperature is in the clouds.”
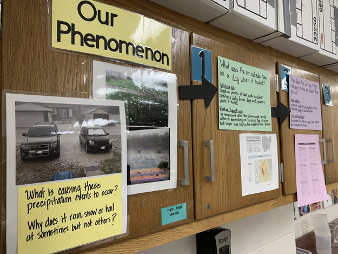
The students had just finished several days of analyzing photos of hail and weather station data from various hailstorms across the country and were deciding what to do next. We had a long list of ideas to investigate, and a Driving Question Board (DQB) filled with student questions about hail, storms, seasons, and weather conditions.
This is what it’s like teaching science with storylines: in this case, the OpenSciEd weather (6.3 Weather, Climate, & Water Cycling) storyline. A storyline is a coherent sequence of lessons driven by students’ need to make sense of a puzzling or intriguing phenomenon.
As part of this weather storyline, students first watched videos of crazy hailstorms, recording their “noticings” and “wonderings” to share with their peers. Students then developed initial models to try to explain what was causing these precipitation events to occur. After discussing our ideas as a class, we built a class consensus model to make our thinking visible and develop questions to investigate. We use our DQB and class consensus model to identify possible investigations that will produce the evidence we need to explain the phenomenon or solve a problem. It also helps us see how much we’ve figured out, providing a powerful visual to document and reflect upon our learning.
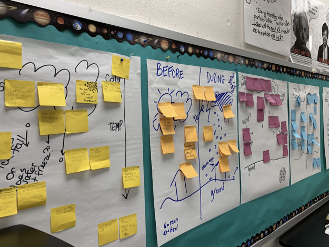
Student initial consensus models and DQBs
When teaching with storylines, students are driving the learning.
After this discussion about hailstorm data, students had a clear plan of what they wanted to do next: Consider the temperature of clouds high in the sky. So we used weather balloon data to investigate temperature at different heights in the atmosphere. We figured out the temperature decreased as the altitude increased up to 35,000 feet.
However, one student, Josie, was trying to make connections between what we had figured out and she asked her peers, “I don’t get it…why is it warmer on the ground?” She reminded her classmates that the hailstorms we investigated happened in warmer months, not during winter. So we decided to look more closely at sunlight and temperature close to the ground. We compared incoming and reflected light at different ground surfaces and compared the temperatures of the ground to those of the air a few feet above it.
We had intense discussions as we reasoned about what the data meant. At one point, Charlotte stopped her classmates and said, “Wait, I just need some help. Can someone tell me why we’re talking about the ground again? The hail is forming in the clouds.” Then Sheila jumped in, reminding Charlotte that we knew the hailstorms happened in warmer months, and we were wondering if the warmer air or ground mattered and why it was warm. Charlotte accepted her peer’s explanation and built on her thinking: “Maybe it has something to do with the difference between it being really warm near the ground and really cold up high.”
As we make our way through a storyline, navigation routines and strategies help keep our progress visible and help us keep track of what we’ve figured out and where we’re going. One tool we use is a summary table, on which we post a class record of each question we investigate and what we figured out.
Activity Summary Table used to record our progress and keep a public record of our ideas
The students record their personal reflections in their own version of this in their notebooks. Student progress trackers require students to think critically about what we’ve accomplished through our investigations and how to move forward. Returning frequently to our DQB also helps keep our questions in the forefront. Have we answered any of our initial questions yet? What do we still need to figure out?
![]()
Students’ progress trackers provide opportunities for individual reflection.
When teaching with storylines, everyone’s voice matters.
As stated in the Framework, “learning science depends not only on the accumulation of facts and concepts, but also on the development of an identity as a competent learner of science with motivation and interest to learn more” (NRC 2012, p. 286). Teaching with storylines allows students to own their learning. As we build knowledge, piece by piece, each and every student brings unique resources—life experiences, metaphors, culture, and language—to our classroom community. In these first few investigations, Andy, Charlotte, Josie, and Sheila strengthened their identities and interests as science learners through their questions, comments, and willingness to question their peers. Their voiced thoughts sparked discussions among their peers and helped guide the investigations that followed. Using storylines with an intentional focus on equitable science instruction, such as those developed by OpenSciEd, allows all students to build their identities as science learners as the class moves its scientific thinking forward.
* Student names have been changed.
References
National Research Council. 2012. A framework for K–12 science education: Practices, crosscutting concepts, and core ideas. Washington, DC: National Academies Press.

Scott Goldthorp has helped many students and teachers gain a deeper understanding and appreciation of science and mathematics as a teacher and K–12 District Supervisor of Curriculum and Instruction in Cherry Hill, New Jersey. He has been recognized by the National Museum of Mathematics with the Rosenthal Prize for Innovation and Inspiration in Math Teaching and was a New Jersey state finalist for the Presidential Award for Excellence in Math and Science Teaching for secondary science. Goldthorp currently serves on the executive board of the NJSTA as the retiring president and is NSTA District IV Director, connecting science educators across New Jersey, Pennsylvania, and New York. Connect with Scott on Twitter @scottgoldthorp.
Lauren Pasanek is a sixth-grade science teacher in Haddonfield, New Jersey, where she serves as a teacher leader for her district. This is her second year as an OpenSciEd pilot teacher. Before moving to New Jersey, she spent 10 years teaching science in Philadelphia, Pennsylvania, and collaborating with other teachers as part of the Master Teacher Initiative. Pasanek holds a master’s degree in integrated science education from the University of Pennsylvania and is a National Board–certified teacher. Connect with Lauren on Twitter @Lpasanek.
Note: This article is featured in the March 2020 issue of Next Gen Navigator, a monthly e-newsletter from NSTA delivering information, insights, resources, and professional learning opportunities for science educators by science educators on the Next Generation Science Standards and three-dimensional instruction. Click here to sign up to receive the Navigator every month.
Visit NSTA’s NGSS@NSTA Hub for hundreds of vetted classroom resources, professional learning opportunities, publications, ebooks and more - and join us for discussions around NGSS at an upcoming conference.
The mission of NSTA is to promote excellence and innovation in science teaching and learning for all.
Disclaimer: The views expressed in this blog post are those of the author(s) and do not necessarily reflect the official position of the National Science Teaching Association (NSTA).