
The Vernier Go Direct SpectroVis Plus Spectrophotometer: A picture is worth 570 wavelengths (Part 1)
By Martin Horejsi
Posted on 2019-01-21
Of all the cool things invented by the universe, light is one of the most amazing. It solves all kinds of problems, can travel great distances with little effort, and its very existence has become possibly the greatest metaphor ever. And on the science education side, light is a critical feature of wave science yet has properties of a particle. And its use is instrumental in the study of just about everything else.
One of the surprising educational contradictions about light is that although we use it to measure, to photograph, to communicate, and of course to see, understanding light requires a disproportionate amount of imagination. One tool that can make the transition from imagination to conceptualization to concrete application is the spectrometer. And I won’t ignore the irony that using a sensor to measure aspects of light that in turn transmits that data with light (Bluetooth radio) to a screen that emits light. A wired USB connection is also possible. And for those students who don’t know what a wire is, there is a fascinating history of the wire on Wikipedia. After reading it, I look at the humble wire with renewed appreciation across time and technology.
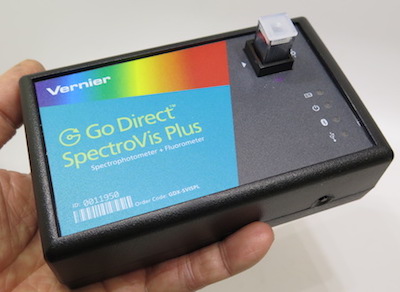
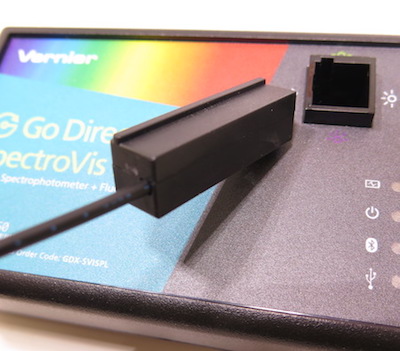
The Vernier Go Direct SpectroVis Plus Spectrophotometer is a tabletop solution for measuring wavelength spectrum in absorbance, percent transmission and intensity. While contemplating the various features of the Vernier Go Direct SpectroVis Plus Spectrophotometer, consider the mental gymnastics to have a graphical display of the wavelength absorbance of a material like spinach leaves. Essentially absorbance is what doesn’t reach the sensor in the Spectrophotometer. You can do the math.
The Vernier Go Direct SpectroVis Plus Spectrophotometer talks via Bluetooth with a screen device through a free app called Vernier Spectral Analysis available across the five major platforms of Windows, Mac, Chrome, iOS, and Google Play. The option to run spectrometry analysis with Logger Pro is also possible.
The wavelength range of the Vernier Go Direct SpectroVis Plus Spectrophotometer is from 380-950 nanometers (a range of 570 nanometers hence the article title), and has fluorescence capabilities with excitation at 405 and 500 nm.
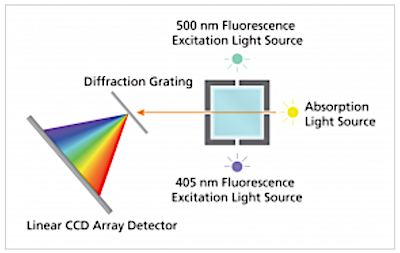
Vernier uses this graphic to illustrate the operation of the Vernier Go Direct SpectroVis Plus Spectrophotometer. Basically a known light source heads towards a prism-like diffraction grating then onto a detector chip. A sample is placed in the pathway where light is either absorbed or transmitted. Since the initial light source is known, any wavelengths that don’t make it to the chip are considered absorbed, and any that do make it to the chip are transmitted.
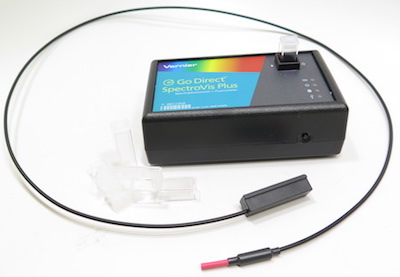
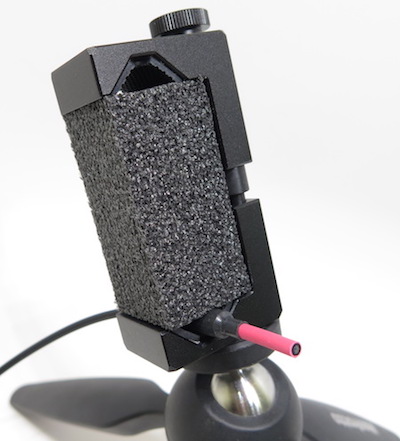
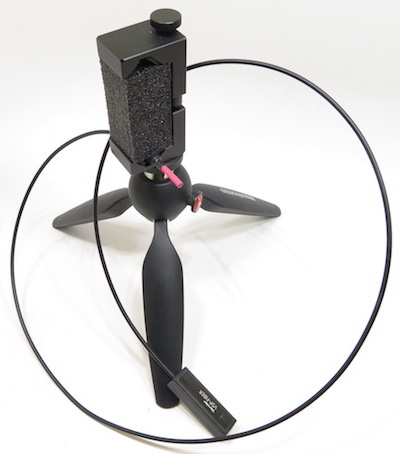
Adding to the reach of the Vernier Go Direct SpectroVis Plus Spectrophotometer is a compatible fiber optic cable that gives up to near point-of-contact readings on all kinds of light sources. The fiber optic cable has a false curvette with an indexing rail for proper alignment. Once the Vernier Go Direct SpectroVis Plus Spectrophotometer is warmed up and calibrated, the cable is inserted and measurements with the open end can be made.
I found management of the cable across general tabletop measurements was helped by a cable holder. I just used one of my many phone cradles with a bit of soft foam to secure the fiber optic under the variable pressure of the tripod mount.
While the uses of the Vernier Go Direct SpectroVis Plus Spectrophotometer seem near limitless, there are some very basic activities that can get the science class started, and quickly, like all phenomenal educational technology, the Vernier Go Direct SpectroVis Plus Spectrophotometer literally disappears as the excitement and wonder of some of the most interesting and insightful science applications literally revolutionize the way we understand and teach about light.
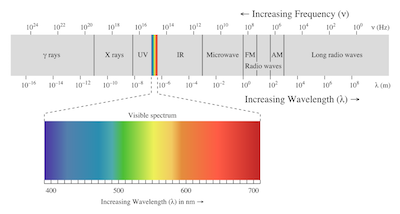
As a classroom teacher, I could draw the simplified electromagnetic spectrum on the whiteboard with my eyes closed. As the squiggly line of wavelengths went from long to short, a special cutout was made magnifying the ROY G BIV the students were already familiar with. From there I would stress what is just above and below Roy, and provide a few hard-to-memorize numbers that quantify what I was drawing.
With special attention to the IR and UV portions of the spectrum, we will actually see those extensions while working with the Vernier Go Direct SpectroVis Plus Spectrophotometer and various light sources. Rarely do light sources stay within the confines of visible light. And some seem to play well far outside the Red and Violet.
At this point I would take a psychophysical detour into how the human eye sees, and sees color in particular. Where I can now use the Vernier Go Direct SpectroVis Plus Spectrophotometer, a new dimension of teaching is possible. I call it Predictive Perceived Color Identification. It all starts with that popular science question of under what color light will plants grow the worst. Of course the inverse is what color light do plants absorb the best, but that is for later since all we have to work with at the moment is a green leaf.
Invarably, a student will suggest that green light is the best because plants are green. Of course in reality, the reason the plant is green to our eye is because the plant reflects the green light rather than absorbing it. Once that mental gymnastic is complete, and the students are clear that green is the worst color, we can move on to other examples such as what color will you see when something red is bathed in red light? Or green light? With the volume turned up on mental modeling of perceived color, we can then warm up the Vernier Go Direct SpectroVis Plus Spectrophotometer and get some values for half of the equation for use in predicting what we will see when we run the experiment.
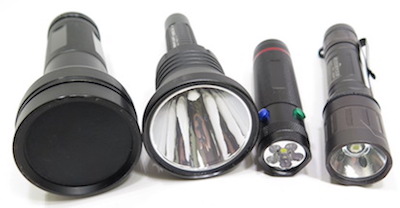
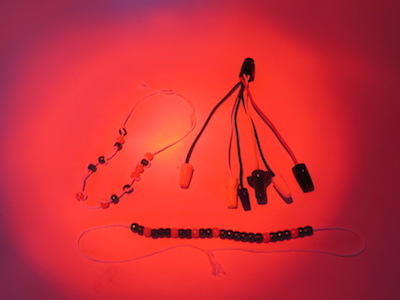
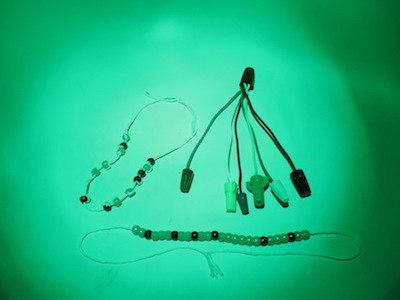
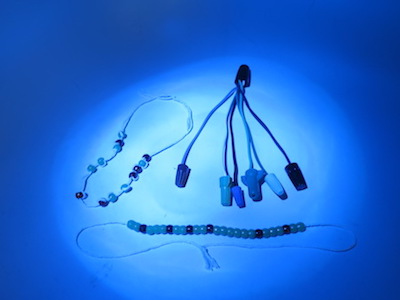
A great starting point, beyond having the Vernier Go Direct SpectroVis Plus Spectrophotometer on hand of course, is a flashlight with multiple different color outputs. I picked up on from the hardware store for about $20. Colored filter material and a bright white light flashlight will work as well. The next step is to find objects of roughly the same color as the light that spills from the flashlight. I use plastic beads and wires, both often at the hardware store as well.
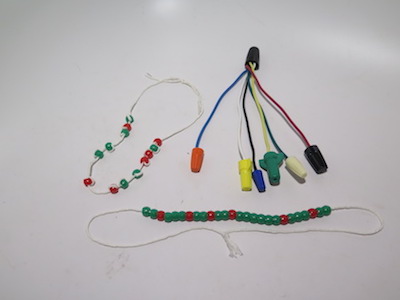
Wire and Beads under white light
To make this realistic, I generate a backstory grounded in fact. For the beads, I string mostly green ones with the occasional red mixed in. This color sequence represents blood from a wounded animal dripping onto green leaves. It’s actually a more-common-than-not situation for archery hunters, and is the tracking half of the hunting equation. While I skip the physiological implications of an arrow wound, the blood on the leaves is one of the more mild applications for this CSI-like science.
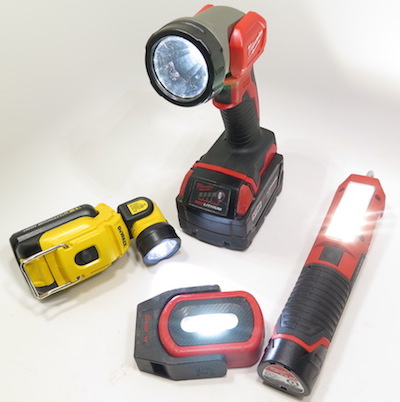
The wires, on the other hand, are to mimic what happens when someone needs to work with electrical wiring in the dark using only a flashlight or headlamp. Since wires are often identified by color, perceiving the color is essential. The problem is that in order to see the color, the wavelengths of that color must be present in the light source in order to bounce off the object and into the electrician’s eye. If you point a colored light or even a white-looking but incomplete spectrum light at colored wires, you may not be able to tell the wires apart. So critical is this that many work lights for the handyman and electrician are near-full spectrum LEDs to provide color wavelengths across the visible spectrum and advertised as such. A lightly scientific but ad heavy explanation for Milwaukee Tool’s TRUEVIEW LED technology can be found here at toolguyd.com’s website.
So here is an example. Study the images and make an educated guess as to what is happening.
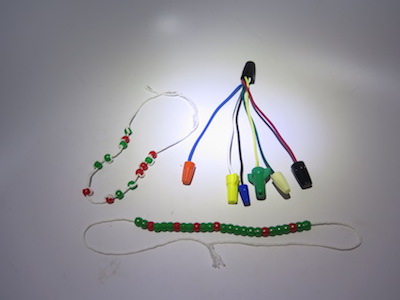
Pretty easy, right? So now lets do the same with the spectrum produced by the Vernier Go Direct SpectroVis Plus Spectrophotometer as presented with the Spectral Analysis App. Note that there might be a combinations of colored lights.
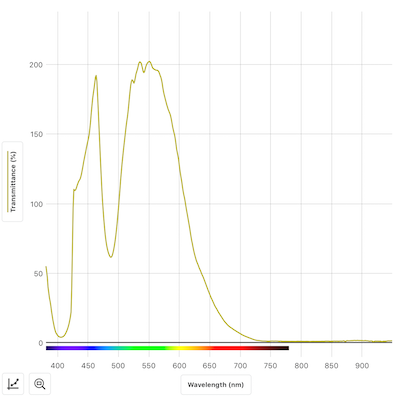
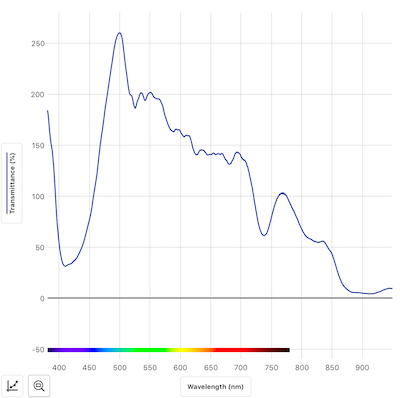
Another interesting exploration was with spectrum-specific light bulbs. For instance, on the shelf of a local health food store were some lightbulbs marketed as “Blue Buster!” and the boxes contained diagrams of the light spectrum. I guess we’ll have do our own truth-in-advertising test.
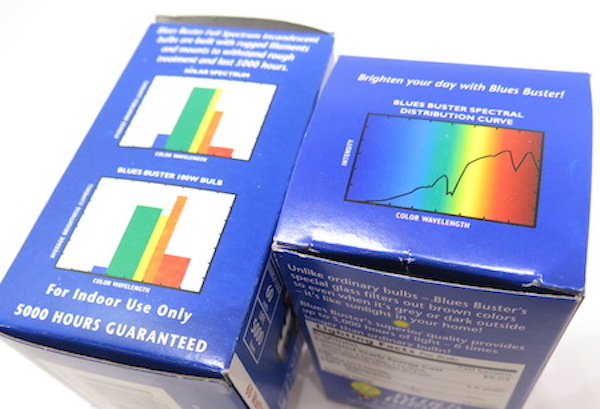
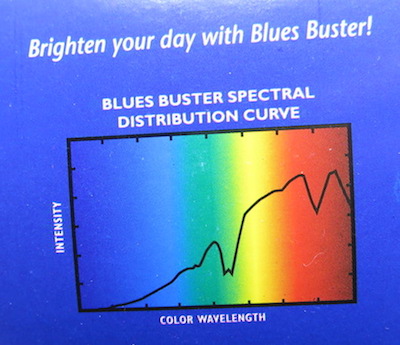
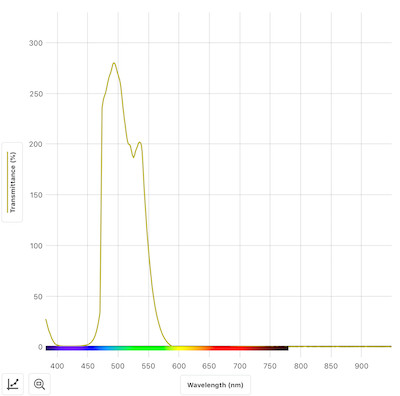
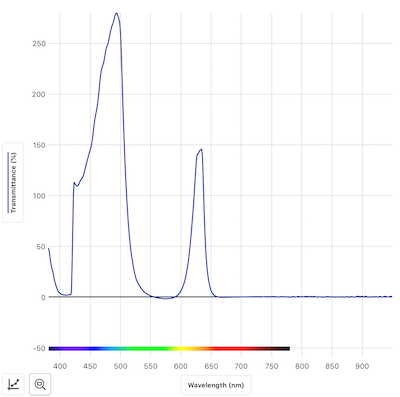
There were two version each at different wattages; frosted and clear, and 60 and 75 watts. The image immediately below is the 60w frosted bulb, and the one below that is the 75w clear bulb.
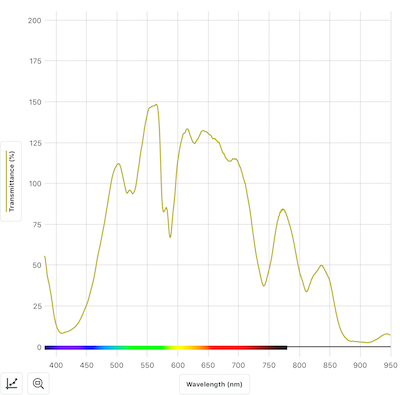
![]()
One think I noticed is that the clear bulb has sharper distinctions between peaks and valleys. Something that should be expected compared to a frosted bulb. Maybe? In reality, it could be argued that the presence or absence of any particular wavelength of visible light is unaffected by a diffusion coating. Perhaps the frosting is just smoothing the line in the graph. Something important to notice, however, is just how far the Blue Buster bulbs reach out into the infrared spectrum. In fact they easily went beyond the capabilities of the Vernier Go Direct SpectroVis Plus Spectrophotometer as noted by the non-zero line at 950 nanometers. And even worse, there appears to be something happening out at the sub-400 nm UV spectrum. So much so that I’m going to pull out my Vernier UV sensor and get back to work.
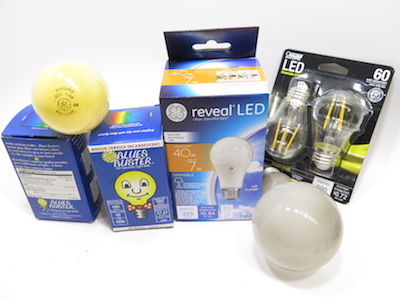
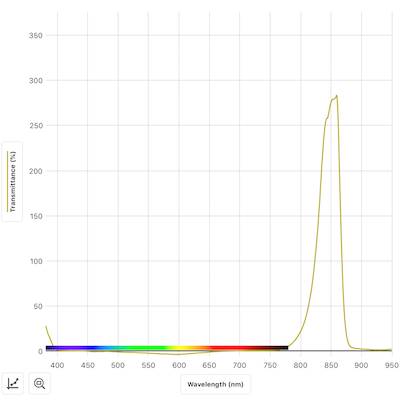
As expected with a bulb producing plenty of IR, the Blue Buster got hot rapidly. But there was another bulb that heated up even faster, a bulb marketed as a Bug Light.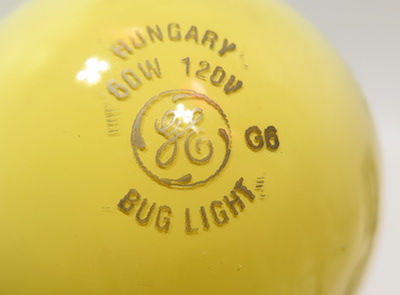
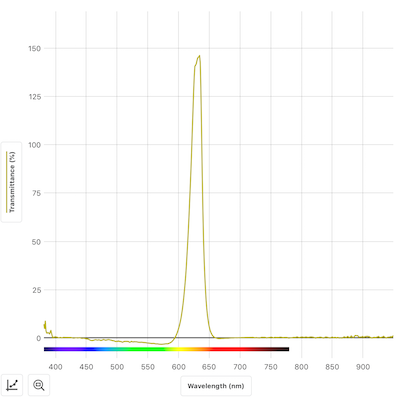
The Bug Light produced a yellow light and is designed to avoid those wavelengths that night-flying bugs are more sensitive to. In other words, a bug light should be more sunny or daylight and less evening or nightlight. But the real surprise was confirmed by Vernier Go Direct SpectroVis Plus Spectrophotometer. I discovered it on my own, and that was the Bug Light got very hot very fast. I can see some more probeware research is needed to measure the temperature of these bulbs over time.
The Bug Light has plenty of juice when it comes to the IR spectrum, and also a very strong UV signature. A quick look at that spectral curve and I suspect that bug lights should also repel humans.
To explore the IR and UV spectrum along with what reflects and absorbs UV and IR, well, there are flashlights for that. With dedicated UV and IR flashlights, the only way to measure the “brightness” of the flashlights was with the Vernier Go Direct SpectroVis Plus Spectrophotometer since light is invisible to our eyes the moment you step outside the visible spectrum property line. Here are those flashlight spectrums:
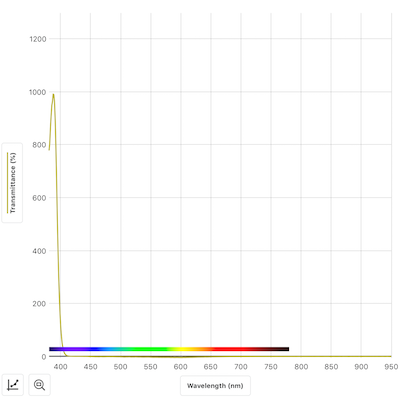
Care must be exercised when using UV and IR-only light sources. Unlike a regular flashlight, you cannot easily tell if the UV or IR light is on. And further, you don’t notice how bright it is because it can never appear bright. Or dim for that matter. So a strong UV or IR light source can cause eye strain, headaches, and disorientation, if not permanent eye damage.
So now when I see interesting light bulbs and light sources, I try to imagine what the wavelength spectrum looks like. And given the rapid evolution of LED lights and light applications, I cannot easily think of a limit to the educational applications of the Vernier Go Direct SpectroVis Plus Spectrophotometer. And we haven’t even started chemistry class yet.
Stay tuned for Part 2!
Disclaimer: The views expressed in this blog post are those of the author(s) and do not necessarily reflect the official position of the National Science Teaching Association (NSTA).