
Wild Spirits: Measuring Life and Death with the Pasco Wireless CO2 sensor
By Martin Horejsi
Posted on 2018-05-21
A student once asked me why if carbon dioxide is so much heavier than air, how come the lower atmosphere doesn’t become thick with CO2 and kill everything?
“Umm, well…because it…umm…doesn’t?”
The student then asked if I was going to answer her question with another question? Which of course is also a question. So how many questions are we up to now?
Anyway, before we all panic and run to higher ground, let’s stem the fear with the simple answer that convection (wind) and diffusion (mixing) keep the CO2 concentration in check and evenly distributed. But first, some history before moving on to measuring CO2.
Amazingly, the identification of carbon dioxide as a discrete substance was first reported a full two years before Sir Isaac Newton was born. In fact Galileo still had two good years of research left in his bones before taking his final break.
Now, 378 years later, carbon dioxide is a not just a proportion of our atmosphere, but potentially an indicator of the health of our one-and-only planet. Our current concentration of CO2 is 405 ppm or parts per million. Estimates of pre-industrial levels of CO2 are around 280 meaning there has been a substantial and statistically significant increase in the global CO2 level.
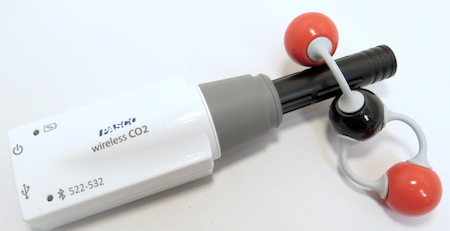
For all its danger, Carbon dioxide is an elegant molecule that contain two oxygen atoms 180 degrees apart tied to a single carbon atom through double bonds. Often symbolically written as O=C=O, carbon dioxide is an odorless, colorless gas that is 60% denser than the average handful of air.
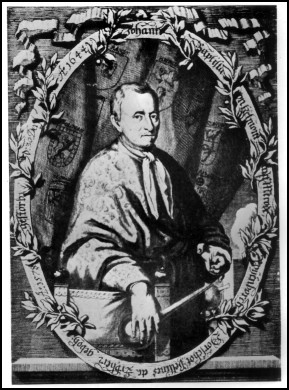
Chemist Jan Baptist van Helmont discovered that when charcoal was burned in a closed container, the mass of the ash was less than that of the charcoal at the beginning. His inference was that the missing charcoal mass had been turned into an some sort of invisible material that was named a “wild spirit” essentially meaning a gas.
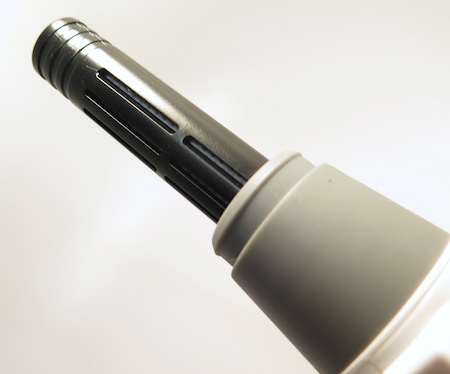
That gas also just happens to absorb wavelengths in the infrared of exactly 4.27 microns allowing a digital sensor to record changes in the concentration of light with a 4.27 micron wavelength. And those concentrations can be measured with a known light source and a known sensor. More specifically a thermal sensor that converts temperature to electricity which makes sense since we are working in the infrared.
Essentially, the physics behind Pasco Wireless CO2 sensor works like a mini greenhouse effect where the particular IR wave that is the same size as a CO2 molecule is projected across a space that contains the gas to be measured. As the infrared waves move through the space, the CO2 molecules absorb the IR. So the more CO2 in the sampled gas, the less IR that reaches the detector. This type of sensor is called an NDIR or nondispersive infrared sensor. You could imagine it like measuring the amount of dust in or snow in the air by noticing how much less road your car headlights illuminate.
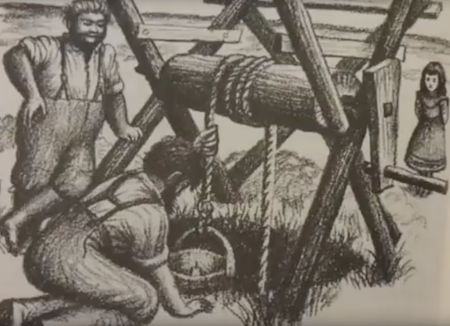
Sensing carbon dioxide has been an issue for centuries. The whole Canary in a Coal Mine thing included CO2 as well as CO and methane. And lowering a burning candle into a hole in the ground being dug for a well has been a thing much longer than when Pa Ingalls struggled with CO2 in chapter 12 of the book Little House on the Prairie.
And like the carbon dioxide conundrum in Little House on the Prairie, a popular science demonstration is to use vinegar and baking soda (or dilute acidic acid and sodium bicarbonate) to generate carbon dioxide that is then used to extinguish burning candles. Whether on the scale of a Mason jar or a 20 gallon aquarium, the visual is impressive. Float some soap bubbles on the invisible layer of CO2 and you will have disequilibrium events of Pigetian proportion.
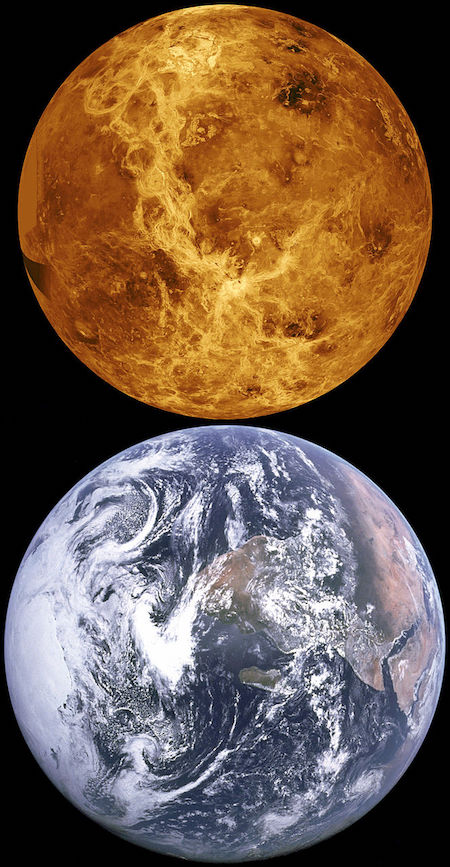
Venus (above) compared to the size of the earth (below)
And also like the carbon dioxide conundrum in Little House, the very earth into which that well was dug has its own CO2 conundrum. Nestled just a scant 0.22 astronomical units (AU) from earth lies the planet Venus. Just slightly smaller than the earth and one-fifth closer to the sun, our morning start is a run-away greenhouse effect. With Venetian air composed of roughly 96% carbon dioxide and surface temperature of 462 degrees Celsius, Venus, as beautiful as she is deadly and represents our worst nightmare for earth.
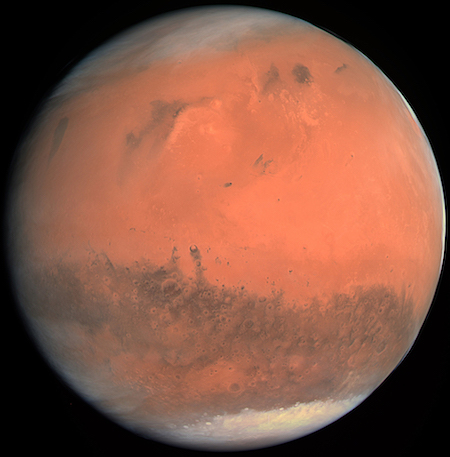
The planet Mars.
And just half an AU further from the sun than where you are sitting right now is Mars. Although only one-half the diameter of the earth, Mars does maintain a minor atmosphere, once described by Allen Chen, the Mars 2020 Cruise and Entry, Descent, and Landing Phase Lead scientist, as “There’s just enough atmosphere to be annoying, but not enough to be helpful.”
Chemically, the atmosphere of Mars is an eerily familiar roughly 96% carbon dioxide. May I remind you that the concentration of carbon dioxide you are breathing right now is about 0.4% or 240 times less than Venus or Mars. So low is the Earth’s atmospheric CO2 level that we measure it rather than in parts per hundred (know as a percentage), but in parts per million. Compare that to our 78% nitrogen and 21% oxygen happiness.
In 2014, NASA launched a satellite with the second nerdiest moniker for a spacecraft namely Orbiting Carbon Observatory 2, or OCO2 for short as in the second OCO spacecraft. OCO, or more specifically O=C=O is shorthand chemical symbol for carbon dioxide. Why the name OCO2 is in second place is because the first satellite, named elegantly “OCO” failed to separate from its launch faring and thus failed to separate from earth’s gravity enough to go orbital, and instead fell lifelessly into the Indian Ocean. Politely known as a “reflight” the second OCO, or rather the first OCO2, would add critical data to our understanding of the carbon levels and distribution on earth.
![]()
![]()
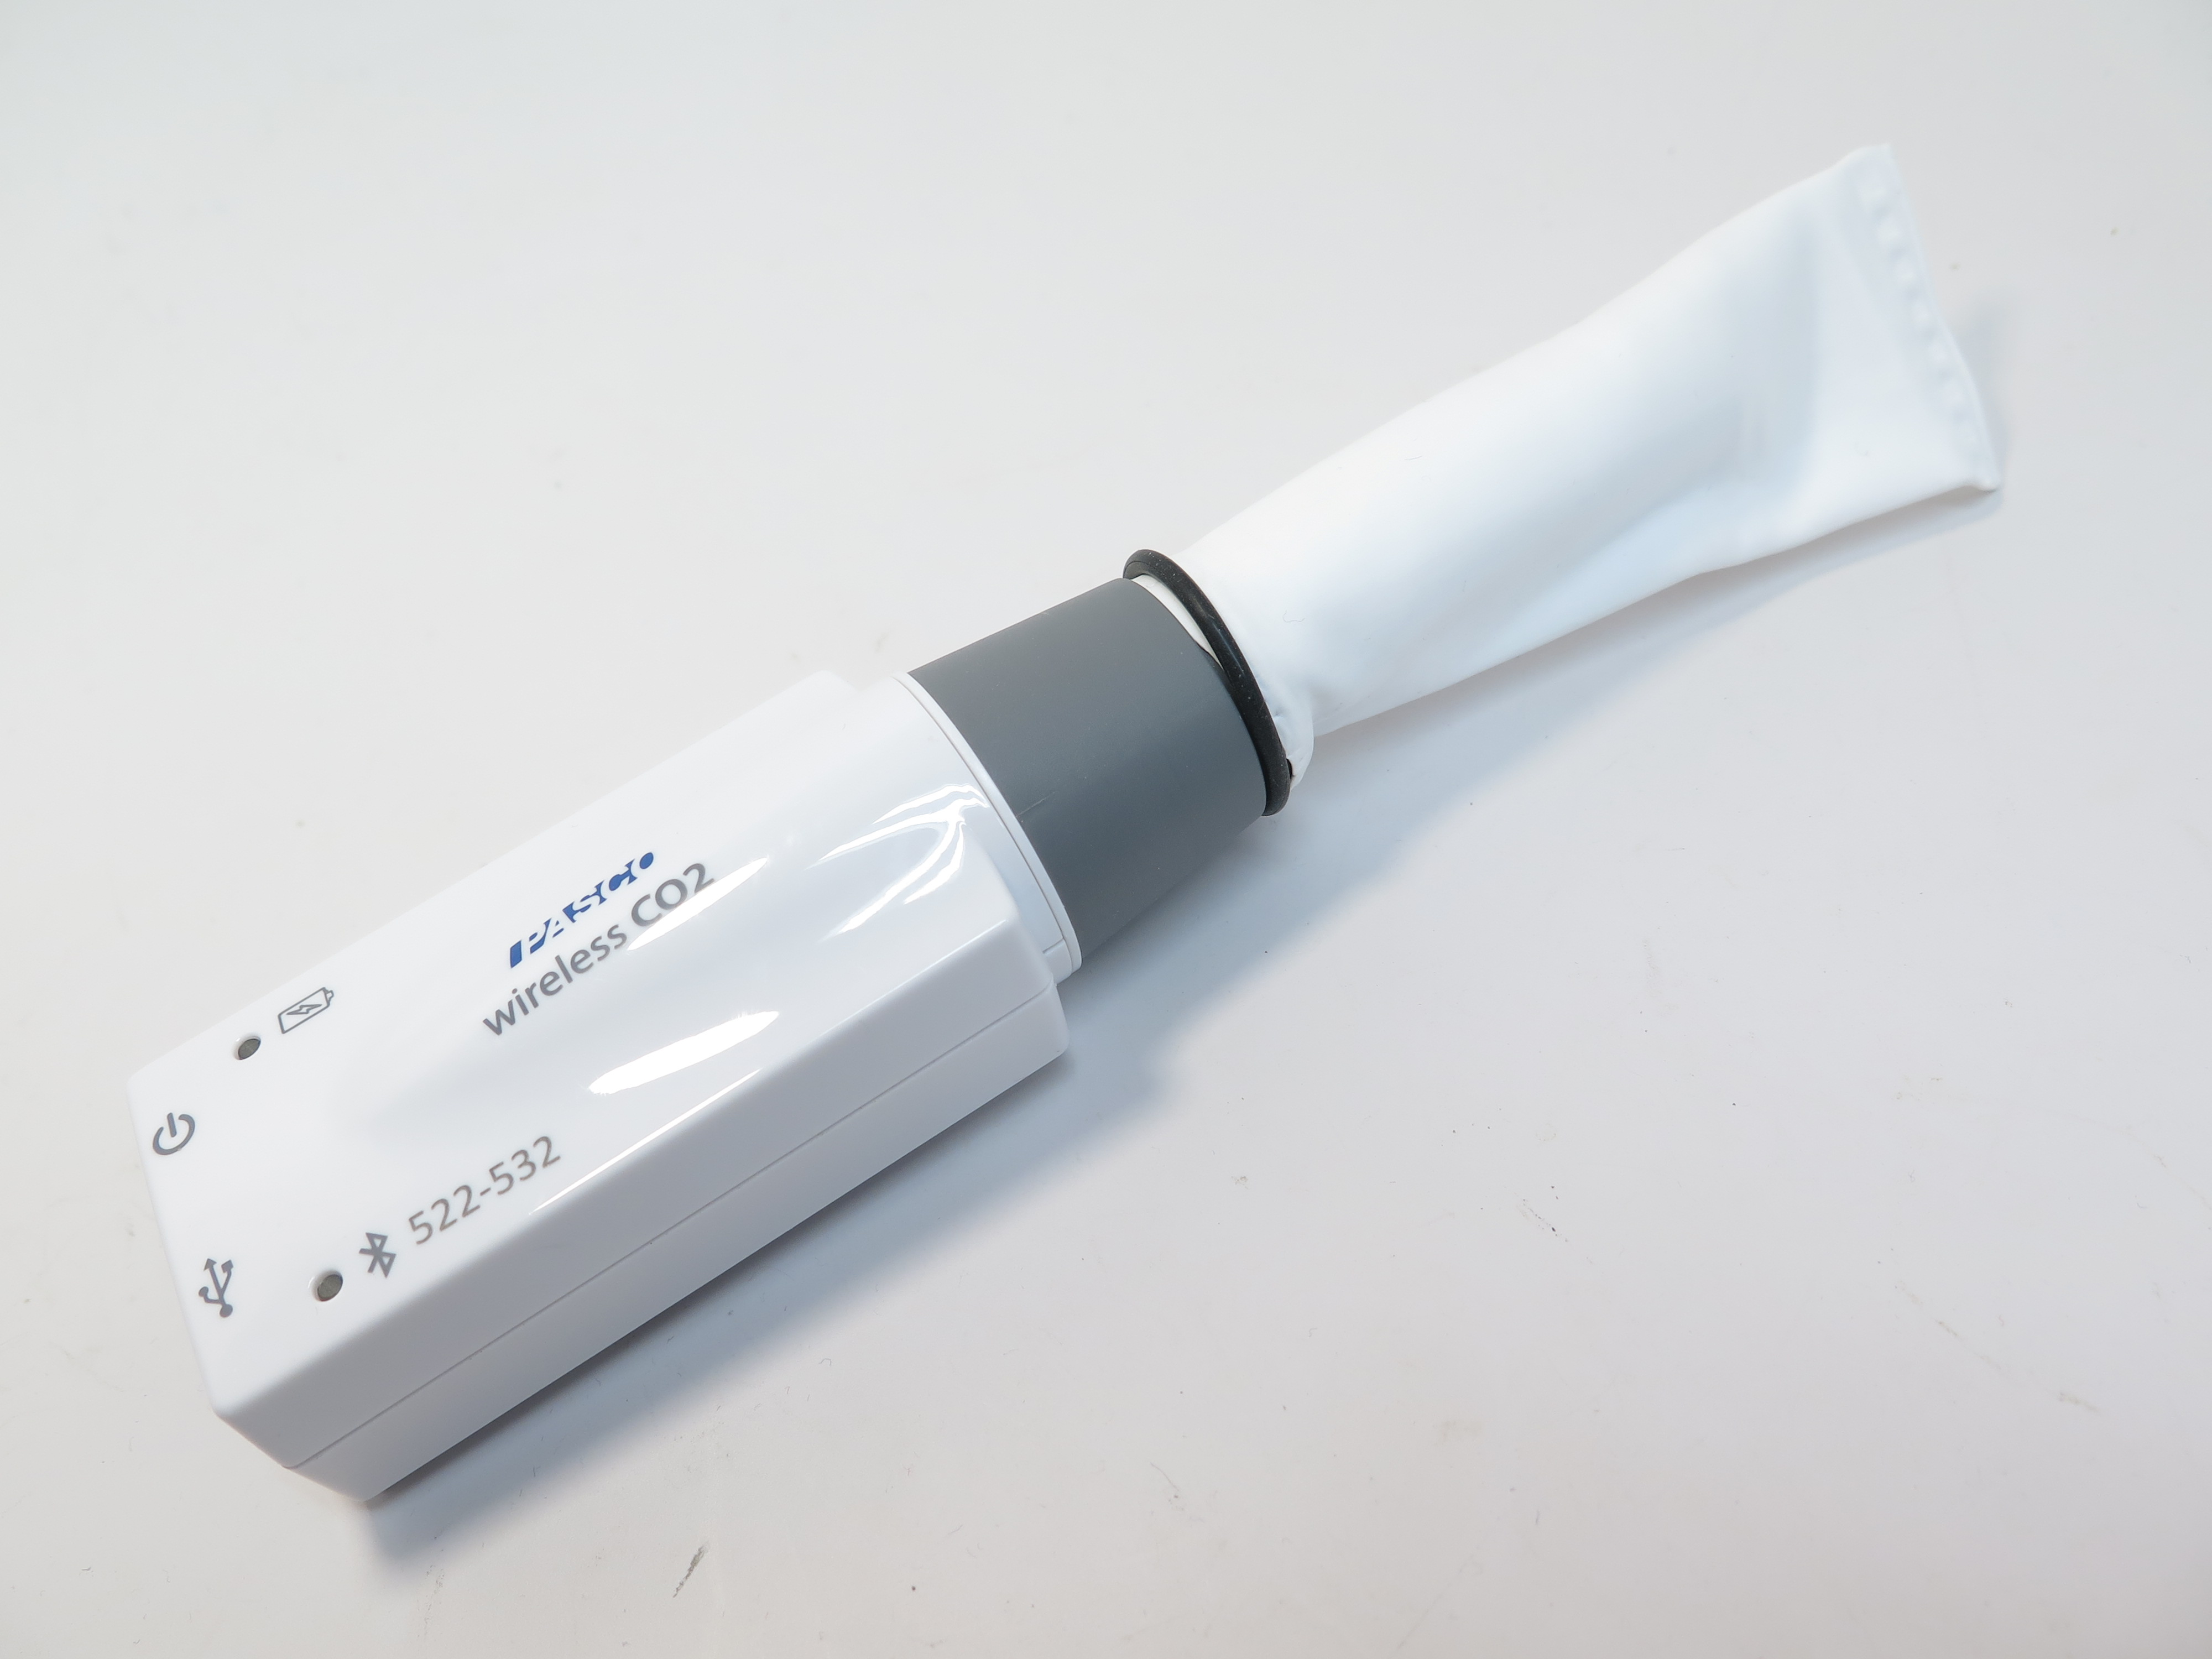
The OCO2 is the sixth boxcar(?) in the A-train satellite constellation providing a series of indirect measurements of CO2. But if you want to directly measure CO2 levels in your classroom, the Pasco Wireless CO2 sensor is just the ticket. And at half a billion dollars less than an OCO satellite! Or you could spend that half-billion to buy one Pasco Wireless CO2 sensor for every five high school student across the entire United States.
Specifications of the Pasco Wireless CO2 Sensor
|
Range |
• 0 to 100,000 ppm |
|
Resolution |
• 2 ppm |
|
Accuracy |
• 0 to 1000 ppm: ± 100 ppm •1000to 10,000 ppm: ± 5% of reading+100ppm •10,000 ppm to 50,000 ppm:± 10% of reading •50,000 – 100,000 ppm:± 15% of reading |
|
Connection |
• USB •Bluetooth® 4 |
|
Battery life |
• 18-24 hours of continuous use either when connected to devices or in logging mode. |
|
Working Environment |
• 0-50 °C •0-95% Relative Humidity |
|
Warm-up Time |
• 180 seconds |
|
Response Time |
• 90% in 30 seconds |
|
Pressure Effect |
• 0.19% of reading per mmHg from standard pressure |
|
Gas Sampling Mode |
• Diffusion |
The Pasco Wireless CO2 sensor is controlled by the software on a computing device. The SPARKvue software platform is available from Pasco in any of 28 different languages and once in in SPARKvue, you can build a custom visual interface that presents the Pasco Wireless CO2 sensor data in a real-time graph, gage, or numerical readout.
There are plenty of classic experiments where the Pasco Wireless CO2 sensor works wonders. And then there are the creative and unique tangents where the Pasco Wireless CO2 sensor can provide real-time feedback as the atmospheric condition change whether in a paper bag or vehicle, or crowded mall on Black Friday.
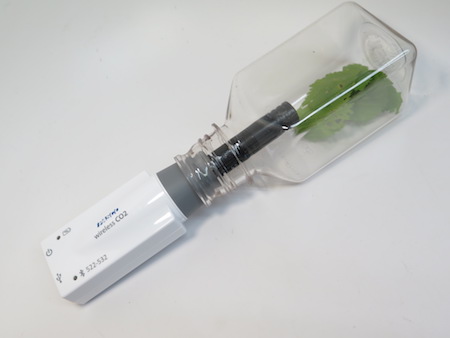
For the classics, Pasco includes a 250ml sampling bottle that the Pasco Wireless CO2 sensor snugs into just fine with its tapered stopper-like collar. Another classic demonstration is the measurement of CO2 in an enclosed space like a bag as a person exhales into the bag.
On the creative end, well, there is no end. A philosophical change I’ve had during my decades in science education is that students are getting a little concerned about being issued our current problems as a challenge for their intellect and assignments. But its not the problem that concerns the students, but instead that we (adults) continue to make the problems worse as we ask our students to generate solutions to the problems. And CO2 is a big one. A big scary one.
CO2 is not just another atmospheric component as anyone over age 40 knows, but to K-12 students these days, CO2 is the Hiroshima of my era. Its the quantifiable example of when things go bad. In full disclosure, my great uncle was in Hiroshima when the bomb went off. My immediate uncle married into the Japanese family and they chose not to have children in fear of effects from the Hiroshima bombing. As a result, my children do not have any cousins from my only uncle on that side of the family. Sorry to go into detail, but as we try to keep a safe distance between threats for our global security and the happiness of classroom science, know that students put the scientific jigsaw puzzle pieces together even if its not on the test.
Another feature of the Pasco Wireless CO2 sensor is that a waterproof yet CO2 breathable sleeve can be added to the business end of the sensor that allows the Pasco Wireless CO2 sensor to read the CO2 concentration in a solution. Like a magic sleeve that lets in CO2 but not water, the Dissolved CO2 Waterproof Sleeve slides over the sensor proper and allows submersion in water up to the top of the sleeve and no further. The Pasco Wireless CO2 sensor is far from waterproof, and if submerged, expect the worst. But you might be lucky.
Using the SPARKvue software, you can have the actual CO2 concentration down to the millionth of air in seconds. CO2 is an exhaust gas from humans and other biotic organisms. And the burning materials and fossil fuels. CO2 is a gas that needs sequestering. A gas that needs to remain underground. Note that burning a log or even a forest fire is totally different ballgame extracting CO2 from long buried pre-dino-age plant matter, or limestone rocks that haven’t been airborne carbon molecules in hundreds of millions to billions of years. So this is why the CO2 emissions of a forest fire and cow emissions are completely different from that of burning fossil fuels and straight across comparisons are dangerous.
For more specifics on the further subdivision of CO2 molecules below just a part-per-million number, explore the Seuss Effect. But in a nutshell, the Seuss Effect shows that “the carbon from fossil fuels that is returned to the atmosphere through combustion is depleted in both 13C and 14C compared to atmospheric carbon dioxide.” In other words, we can actually identify if the carbon in atmospheric comes from current processes like forest fires or volcanoes, or released into the air from the burning of fossil fuels.
Another CO2 conundrum is the safety wisdom to crawl out of a burning building when it’s full of smoke. Not only is the smoke the densest the higher you go above the floor, but so is the carbon dioxide. So in this case CO2 is less dense than ordinary air. How can that be? The higher temperature of the CO2 from the fire allows it to “float” on air until it cools.
Carbon dioxide is a fascinating substance with which life has a love/hate relationship. Using the Pasco Wireless CO2 sensor to explore quantities and changes in CO2 and put some firm numbers to invisible deadly gas we produce with every breath.
Disclaimer: The views expressed in this blog post are those of the author(s) and do not necessarily reflect the official position of the National Science Teaching Association (NSTA).