
The Engaged Scientist
Numbers in Nature, Math on the Mountain
A Teacher–Scientist Partnership to Tell Stories of Place Through Data
Connected Science Learning April-June 2018 (Volume 1, Issue 6)
By Michael Giamellaro and Kari O'Connell
Data are the workhorses of the scientific endeavor and their use is rapidly evolving (Haendel, Vasilevsky, and Wirz 2012). Ask almost any scientist about their work, and the conversation will involve the data they collect and analyze. The use of data in science is often captured in science classrooms as an ill-defined link between math and science that may not reflect authentic data practices (Tanis Ozcelik and McDonald 2013). Students often find themselves collecting data to confirm obvious conclusions within highly structured labs, and data become a way for students to demonstrate the precision of their methods rather than a tool for explaining a phenomenon. For scientists, data are much more: Data are used for the inductive process of theory building (Windschitl et al. 2007). In other words, data can be used to tell rich narratives about relationships, phenomena, places, and other facets of the natural world through both inductive and deductive processes. Learning how to read the stories within data is a learned skill that must be intentionally taught, not only to K–12 students, but also to teachers. This process has the power to help transform science education from a droll recitation of known facts to an immersive exploration of nature, in nature’s own language.
Through the Numbers in Nature, Math on the Mountain (NiNMoM) project, teachers and scientists were brought together to collaboratively explore data that tell the stories of two locations in Central Oregon: the H.J. Andrews Experimental Forest (HJA) and Mt. Bachelor. Project goals were to increase teachers’ data literacy and cocreate contextualized curricula the teachers could enact with their students.
The project partners included:
- three project coordinators (teacher educators and education researchers);
- 11 university research scientists, who collect data at HJA or Mt. Bachelor;
- five master classroom teachers experienced in teacher–scientist partnerships; and
- 24 other classroom teachers.
The 29 teachers (including master teachers) on the project included elementary teachers (fourth through sixth grades) and middle and high school science and math teachers. Because the curriculum frameworks were designed for each grade level and then developed by teachers for their own classrooms, the project was able to accommodate this wide breadth of content and developmental levels. In other words, the project used teachers’ expertise to tell the data stories at an appropriate level. Teachers represented all six school districts in the Central Oregon region: Bend–La Pine, Crook County, Culver, Jefferson County, Redmond, and Sisters, and most participants taught at Title I schools. They were recruited through e-mail and district administrators, and received a modest stipend, substitute teacher coverage, and graduate professional development (PD) credits.
Participants, including teachers, scientists, and project coordinators, spent time unpacking the nature of data literacy, examining myriad data collected at HJA or Mt. Bachelor, visiting field study sites to connect the data to their context, and then converting those data-driven stories to grade level–specific lessons aligned to the Next Generation Science Standards (NGSS) and the mathematics standards in the Common Core State Standards (CCSS). Please see Appendix A in Supplementary Resources for examples of these threads.
Data literacy
The NGSS and its foundation document, A Framework for K–12 Science Education, describe eight practices that are central to science and engineering and that must be taught in schools. Although these might bring to mind skills related to designing and conducting experiments, just one of the practices addresses experimentation. Rather, half of the NGSS practices are explicitly focused on the use of data: Developing and Using Models, Analyzing and Interpreting Data, Using Mathematics and Computational Thinking, and Engaging in Argument From Evidence (NGSS Lead States 2013). Two of the eight CCSS mathematics practices include facility with using data: Construct Viable Arguments and Critique the Reasoning of Others and Model With Mathematics (NGAC and CCSSO 2010). However, teachers often struggle with incorporating the use of data into the science classroom (Mayes et al. 2014), and elementary teachers often lack training in key components of using data, precluding them from incorporating these ideas into their own lessons.
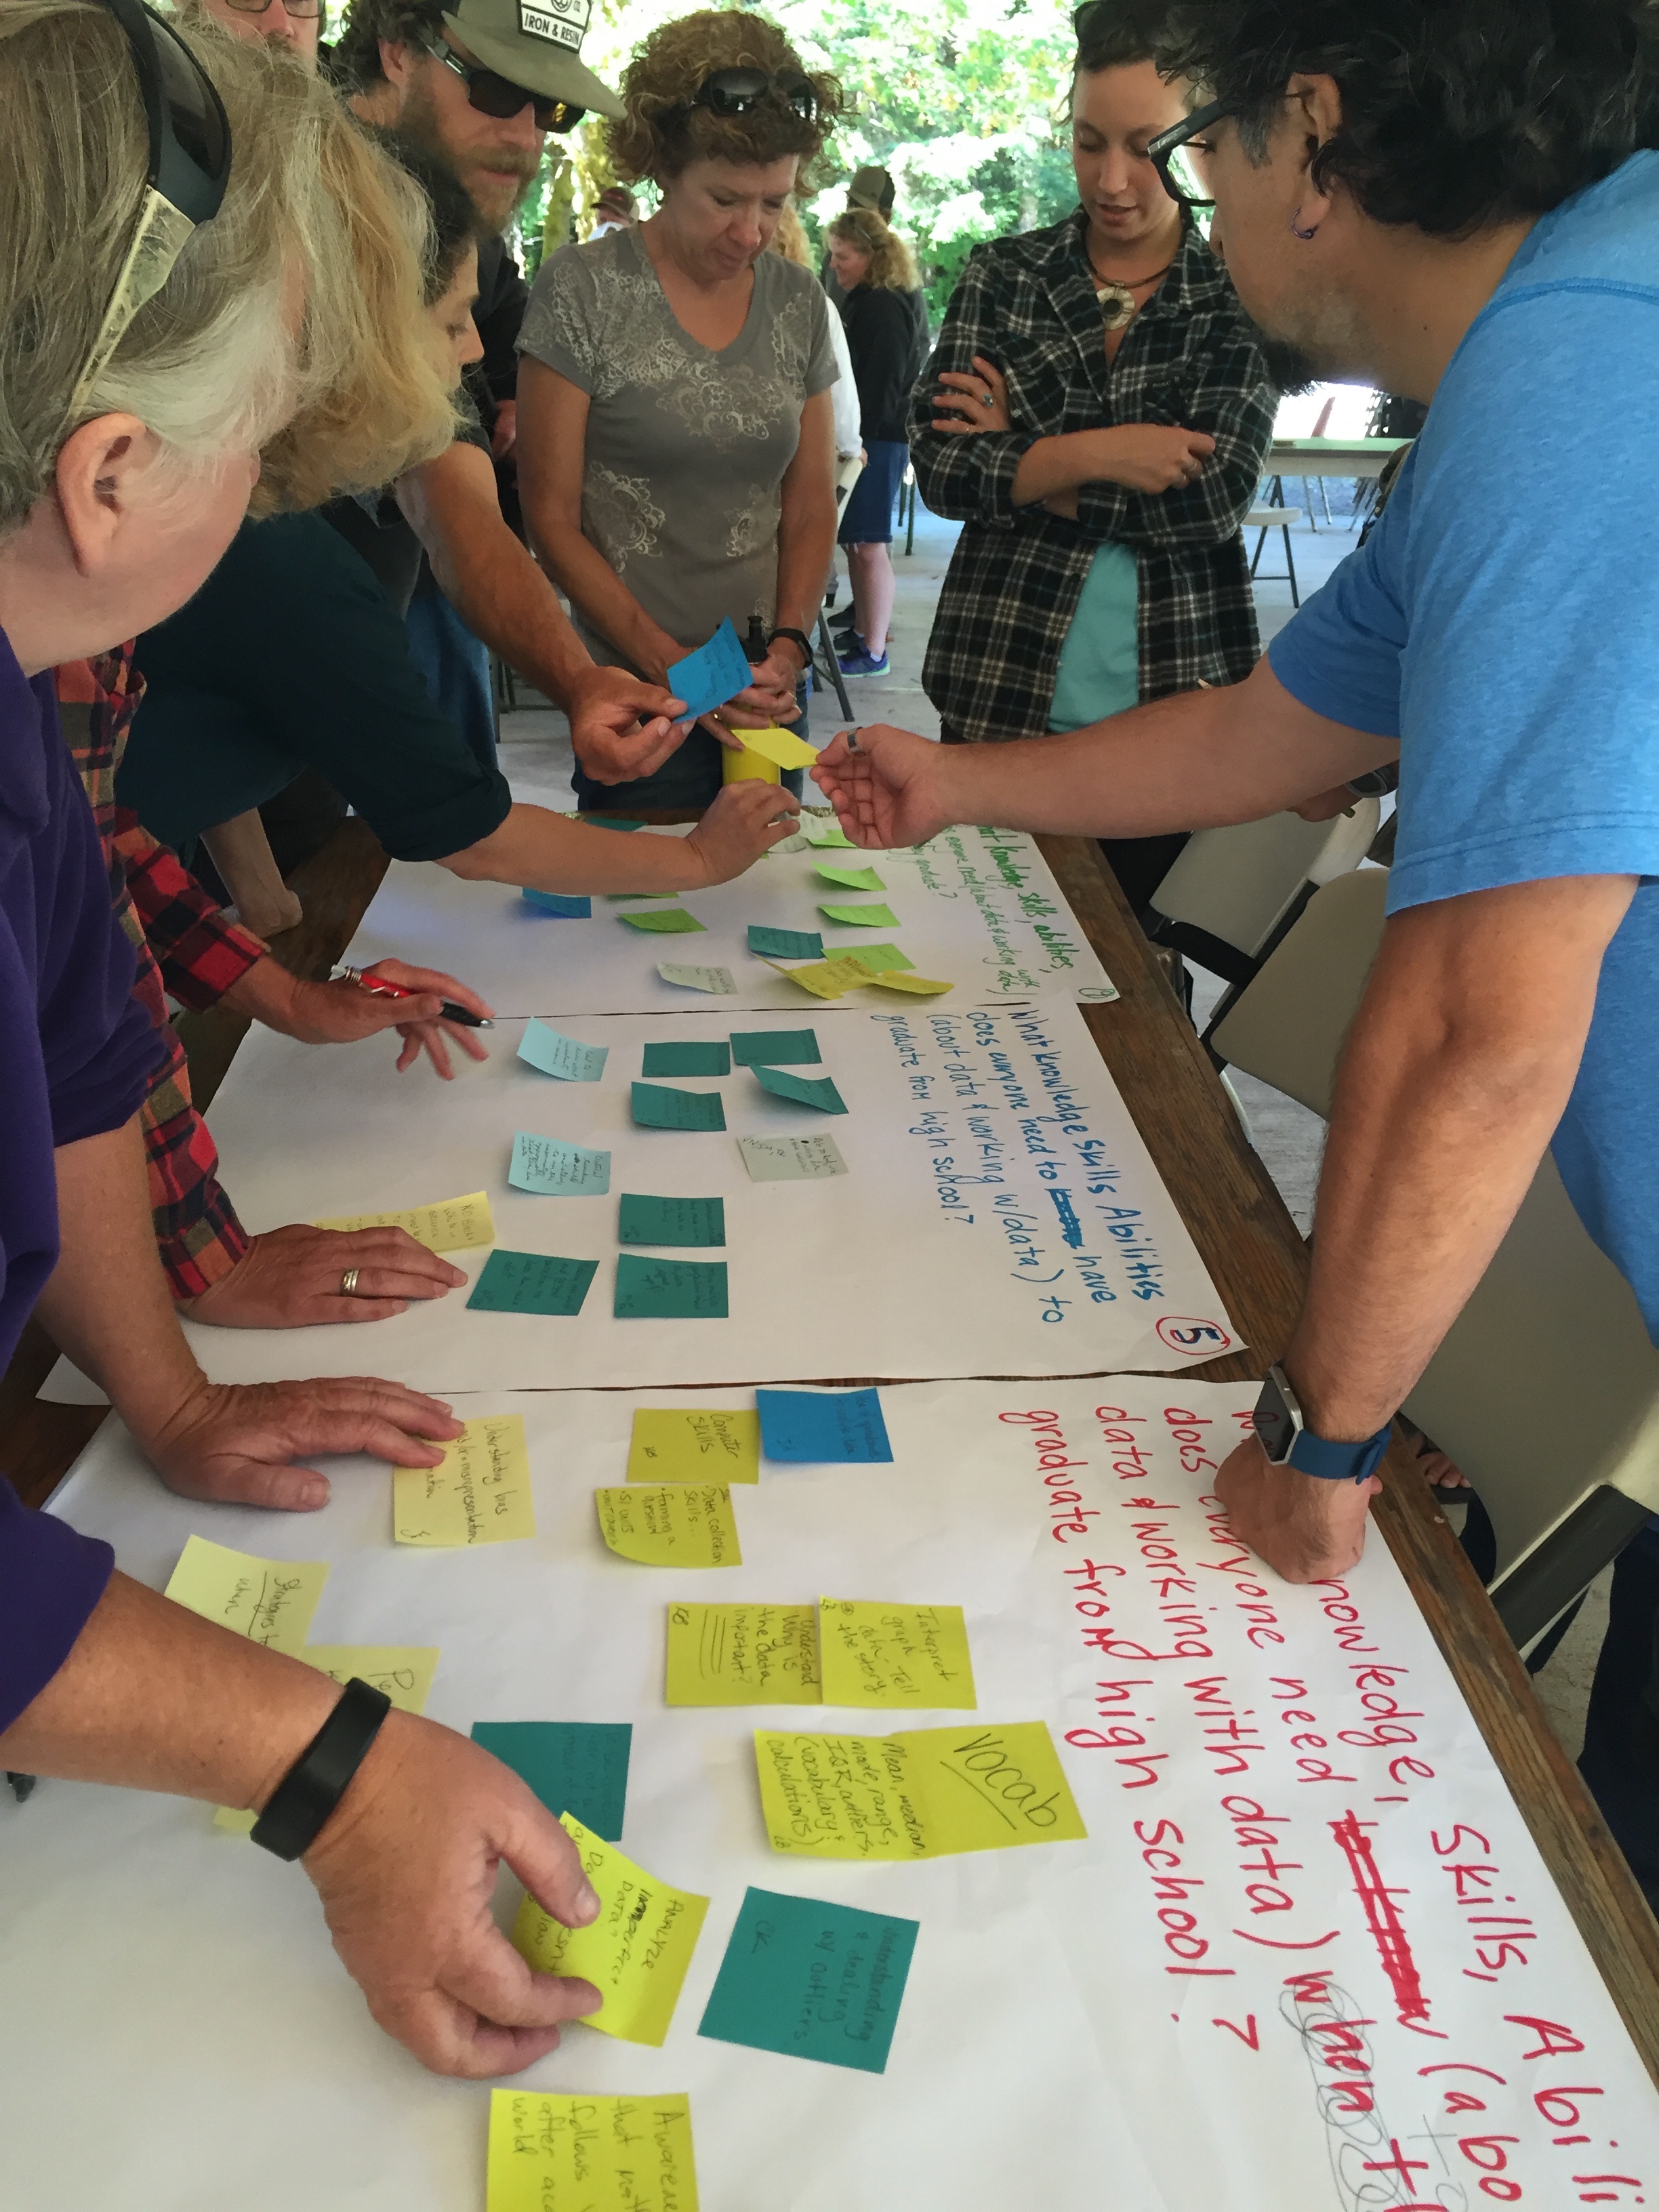
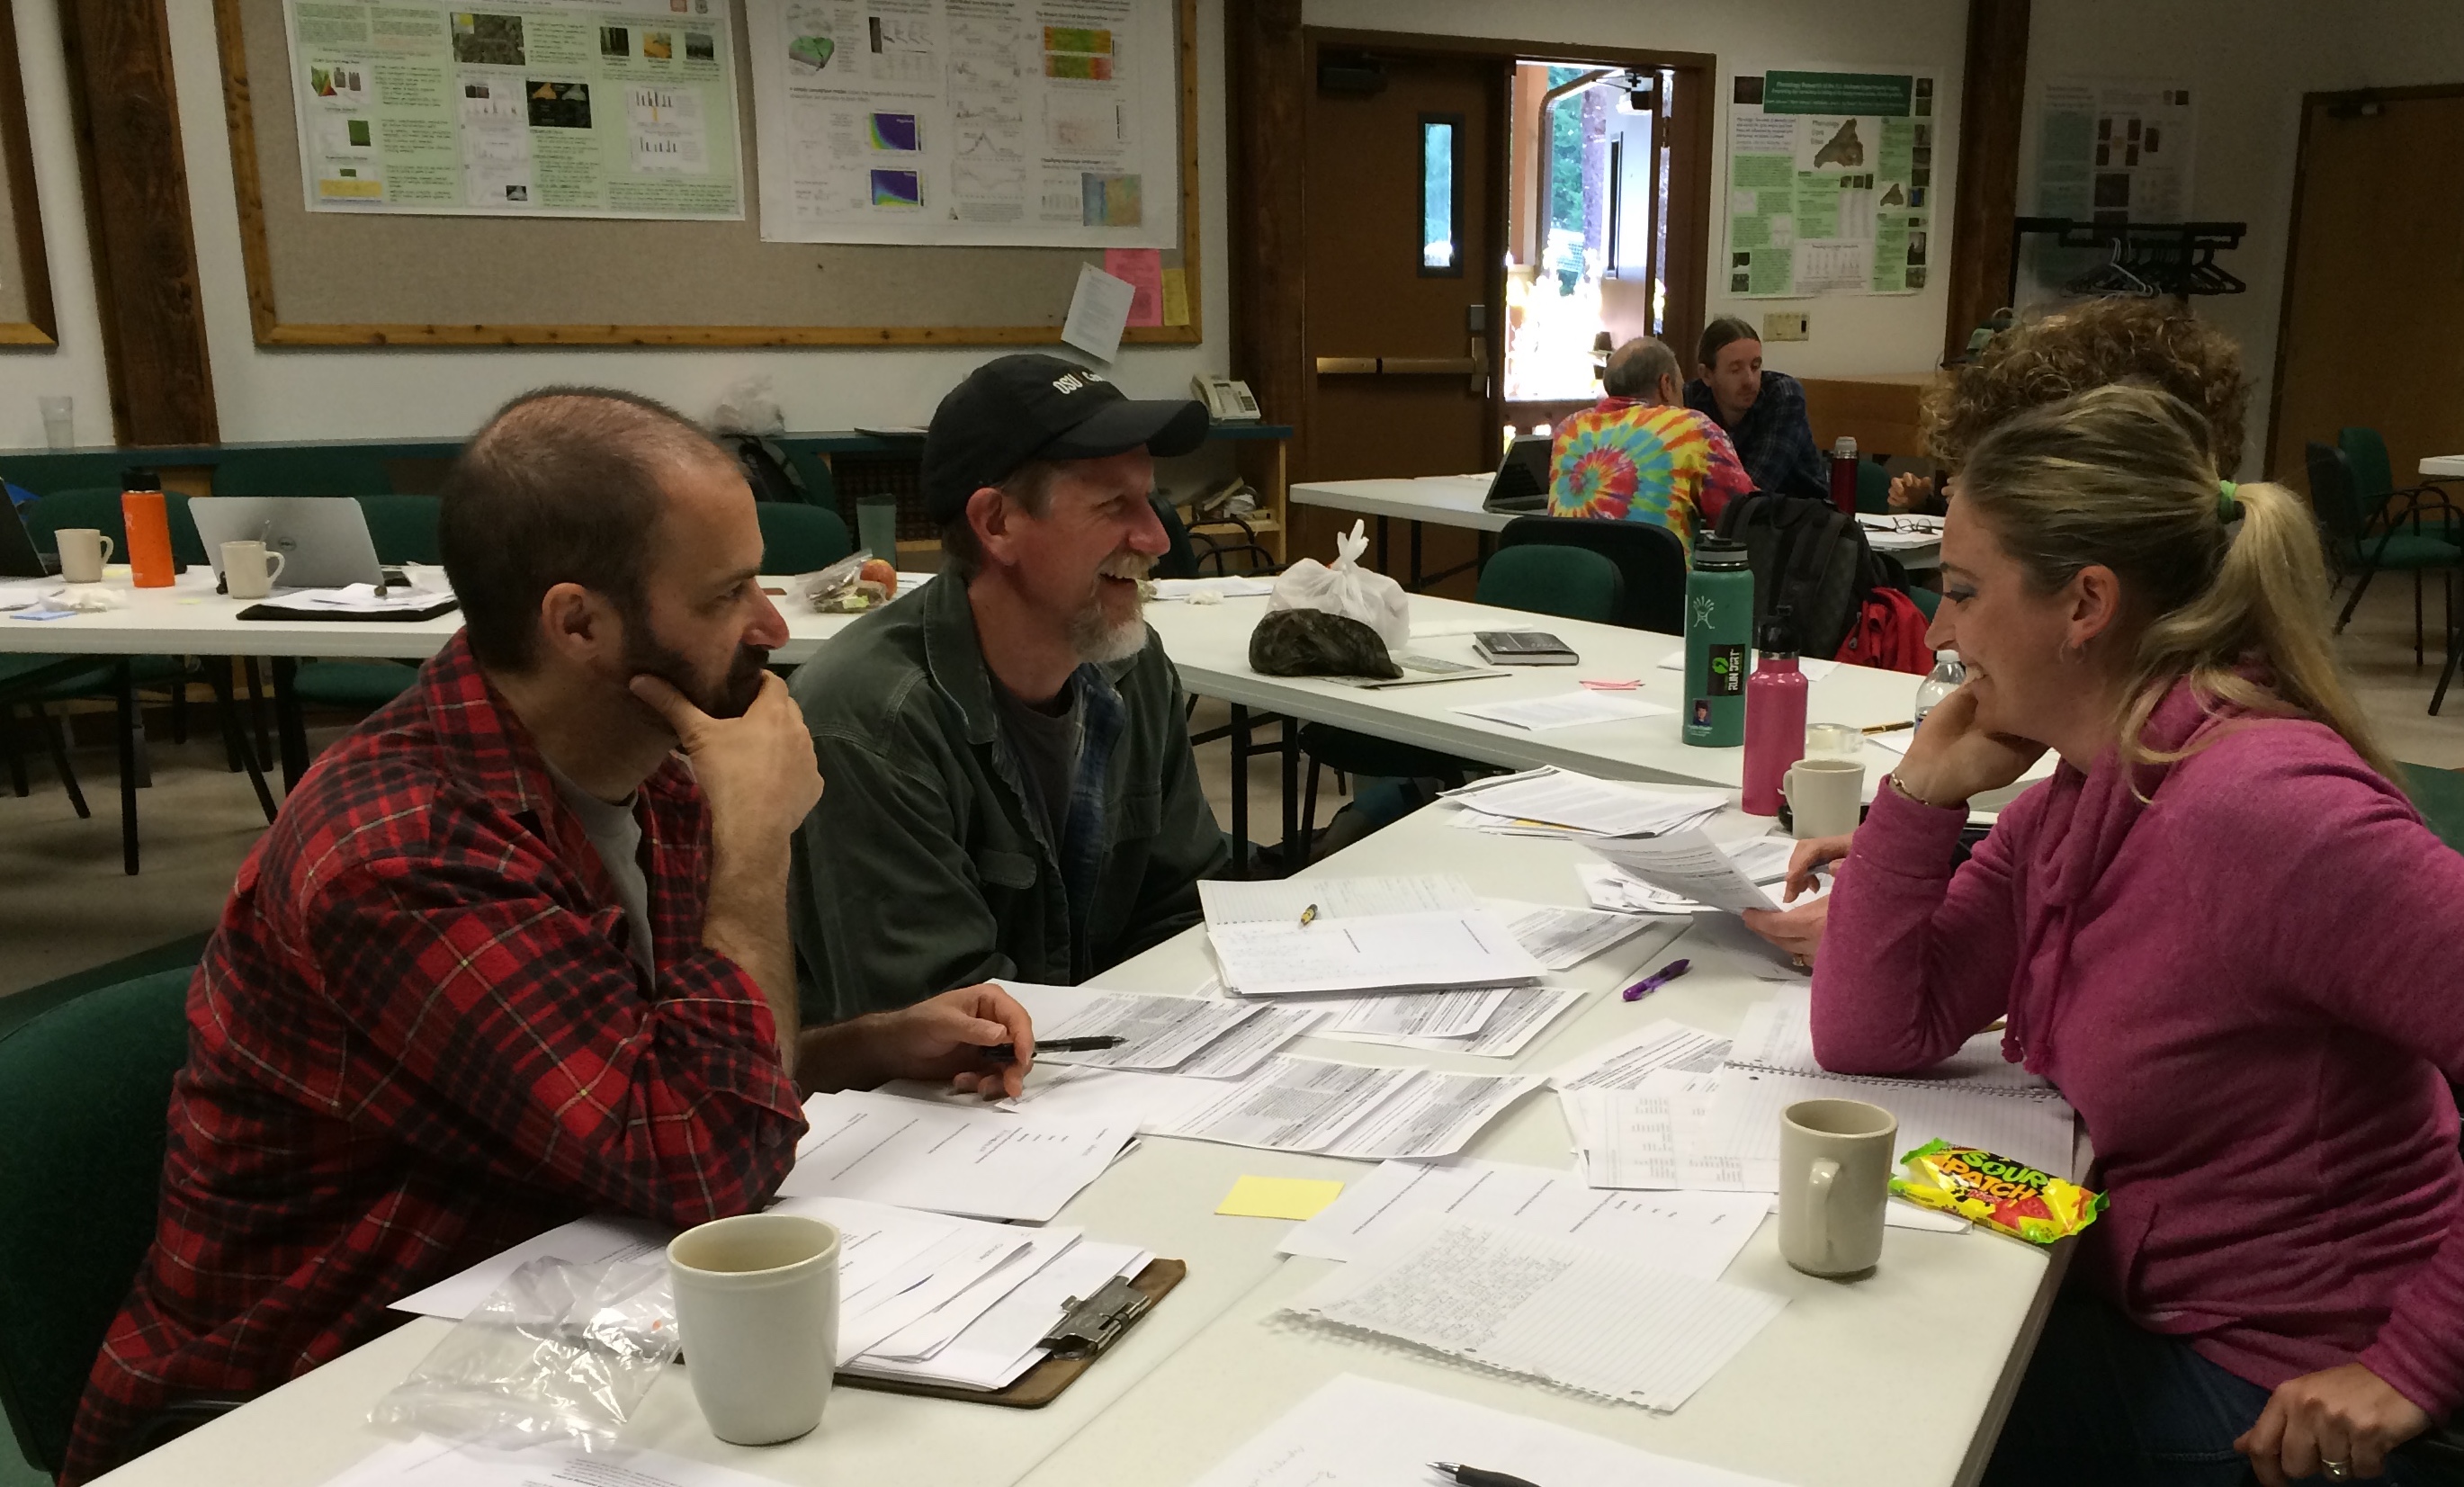
Throughout this project, participants spent considerable time on first defining data literacy (see Appendix B in Supplementary Resources) and then on working through teaching practices that can foster data literacy. In the data literacy conversations (Figure 1), participants wrestled with what it means to be data literate and what data skills an average student needs to be successful upon high school graduation. Although the process generated an extensive list of components, the conversations facilitated a common language for the group to discuss data. As described in the next section, teachers received instruction on data literacy pedagogy, as well as considerable practice in using data to discern explanatory stories of places and phenomena. Our intention with the project was to focus as much time and effort as possible on collaboratively looking at and preparing authentic data sets for student-friendly analysis so that both teachers and students could appreciate data literacy as a tool that gives them access to the richness of the natural world, rather than as a technical skill that is inaccessible to all but the most mathematically talented.
Figure 1
Teachers and scientists work together to define data literacy and consider implications for instruction. From left to right: MeriLe Glass, Dr. Alba Argerich, Jake Zywicke, Lisa Kelly, Leilagh Boyle, and Dr. Ivan Arismendi.
Contextualization and data stories
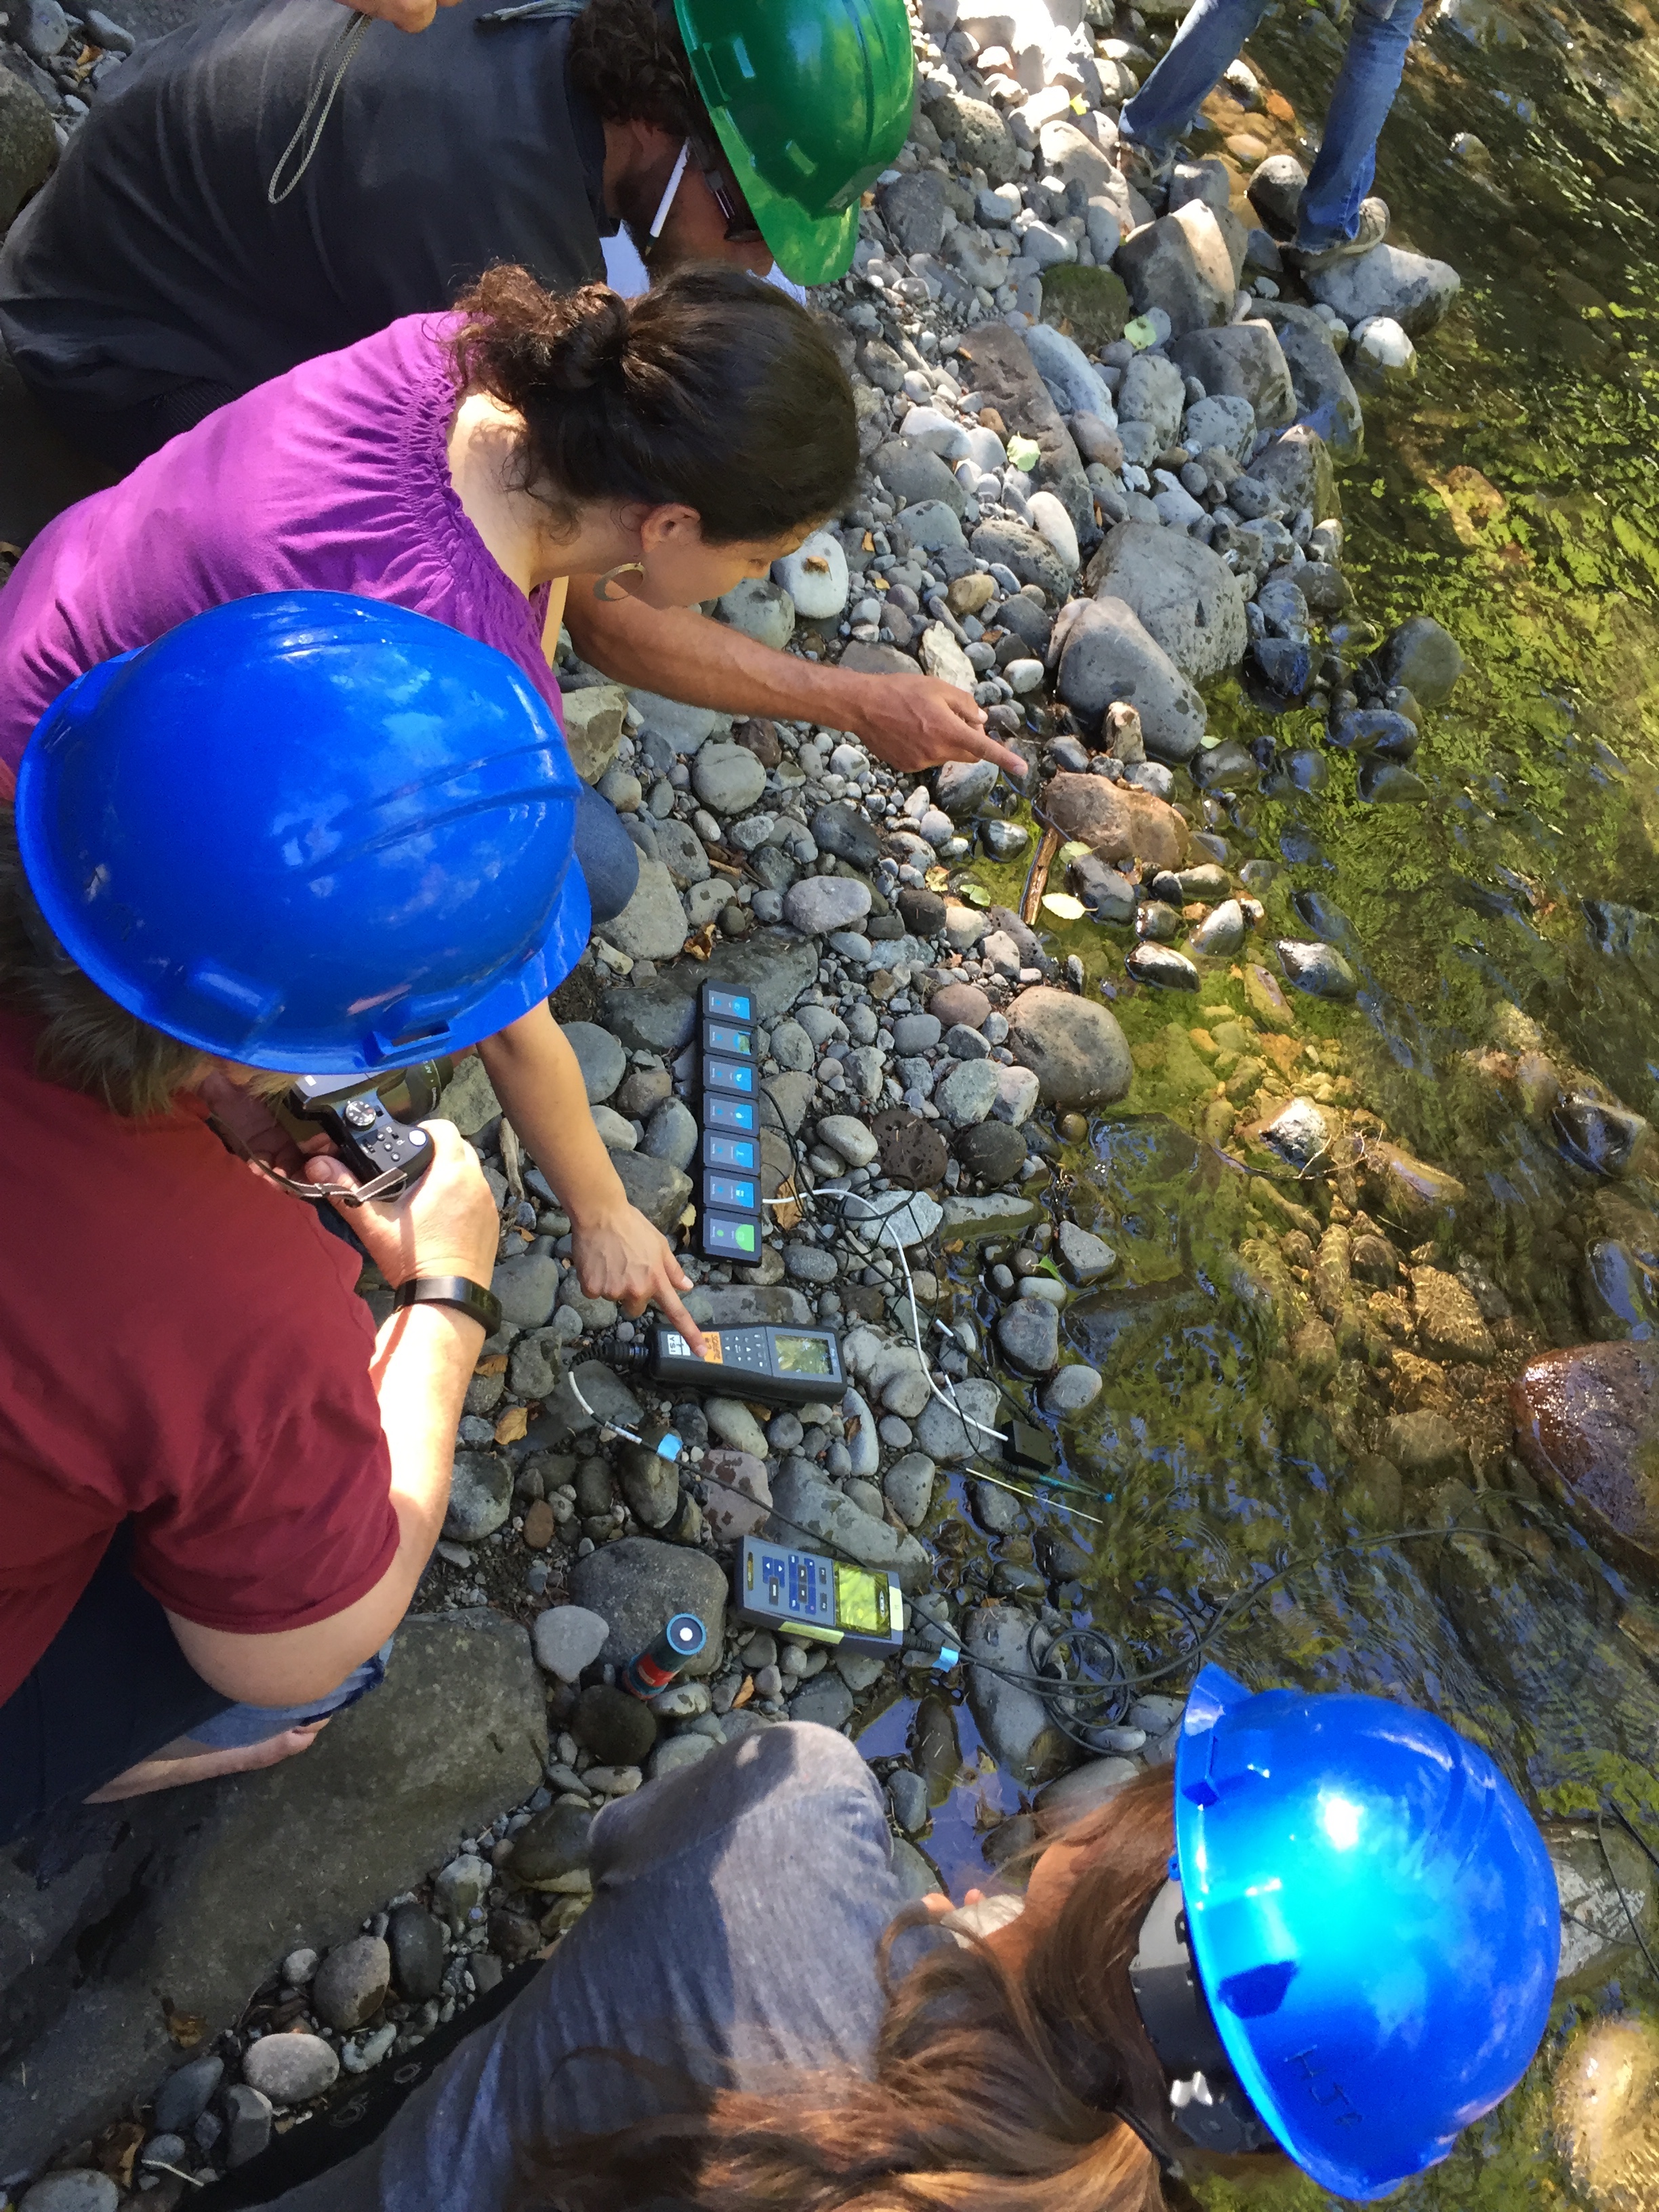
Connecting abstract data to a real context where that information is relevant, applicable, and situated in a narrative requires the cognitive process of contextualization (Giamellaro 2017). From a learning perspective, there is a profound difference between the learner experiencing the context firsthand (primary contextualization) versus experiencing it through a secondhand source (secondary contextualization), such as a narrative, video, or textbook (Giamellaro 2014). The NiNMoM project built in time for teachers to make sense of data through both primary and secondary contextualization. For example, teachers learned to tell the data story of carbon sequestration at HJA (see Appendix C in Supplementary Resources for additional description of HJA). They worked with mathematical models that project scientists use to calculate forest carbon sequestration (Figure 2) as a function of environmental and genetic variables. Teachers also measured the woody mass of a forest plot (Figure 3). At HJA, teachers were able to have the visceral experience of wrapping their arms around the giant Douglas firs and seeing the relatively tiny Pacific yew scratch out a living in the low light of the understory. The data were transformed from abstract representations of carbon budgets to stories of living organisms. Teachers could more easily see themselves as part of those stories when they walked through the physical places the data represented.
Figure 2
Dr. Alba Argerich shows teachers how her lab collects in situ stream data (A), which they then use for a student-friendly mathematical model of carbon movement in the stream (B).
A.
B.
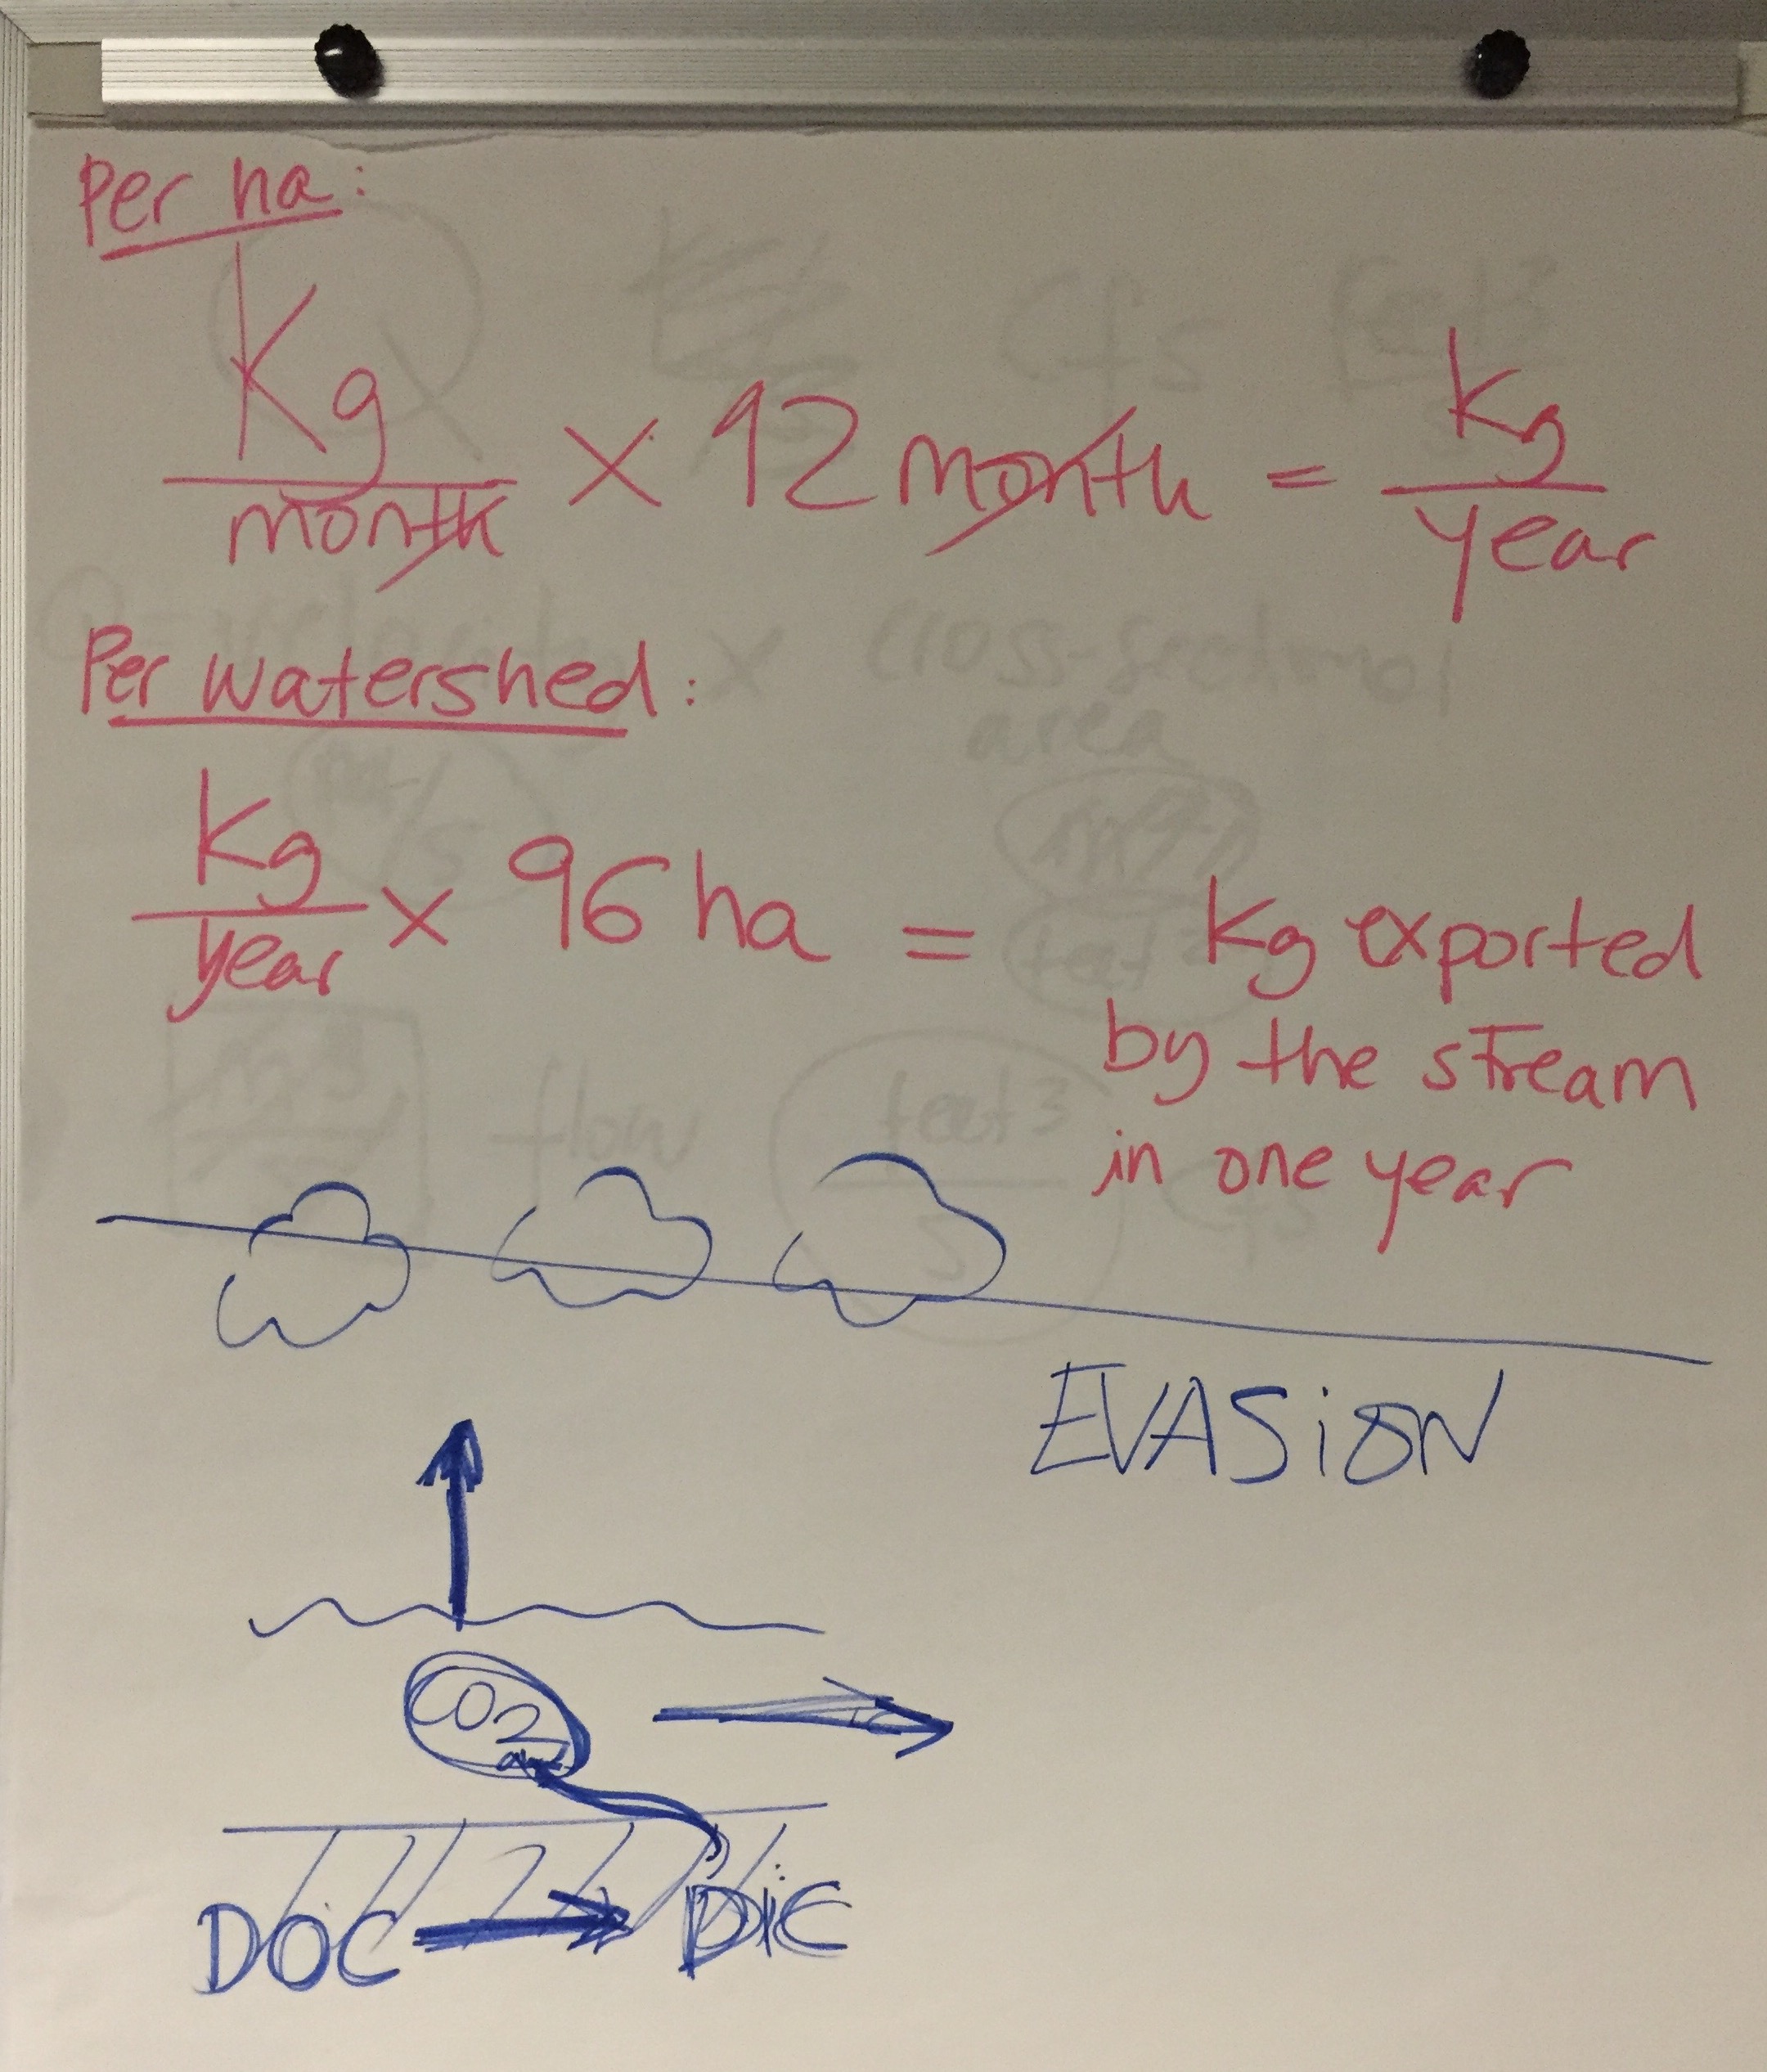
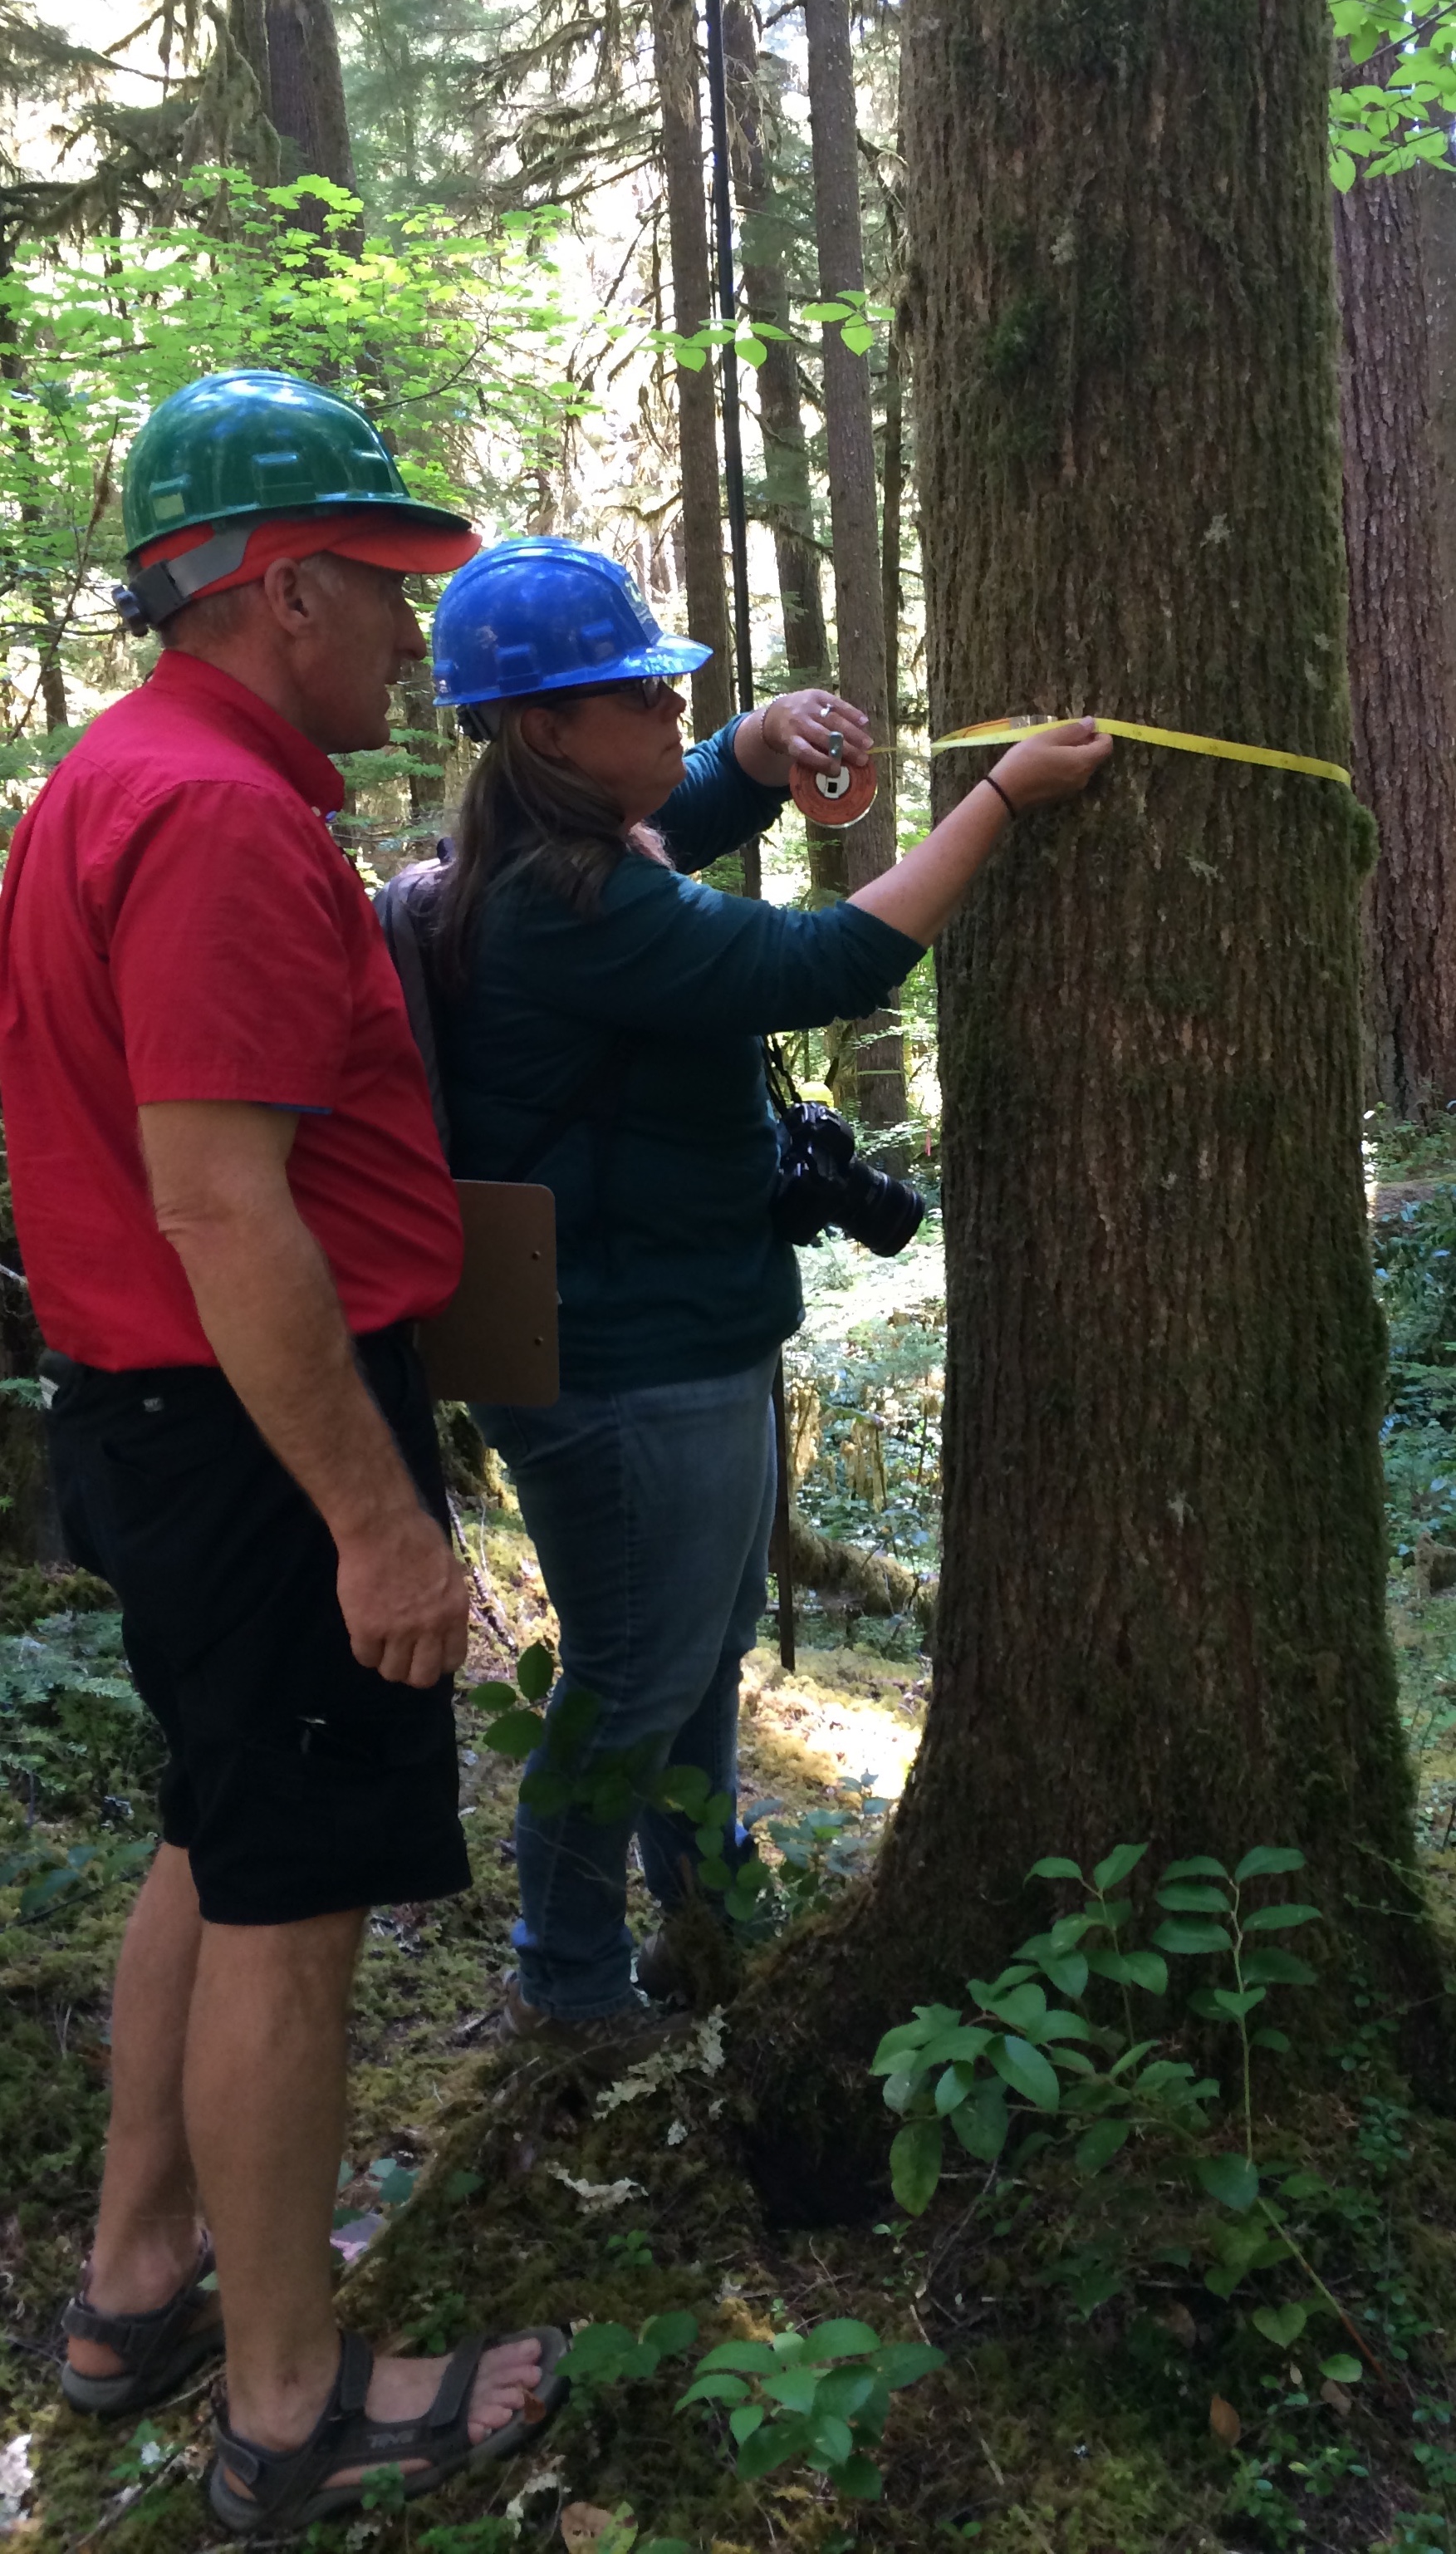
Figure 3
Participants Mark Hubler and Dr. Melinda Knapp measure diameter at breast height to later calculate carbon sequestration within a plot in the H.J. Andrews Forest.
Teachers could look at scientists’ diagrams and graphs that show how temperature and carbon vary in a stream as it flows underground and then resurfaces, and then directly observe the phenomenon in the field. They could see charts showing carbon movement through an experimental watershed that had been clear-cut 50 years ago alongside charts for an otherwise identical watershed that had been left as an old-growth control. They learned to read the story told by 50 years of data, but then could also connect it to real places they had now visited and fully experienced. The data became contextualized. A place can become a setting that connects otherwise disconnected phenomena. In this case, teachers saw that carbon is not just something found in the trees, but also a character that we can see in the data stories of the plants, animals, geology, hydrology, atmosphere, and climate. The data become a tool to test a hypothesis and a rich thread to tie together the natural world, often in the language of mathematics.
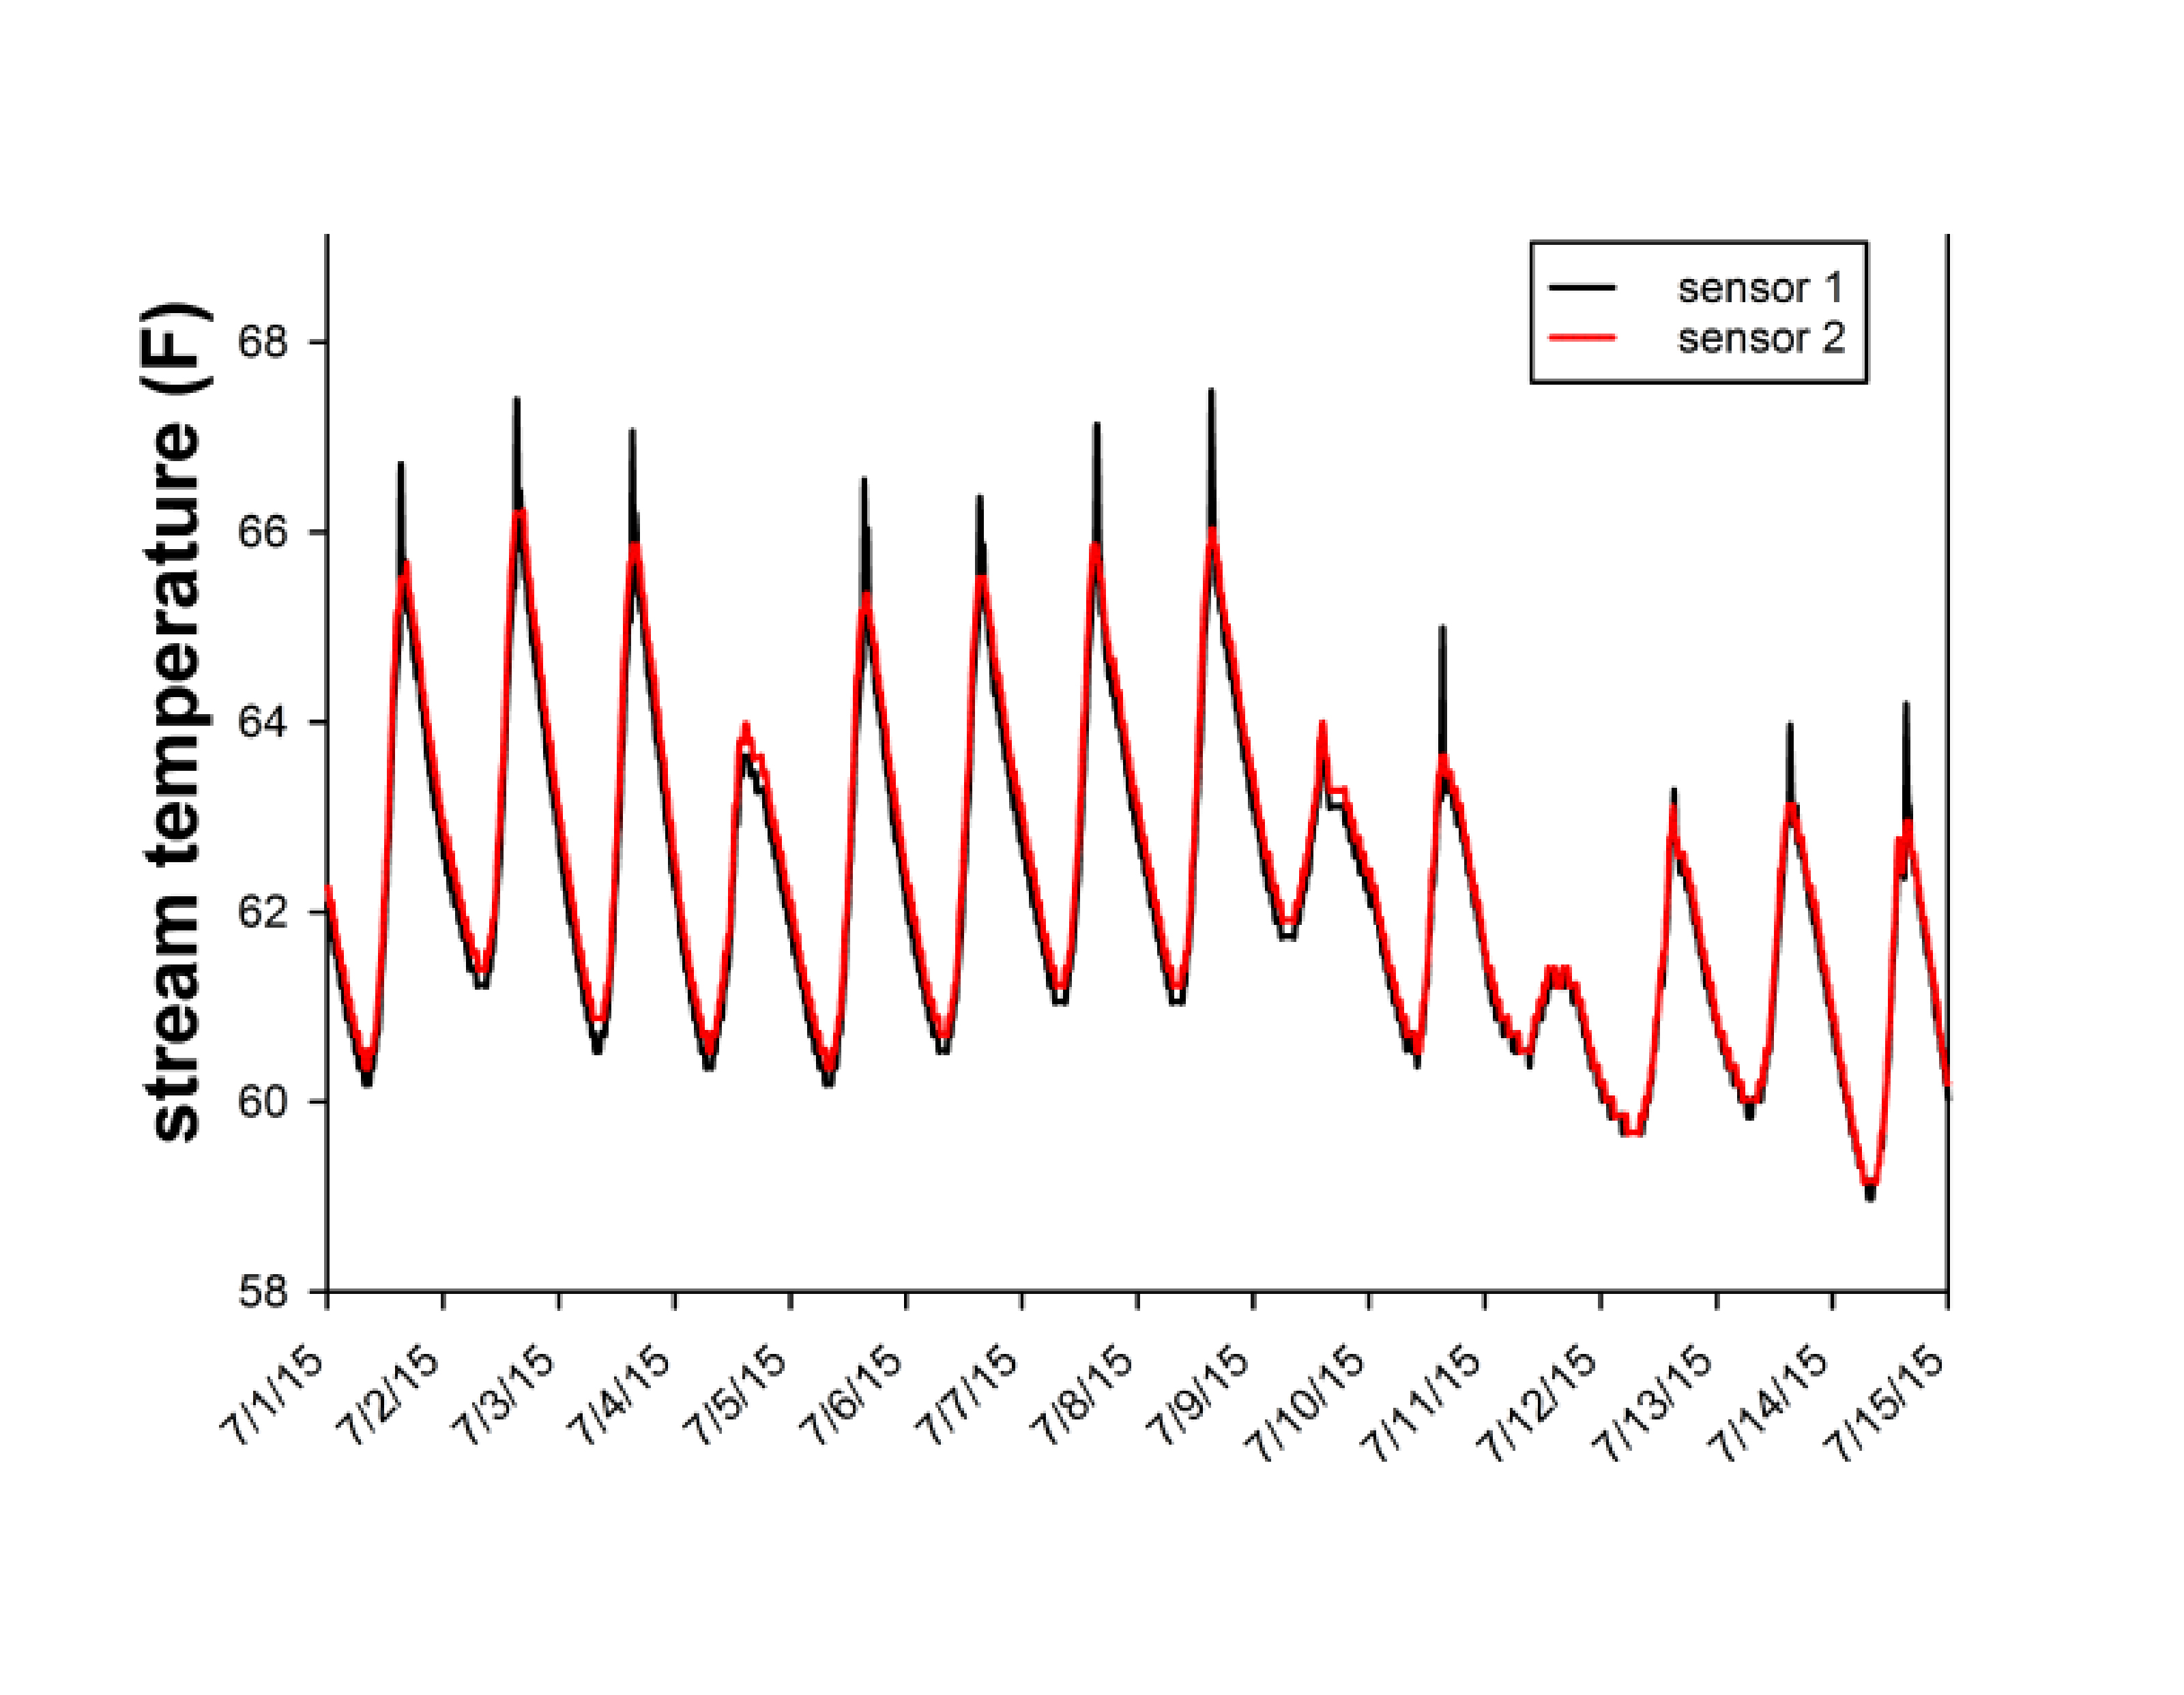
Figure 4
Teacher participants Leilah Boyle and Jessica Flood work with Dr. Ivan Arismendi to collect field data through electrofishing at the HJA (A). By comparing these organism count data to temperature data (B), teachers were able to decipher the relationship between these variables and share the data story with students.
A.
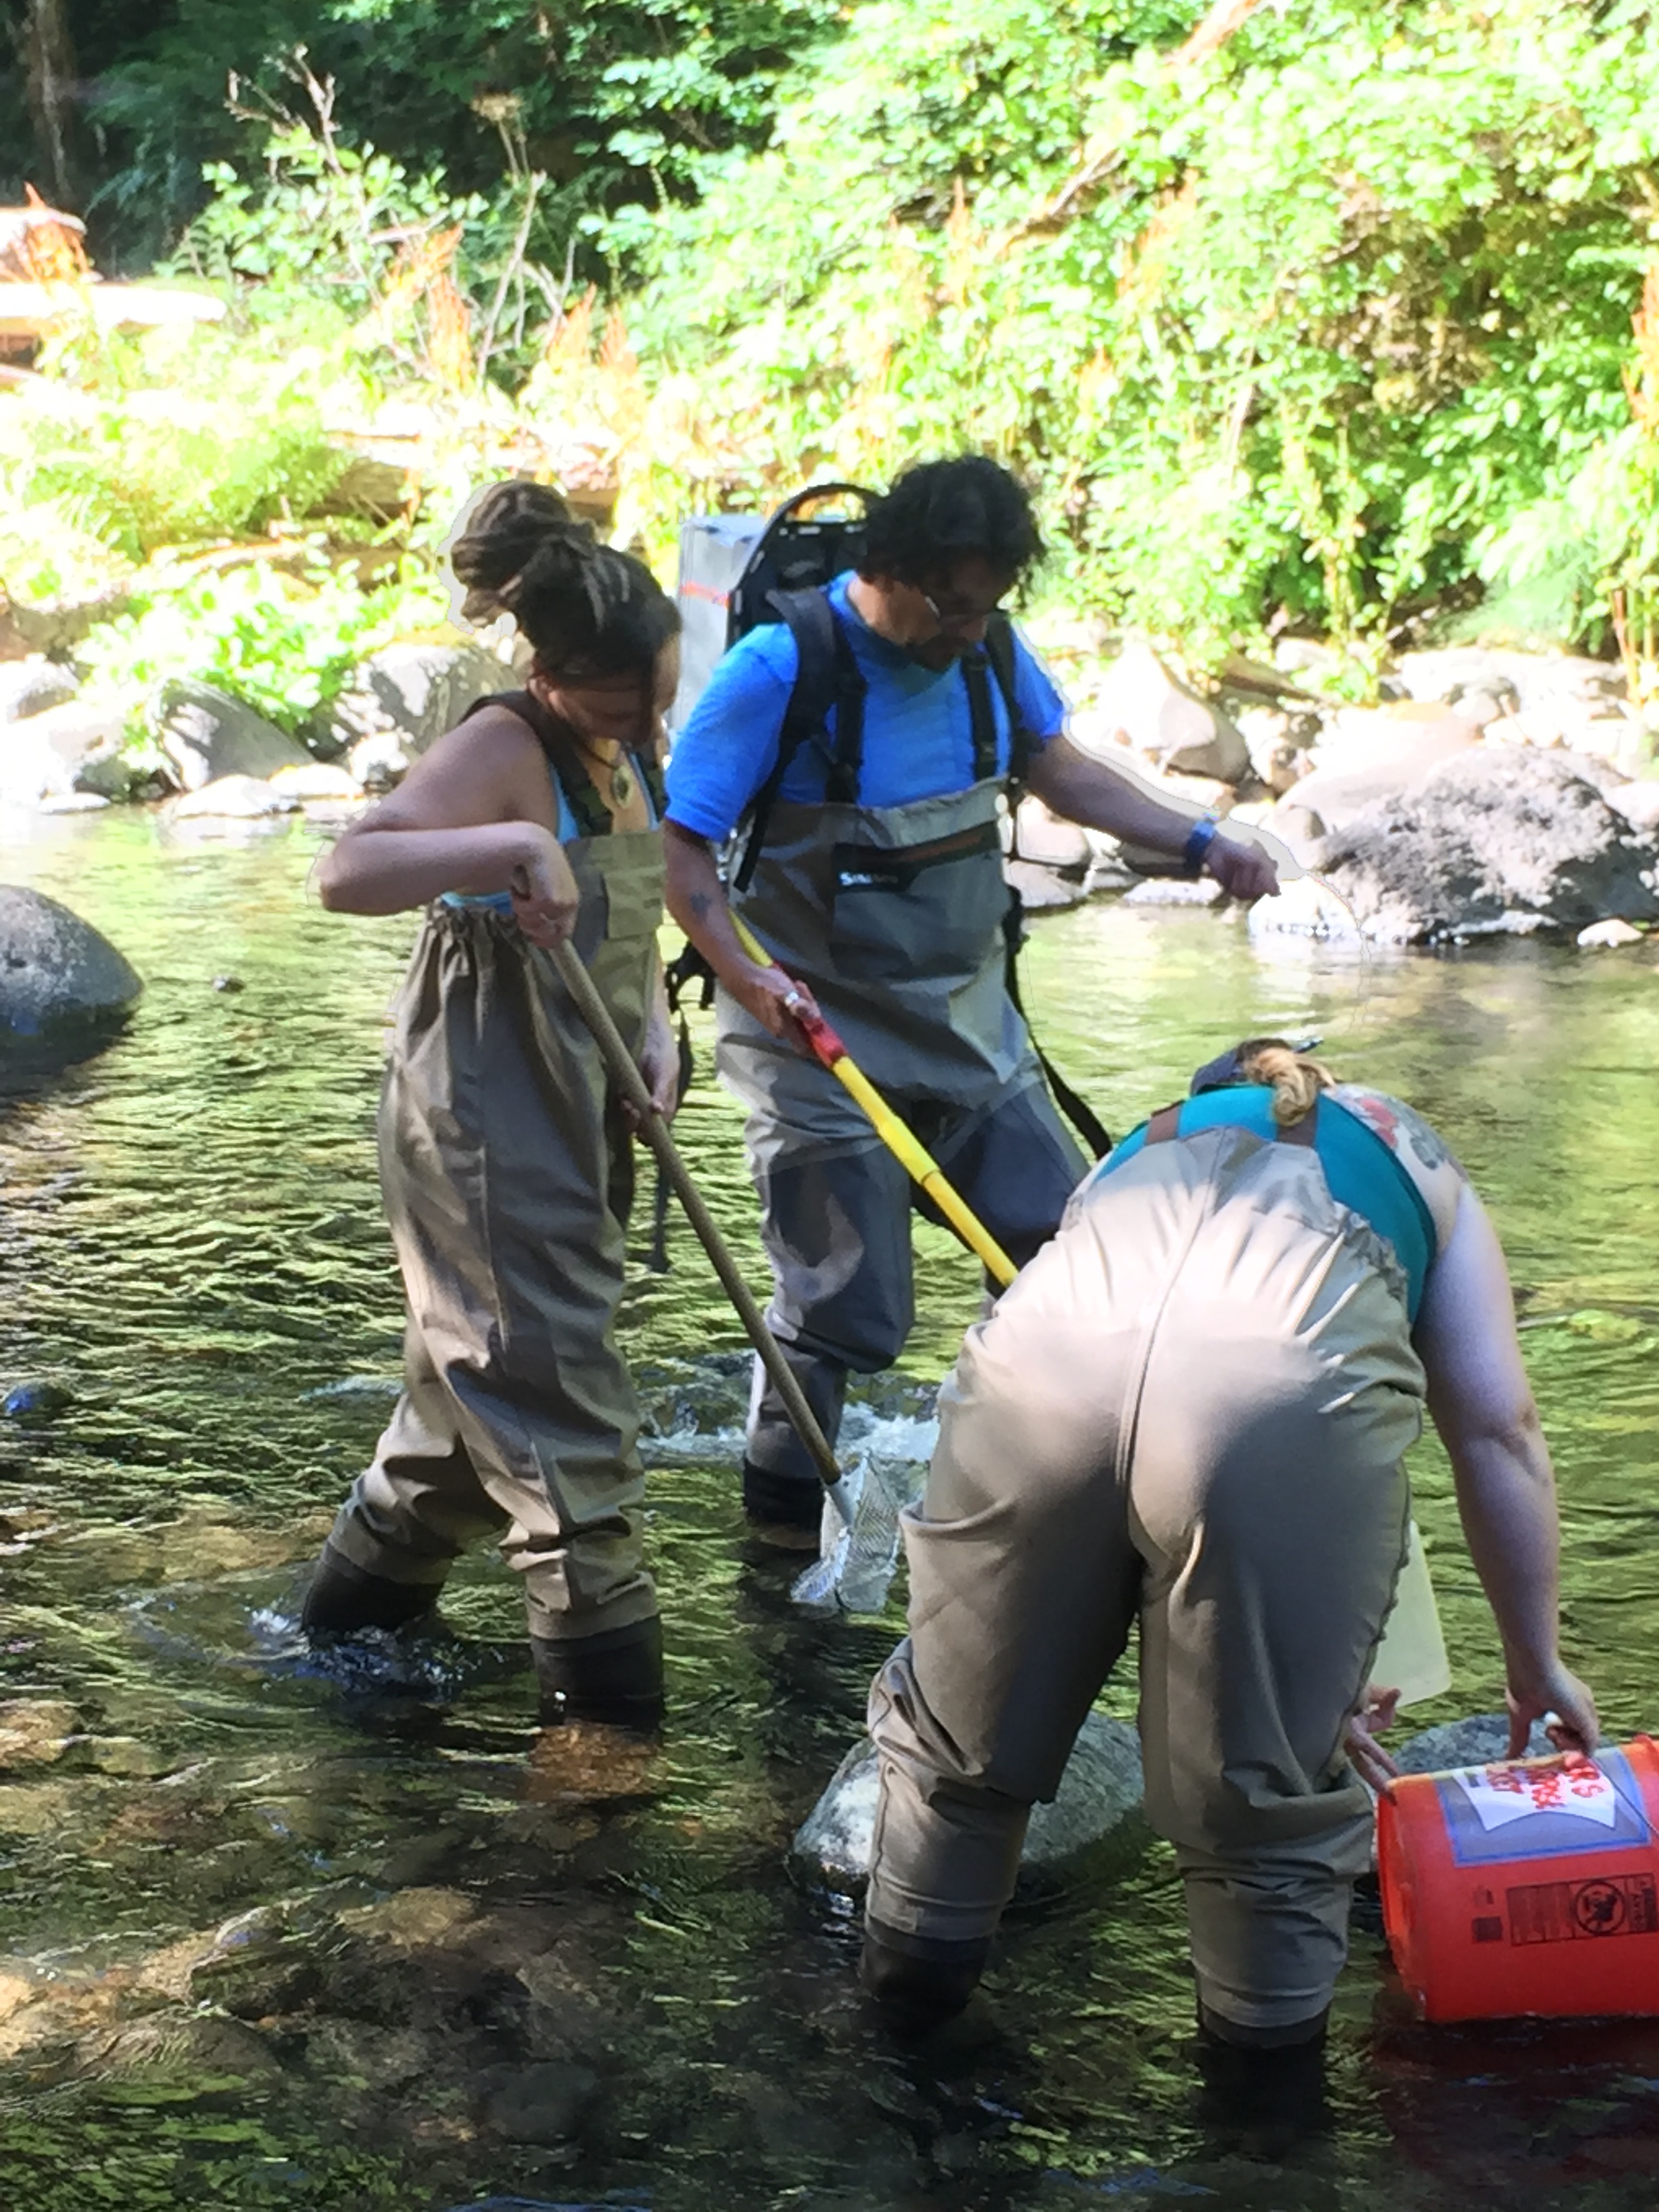
B.
As the project transitioned from its focus on HJA to Mt. Bachelor, teachers could quickly see how the locations were inextricably tied together through the data stories of carbon, water, and atmospheric chemistry (see Appendix D in Supplementary Resources for an additional description of the Mt. Bachelor experience). Connecting the depth of snow at a ski resort (Figure 5) to forest-harvesting practices on the other side of the mountains is a complex story, but one the participating teachers can now tell.
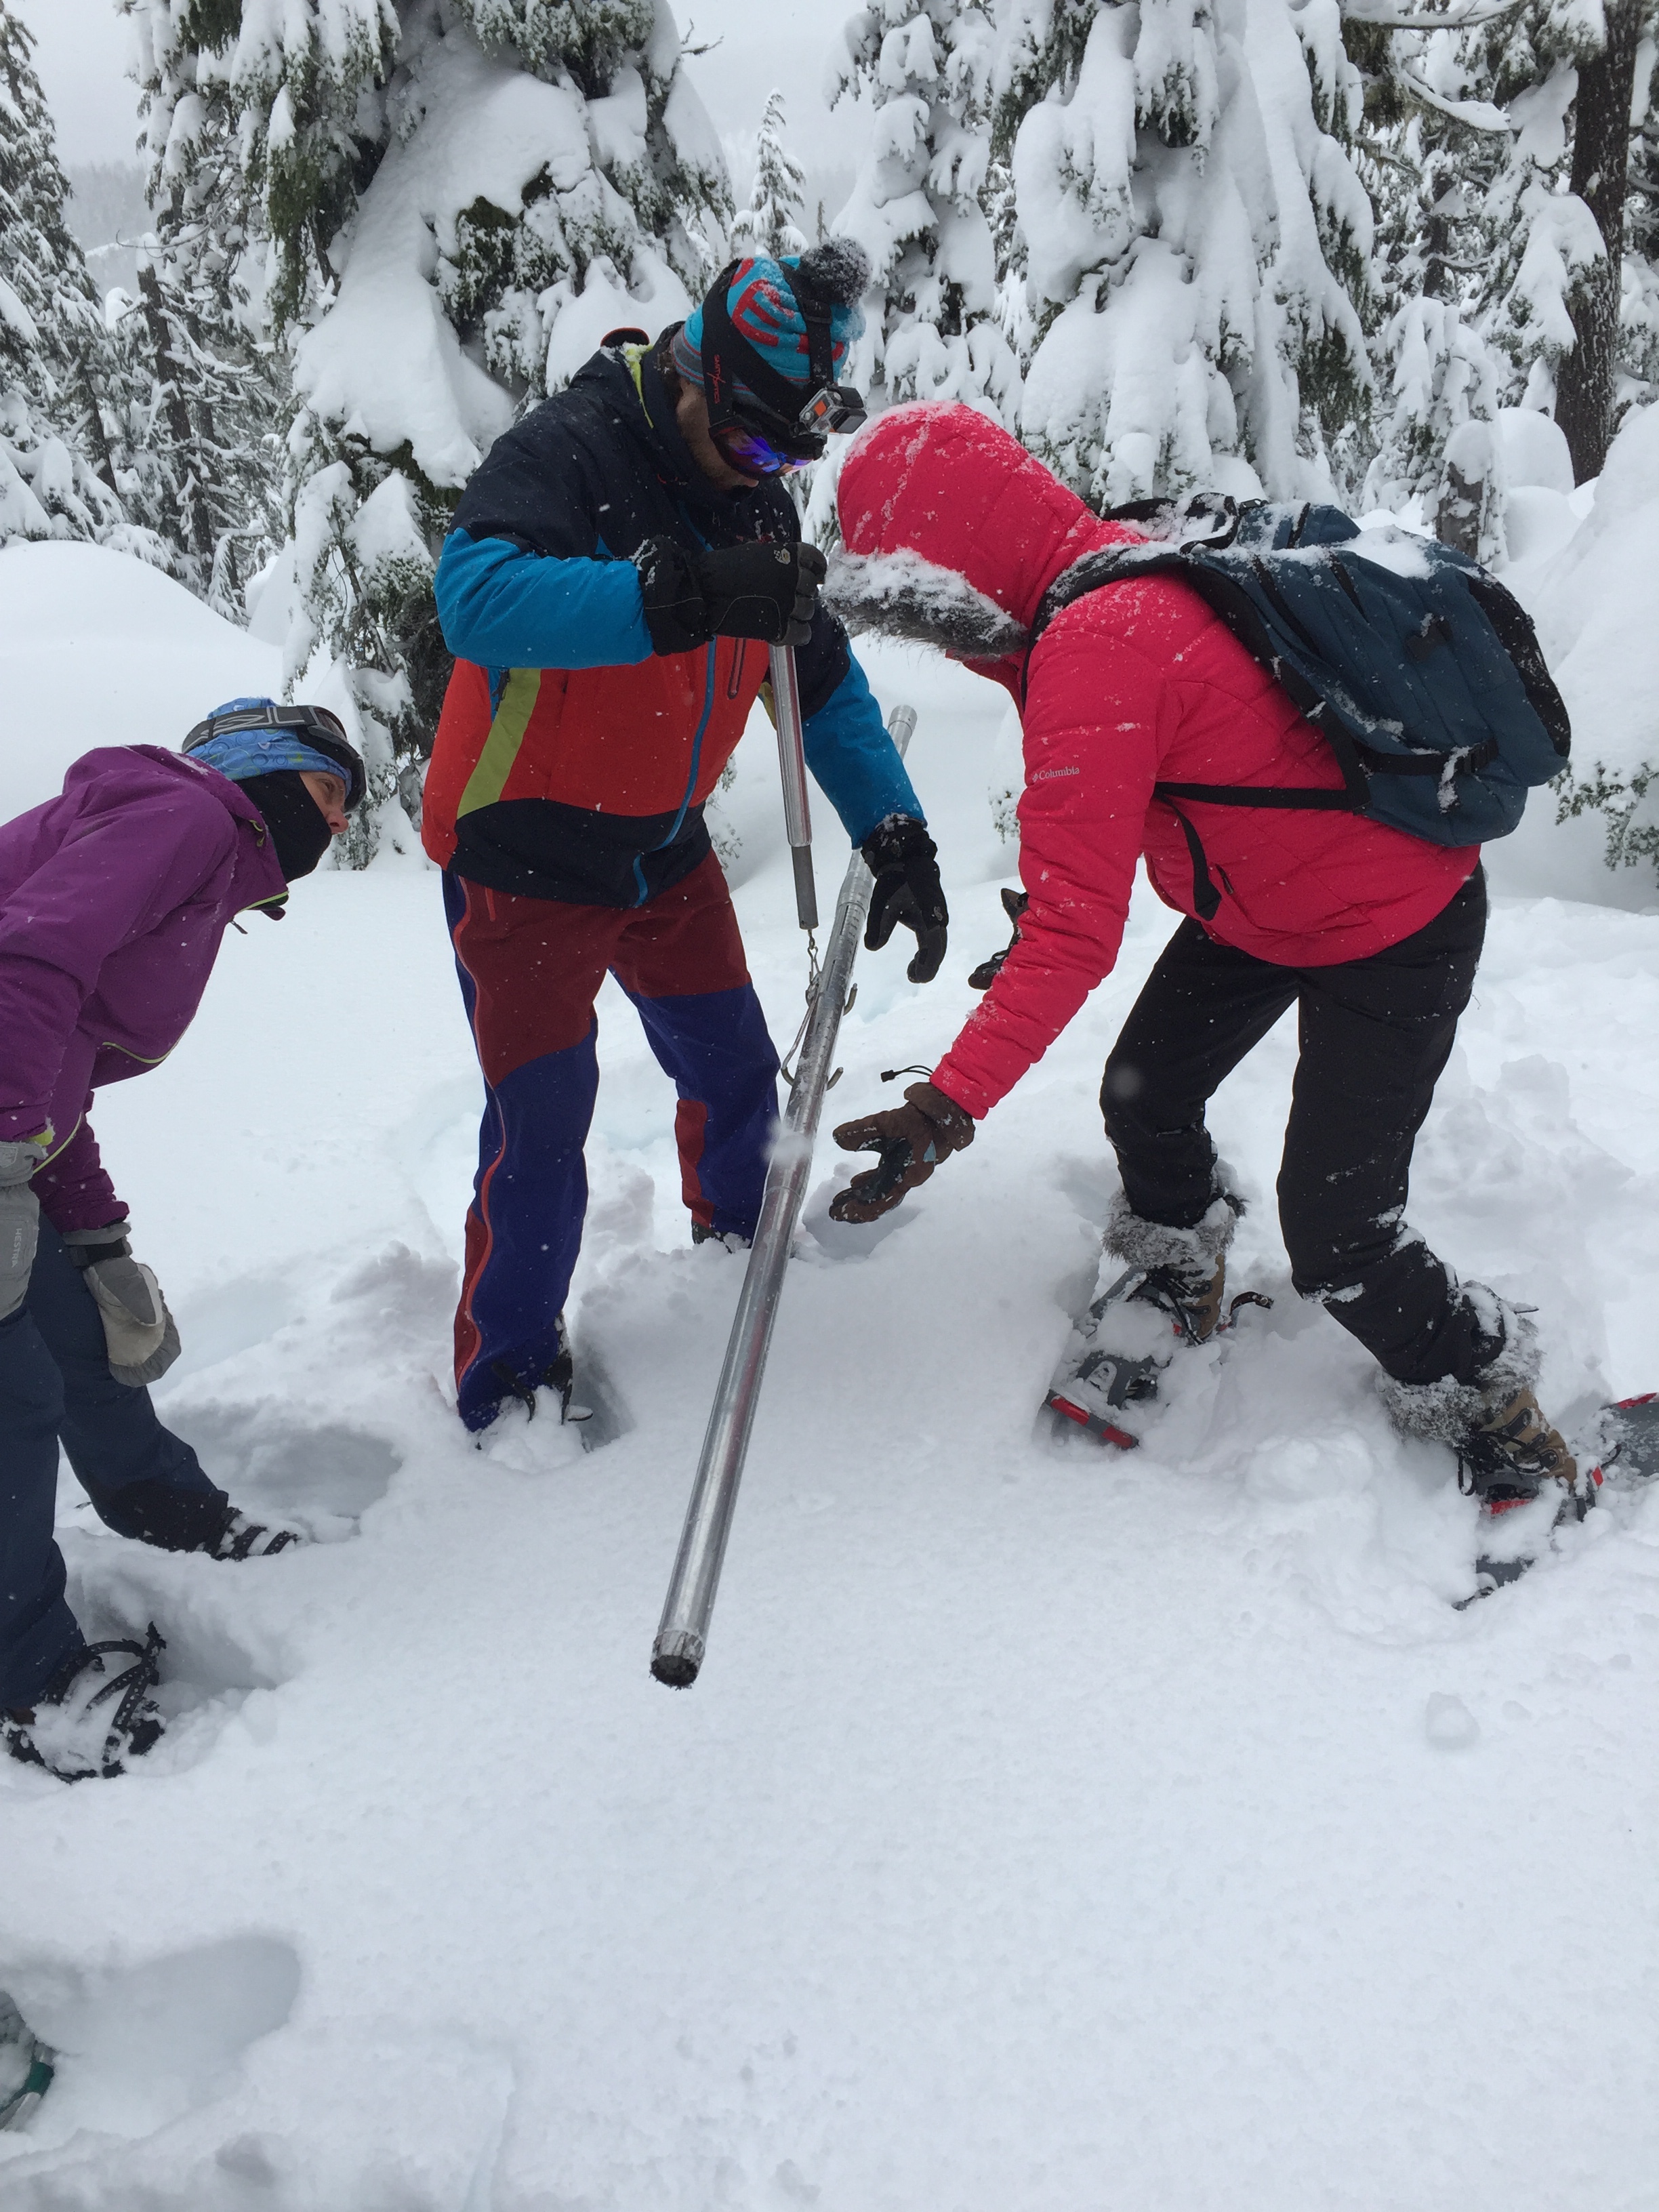
Figure 5
Teachers Lynda Beauchamp, Jake Zywicke, and Sallie Nigg weigh a snow core sample at Mt. Bachelor to calculate snow water equivalence.
These field experiences are now part of these teachers’ individual narratives but not necessarily their students’. Although some of the teachers provided primary contextualization experiences for their students through local field studies, most teachers could not bring their students to HJA for their own primary experiences. Teachers needed to rely on secondary contextualization to bring the data stories of HJA and Mt. Bachelor to their students. The teachers had rich data stories of those places, and project coordinators wanted to provide them with the curriculum tools to support those narratives. To this end, teachers carried GoPro cameras during the field site visits to record their unfolding experiences. The education researchers later edited the videos to isolate higher-quality segments that highlight the key events and concepts of those experiences. Teachers can share with their students two- to three-minute edited video segments of how they collected field data (e.g., streamflow, woody mass, carbon evasion, soil structure, snow-water equivalence, air particulate matter), and students can see some secondary contextual detail about the scenes in which these data stories unfold. There is also an interview video for each of the scientists. A project goal was to position teachers to tell a series of detailed data stories that connected to form a narrative about a single place and ideally, one that could be compared to a place known by students.
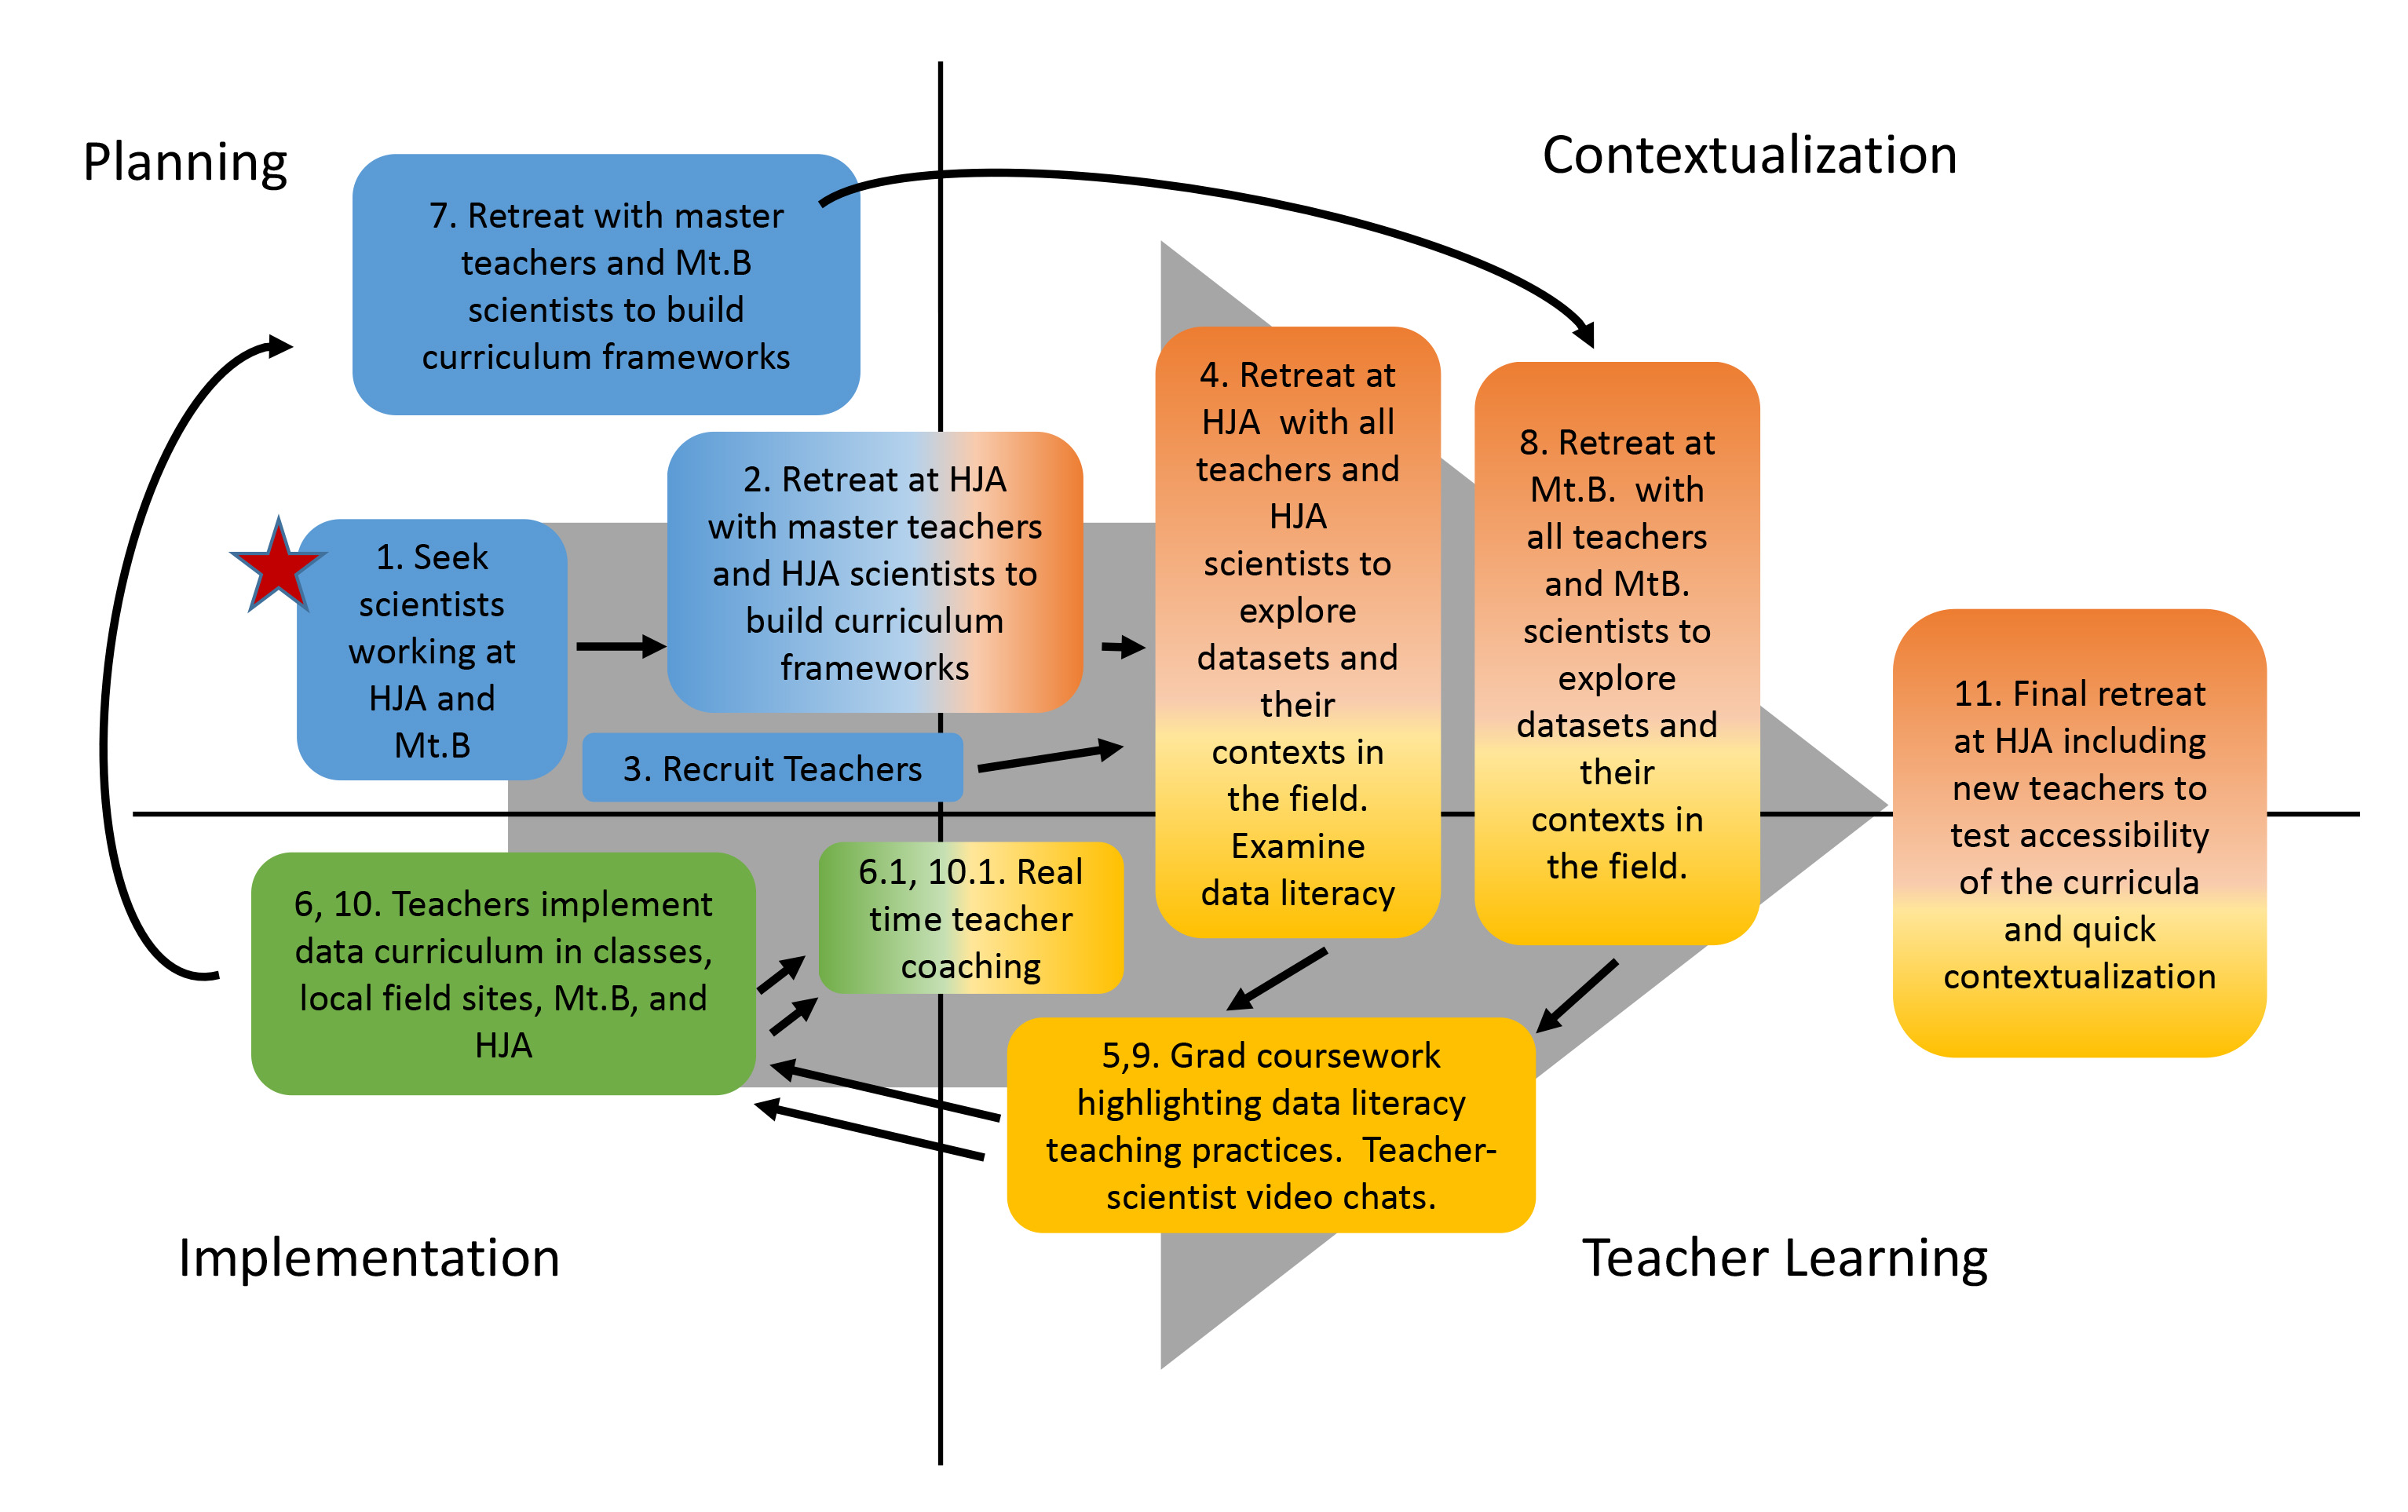
Structure of the project
In designing NiNMoM, project coordinators worked backward from the goal of students developing data literacy skills through contextualized data sets. We reasoned that to do so, we would need robust curricula that teachers deeply understood and could align with what they were already doing in the classroom, and that were driven by authentic data collected in compelling places by scientists. Because the grant project had to be complete within one and half years, project coordinators created a spiraling process of planning, field work, graduate coursework, and teacher implementation, as outlined in Figure 6. The project coordinators used a design-based research approach, which uses an ongoing cycle of data collection and revision rather than a hypothesis-testing process (Anderson and Shattuck 2012), to improve and iterate as we moved forward. This was particularly important for making the experience useful and relevant to teacher participants. As shown in Figure 6, the project process consistently moved between planning the next steps, providing teachers with opportunities to contextualize their growing understanding of germane science content, providing direct instruction to teachers on data literacy practices and supporting science content, and supporting teachers in implementing their curriculum in as contextualized a way as possible through coaching and curriculum guidance.
Figure 6
The NiNMoM project followed a spiraling path through two cycles of planning, contextualization, teacher learning, and implementation. A series of retreats at the HJA site and Mt. Bachelor provided participants time to work together and experience sources of data. Teachers continued to work with project scientists through implementation in the classroom and were supported in the classroom through coaching by project coordinators.
Prep work
Scientists were recruited by word-of-mouth and were all known to the project coordinators. We sought scientists whose work included data collection at HJA or Mt. Bachelor, data that told clear stories about those places, and data that might be accessible to K–12 students. Scientists also needed to have the willingness and ability to communicate the content background in their science disciplines at a K–12 level.
Project coordinators worked with the partner scientists to find stories in their data that would support the NGSS and CCSS. We identified clear connections to the standards in grades 4–12, and we were unsuccessful in finding robust connections to grades K–3 standards. This process was easier for the NGSS than it was for the CCSS mathematics standards. Scientists reported being overwhelmed at the sheer number of math standards and did not see many connections to the mathematical work they did. We did not want to create inauthentic scenarios that did not reflect the actual work and data of the scientists (such as a geometry problem situated in the HJA context but irrelevant to the scientists’ work), but the CCSS focus relatively little attention on the probabilities and statistics that are at the heart of how the scientists use their data.
The project coordinators recognized that scientists needed more support to understand mathematical learning progressions and how the CCSS builds at each grade level to inform the complex mathematics used in science. Additionally, the project approach started with the science standards, which were then unpacked to identify the mathematics embedded in a given scientist’s work. In future iterations, it may be more fruitful to first identify the key mathematical standards associated with data literacy at a given grade level and then recruit scientists whose work clearly reflects these ideas, understanding that it will be easier to find germane connections to the NGSS as a second step. This may include applications of geometry and trigonometry as used in spatial data visualizations.
Planning retreat
After project coordinators identified the generalized data stories aligned to the content standards for each grade level, we brought together the six participating HJA scientists (Figure 7) and five master teachers for a two-day retreat at HJA to identify where the preselected data sets and teachers’ and students’ needs came together. The master teachers included two elementary, one middle school math, one middle school science, and one high school science teachers, all experienced in teacher–scientist partnerships and contextualized teaching. Master teachers led some of the later work at the two all-teacher retreats and provided feedback on developing ideas within the NiNMoM project work before introducing the ideas to the larger group. They received a modest stipend, and substitute teachers were paid for by the grant.
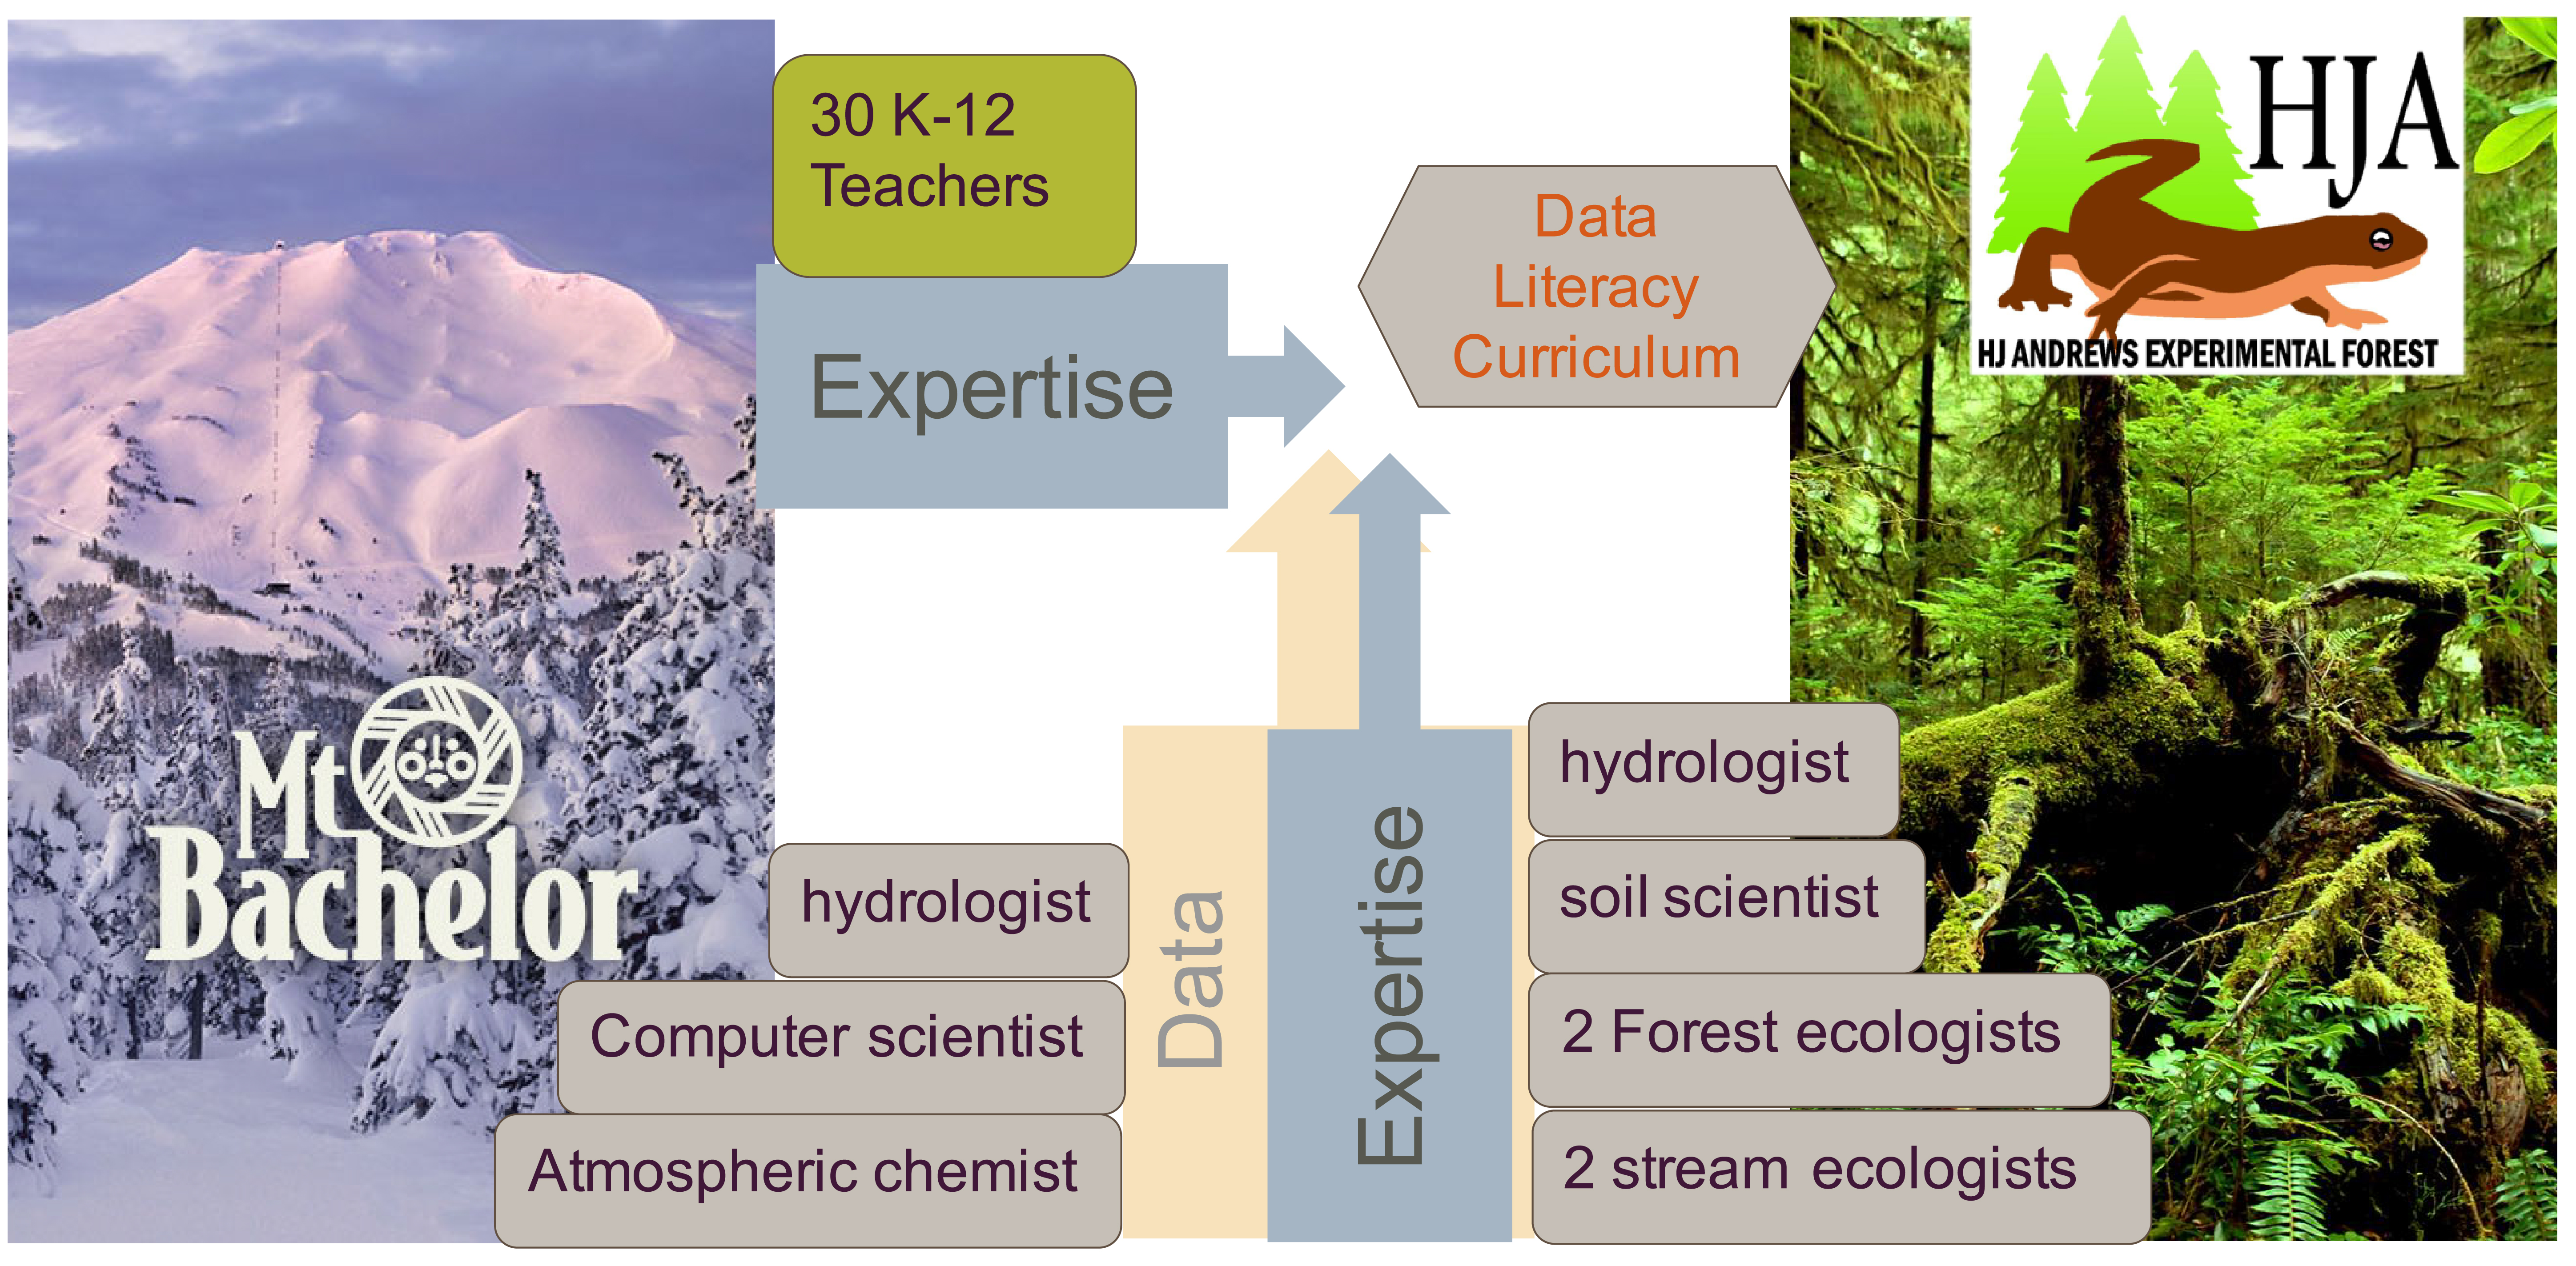
Figure 7
The NiNMoM project brought together the expertise of teachers, project coordinators, and various scientists to use place-based data in building curricula for students in grades 4 through 12.
During the planning retreat, master teachers and scientists gave presentations on what their day-to-day work looks like, met in small groups to unpack grade-level standards (Figure 8), looked through data sets together, visited the scientists’ field sites together, and worked to define data literacy and identify data skills important for scientific work. Together, all participants further clarified scientists’ data sets that told clear stories of NGSS-aligned phenomena and/or could be analyzed with grade level–appropriate math and science practices. Importantly, the master teachers and scientists shared meals and stayed together at HJA’s research facilities, breaking down perceived barriers between the professions.
Figure 8
From left to right, scientists Dr. Mark Schulze and Dr. Ron Reuter work with teachers Lisa Kelly and Kim Bartolotti to discuss the concepts behind NGSS standards germane to the scientists’ data stories.
By the end of the retreat, the scientists and master teachers built loose curriculum frameworks (Figure 9) for all participating teachers to start from and planned the first summer retreat for all teachers at HJA. These frameworks were intended to help teachers see how data sets could be woven into a student-friendly and standards-based story without dictating specific lessons within a given classroom.
First teacher retreat
During a four-day, overnight summer retreat at HJA, 29 teachers and 6 scientists worked together to fill in the frameworks (Figure 9) and data stories. They spent time in the field at the data collection sites, unpacked the standards (Figure 8), defined critical aspects of data literacy (Figure 1), learned specific teaching strategies for bringing these tools into the classroom (largely around modeling), and developed unit or lesson plans to be implemented in the coming year (see Appendix A). Scientists also modeled activities that they might use to teach the content. For example, soil scientist Ron Reuter shared a physical model that could be used to test slope failure as a function of slope angle and substrate. Elementary teachers later re-created this model in their classrooms and reported that students were deeply engaged in testing the variables (Figure 10.).
Figure 9
Curriculum framework format
Master teachers and scientists worked together to outline data stories as curriculum frameworks in this format. All teachers adapted these frameworks into more specific lesson sequences for use with their own classes.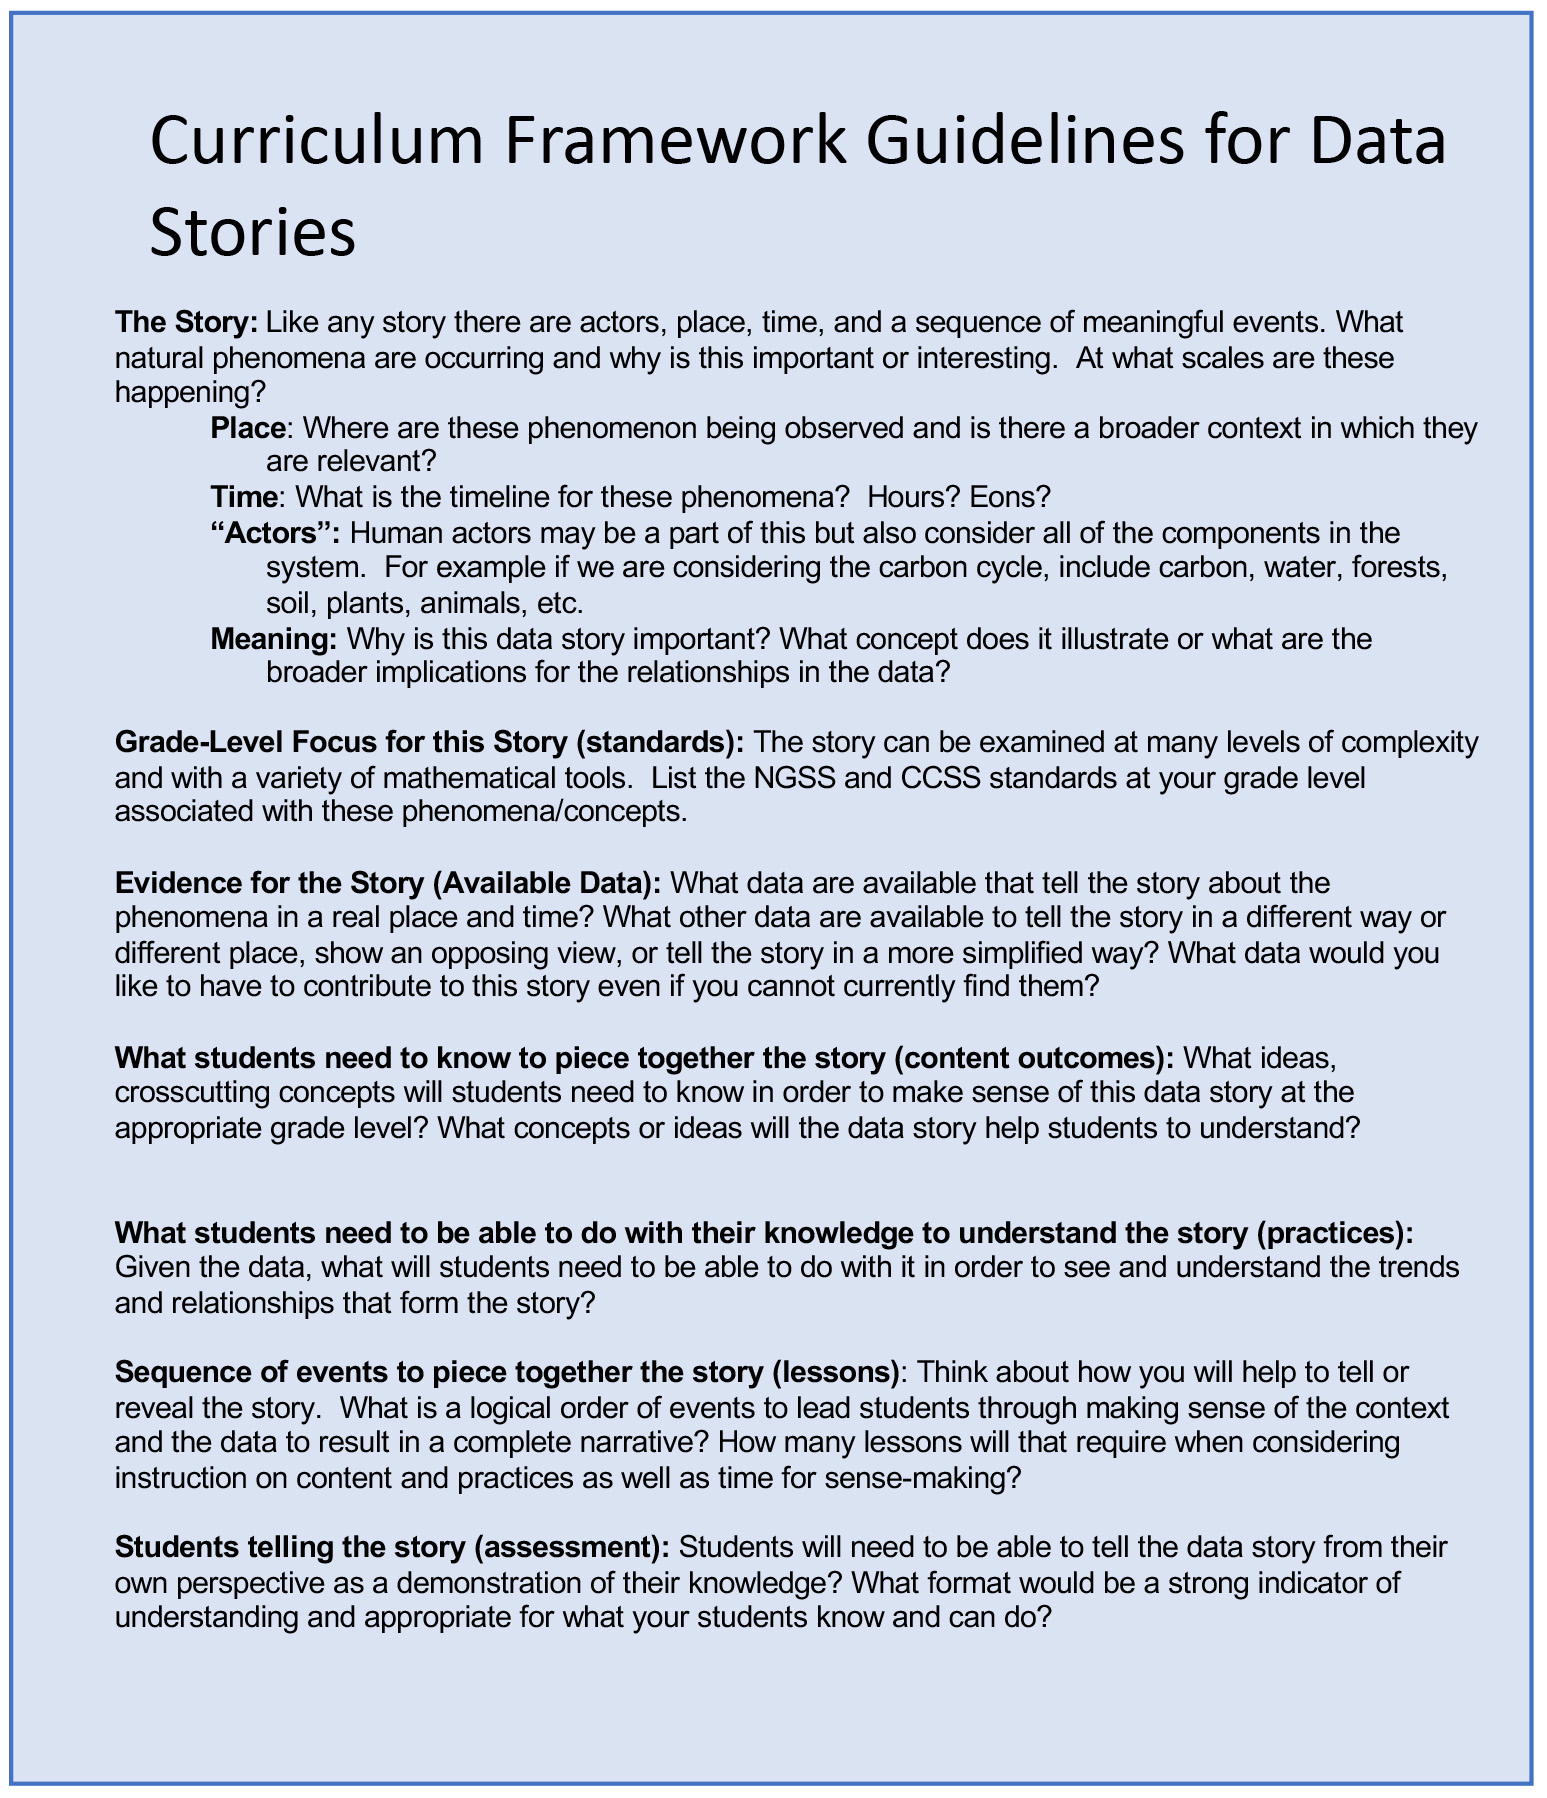
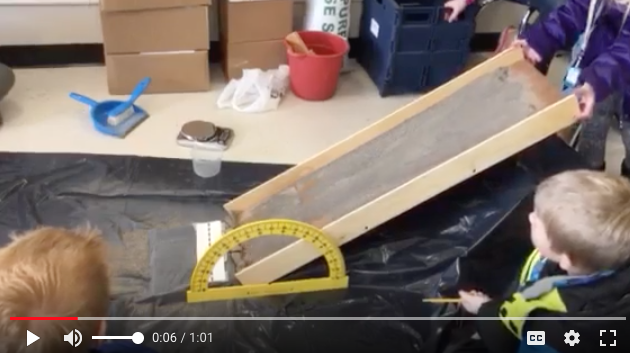
Figure 10
Fourth-grade students manipulate slope in a debris flow experiment codesigned by their teacher and NiNMoM scientists during the HJA retreat.
In some cases, scientists helped teachers find additional data sets collected by other scientists that better fit with needs (e.g., simplicity) of teachers and students. Dr. Reuter and Dr. Mark Schulze, a vegetation ecologist and the director of HJA, worked with the elementary teachers to find photos, videos, and data to tell the story of debris flows in HJA. They then visited some of those sites to look for visual cues of soil movement. Further, Dr. Reuter knew the geology of the teachers’ school vicinity and was able to suggest local sites teachers could visit with their students. Through this process, they outlined a data story to address NGSS 4-ESS2-1, “Make observations and/or measurements to provide evidence of the effects of weathering or the rate of erosion by water, ice, wind, or vegetation” (NGSS Lead States 2013).
Although teachers reported that they found all of the retreat activities valuable, some of the activities that were perceived as most valuable were not anticipated by the planning team of master teachers, scientists, and project coordinators. Specifically, teachers reported that unpacking the standards with scientists helped them see the big ideas they had not previously recognized. One elementary teacher reflected that although she had been looking at the NGSS for a couple of years, she did not realize why carbon was so heavily represented in them. After working with scientists, she began to understand why it was so important for students to develop an understanding of how carbon moves through the environment and the implications for ecology and climate change. Previously, her instruction would simply skip over the role of carbon cycling in the environment.
Teachers were often surprised by the functionality of Excel as demonstrated by scientists. During discussions about data, teachers would often ask the scientists to demonstrate what they had done with Excel and scientists found themselves teaching impromptu software lessons. Often simple procedures that were second nature to scientists (e.g., pivot tables) were new discoveries to teachers. In response, project coordinators added additional spreadsheet support and instruction to subsequent teacher coursework. In future iterations of this project, we would build in more time for explicitly teaching these skills to teachers.
Project continuation
After the first retreat, project coordinators continued to support teachers through graduate coursework, videoconference sessions with each scientist, and in-class coaching as teachers implemented the math and science practices. The graduate coursework was in part a continuation of instructional themes introduced during the retreat (e.g., modeling in mathematics and science, displaying data, field data collection, phenomenon-based inquiry), and in part a workshop to support teachers as they developed and implemented their classroom-specific lessons from the curriculum frameworks. Teachers participated in three all-day Saturday sessions at Oregon State University (OSU)–Cascades, spread across the fall term. They received instruction on and practice with the pedagogy of models and modeling in math and science, phenomenon-driven inquiry, data visualization, argumentation, and data management, including spreadsheet skills. Using these skills and ideas, teachers also peer reviewed each other’s developing lessons based on either a lesson plan or teachers’ presentations reporting on the lessons they had already implemented. In addition to a total of six possible free graduate PD credits across the duration of the project, teachers received a modest stipend for preparing, testing, and presenting the curricula in their classrooms.
During that fall term, project coordinators facilitated one evening videoconference session with each of the scientists so teachers could revisit the data sets and ask additional questions to address any problems that came up during implementation with students. These were open-ended, question-and-answer sessions, and scientists often went back through the same data sets discussed at the retreat. Although these were almost complete repetitions, teachers valued the review and found they had more context to understand the stories within the data, having had more time and experience with them. Teachers participated in those evening video conference sessions most relevant to the lessons they were preparing for their own classrooms and could do so from any computer, tablet, or smartphone (using Zoom). Often the teachers of one school or town gathered in one classroom to stream the sessions together.
Many of the elementary teachers took advantage of the instructional coaching we offered, using the teacher educators (project coordinators) to provide in situ guidance on implementing the math or science practices. These participating teachers would work together through a coaching cycle (Hansen 2016) in which they would
- cooperatively plan for instruction using one of the mathematical or science practices, along with the project data;
- have one teacher teach the lesson while their peers and the teacher educators observed; and
- collectively debrief the lessons for improvements.
Few of the secondary teachers took advantage of the classroom coaching opportunity, but several participated in a similar coaching cycle while working with their students in field settings along with the project coordinators.
Second teacher retreat and continuation
During the fall after the first summer retreat for all teachers (while the teachers were testing their activities with their students), the project coordinators, master teachers, and a new group of scientists held a two-day retreat to plan the next set of data stories focused on Mt. Bachelor (Figure 7). The cycle repeated with a two-day winter retreat for all teachers at Mt. Bachelor, further coursework, and further videoconference data sessions. All teachers developed a second unit or lesson set based on the data stories from Mt. Bachelor. Six teachers were later able to bring their students to the mountain to contextualize the data stories around snowpack and snow-water equivalence. Several others built rich curriculum units around the particulate data streamed from the Mt. Bachelor Observatory. The graduate coursework continued the instructional themes from the fall, as did the videoconference sessions with the new set of scientists. In a final meeting at OSU–Cascades, the 29 teachers shared lessons and other resources with each other. They also participated in focus groups for a final round of feedback.
Partners and partnership
In the NiNMoM project, partnership was valued as the foundation of all processes and outcomes. Teachers were seen as equal partners who brought as much to the table as scientists or project coordinators (Figure 7). During retreats, project coordinators quickly saw a transition as teachers who were hesitant about their lack of content knowledge got to know the scientists as people and began to interact with them more readily. Teachers realized they could be open about what they did not know, as in the cases of identifying the importance of carbon and asking about basic functionality of Excel. Additionally, teachers saw that scientists also had limits to their knowledge, in pedagogy as well as in their own fields. Meals and social time quickly broke down professional barriers and allowed participants to work together effectively. Teachers still regularly contact scientists when they are searching for ideas or resources. Similarly, some scientists have reached out to this group of teachers for ideas or participation in their own broader impacts efforts. One elementary teacher offered this reflection:
Being able to have resources where if I did start something and I was like, “Oh no, what am I doing?” I could e-mail and say, “Help!” or, “Man, it didn’t go well,” and then Ron [a soil scientist] would say, “Well, next time I think maybe this.” Also, they [the scientists] were learning with us, which was interesting at the same time. Of course, they come up with some great ideas, but then in reality, how is that going to work in a classroom? The whole thing was just great.
As shown in Figure 7, scientists represented a variety of OSU colleges and departments and included a hydrologist, a soil scientist, two forest ecologists, and two stream ecologists. When we transitioned our focus to Mt. Bachelor, the hydrologist also highlighted his work at that site. We also brought on an OSU computer scientist and an atmospheric chemist from the University of Washington Bothell. More details on the work of these scientists can be found on the NiNMoM website. At Mt. Bachelor, we also partnered with the Ski Patrol, whose members are constantly collecting, analyzing, and using data.
As the project progressed, the teacher group became tight-knit, sharing ideas and resources. This layer of cooperation proved invaluable, as some teachers were more able to work directly from scientists’ data and could help create curricula that could be adapted by others; Appendix A is an example of this type of collaboration (see Resources). One math teacher was struggling to find patterns in fisheries data that were clear enough to address with high school–level mathematics. A stream ecologist worked with the teacher to approach the data set from a different perspective, noting that a linear pattern emerges when one looks at date of first return of the fish rather than average date of return. The ecologist also helped remove actual rather than perceived outliers, and they both worked to format the data in a way that would be familiar to students. The resulting, cleaned data set was useful not just in that math class, but also in science classes addressing climate change and adaptation.
As researchers and teacher educators, project coordinators were able to span the conceptual and discourse gaps between scientists and teachers to keep the process moving forward and translate ideas when they did not immediately resonate with one group or the other. This was particularly important in the early stages, when working with scientists to align their data to the standards. We provided boundaries around the developmental levels associated with the standards and helped scientists understand what students were likely to already know and what they were progressing toward. During teacher–scientist conversations, project coordinators were often able to provide explanations about acronyms and concepts that are important in both education and the various sciences, but that are often passed over quickly by experts, for whom they are daily vocabulary. In reading draft curricula, project coordinators detected when key ideas were missing or misunderstood, and then connected teachers back to scientists in a targeted way.
The developed curricula
Each teacher came to the project with different contexts, curricula, and resources, and different background knowledge and interests. Thus, we knew that each teacher would need to leave with his or her own curriculum, in his or her own format, if it was to be successfully implemented back in the classroom. All teachers were asked to and supported in creating a curriculum that
- used data from one of the project scientists,
- told the story of a place or phenomenon with those data,
- aligned to standards, and
- included instruction in some element of data literacy.
All teachers were able to develop and repeatedly revise curricula that they successfully introduced in their classrooms.
A group of fourth-grade teachers used HJA landslide data to discover the relationship between rain and landslide frequency and scale. They further developed a physical model, with the help of the soil scientist, to test the relationship of slope angle to slope failure (Figure 10), and then correlated it with similar data from the HJA site and the role of avalanches at Mt. Bachelor. See Appendix B in Resources for a more detailed description of this project.
A group of fifth-grade teachers led their students in measuring and calculating stream flow, as the teachers had done at HJA (Figure 11). At HJA, stream flow is often used as an independent, dependent, or covariable, highlighting its importance. With support and resource suggestions from several of the project scientists, teachers were able to piece together the importance of stream flow in the West. The fifth-graders learned to calculate snow water equivalence as their teachers had practiced at Mt. Bachelor (Figure 5), eventually tying the narrative together as snowpack becomes stream flow. The classes ended the year by traveling the length of their watershed down to the ocean, essentially following the story of their water.
Middle school teacher products ranged from individual lessons to elaborate field study projects. Individual lessons included the use of the computer scientist’s data, which looked at sound waves through the snow pack to detect avalanches, an NGSS-referenced phenomenon related to understanding wave energy. Most middle school teachers incorporated their own field study into the curriculum for their students. For some classes, this meant one visit to a wetlands to contextualize and compare existing data. For another group that had already been conducting long-term field data collection, students were able to dive deep into the HJA data to explore the ways in which carbon moved through and was stored within the ecosystem. Another middle school group participated in a full-scale field study project. Students took multiple trips to various field sites, including a juniper grove adjacent to the school, and collected data that could be meaningfully compared to the HJA data. At the end of the year, those students traveled across the mountains to HJA. The teachers spent time modeling the phenomenon of avalanches, traveling with students to Mt. Bachelor to contextualize the process of collecting snow data. Ideally, all of our participating teachers would be able to provide primary contextualization experiences for their own students. The reality is that these experiences can be expensive and require larger blocks of time that are stymied by school schedules. Despite that, over half of our participating teachers were able to create these primary contextualization experiences for their students. All of the teachers used authentic data to tell rich narratives of places and phenomena.
High school teachers were able to work with the Mt. Bachelor Observatory group and used their data to develop a series of lessons in algebraic functions and chemistry. Students modeled the role of carbon in an ecosystem as a thread that tied the full narrative together. As described above high school teachers used many HJA data sets to tell more concise data stories while focusing heavily on the math and science modeling practices.
Evaluation and recommendations
The project focused on evaluating teacher development rather than measuring impact at the student level. Our key indicator of success is that all of the teachers were able to develop contextualized data curricula for use in their own classes, which was the goal of the project. Because the project was driven by design-based research, project coordinators consistently evaluated how teachers were responding to the interventions and used these data to improve NiNMoM. Following each key experience (e.g., retreats, course conclusions), we asked participants for suggestions, in writing and through focus groups, on changes they would make to the program and what was most useful. At the conclusion of the last phase of the project, we collected and coded these data to identify themes in what worked well and what could be improved. Based on these data, we offer the following recommendations to others who are interested in using a teacher–scientist partnership to support data literacy:
- Focus on a true partnership and not a delivery model. All participants are experts in their own field and their voice will improve the process and product.
- Schedule sufficient time to work together. Some of the best developments were tangents from planned processes and needed space and time to be fully developed.
- Focus on the big picture and the details. In looking too closely at the data and the process of analyzing them, it is easy to lose sight of the big picture—the story that the data are telling. But when looking only at the big picture, teachers and students may not develop the skills to tell the story themselves.
- Choose charts over data. Although the goal is to get to a point where students can analyze complex data, this process is time-consuming, even for scientists. If students are going to learn how to read data, they need to be exposed to many different data sets and summary charts.
- Consider math content as a first focus. It is much easier to start with the data as telling stories through the lens of science content. However, this left the math teachers feeling uneasy with the content and struggling to find math connections to teach. It might be more productive to start with the math–data connections and then link to the science content.
Acknowledgments
Funding
The NiNMoM project was funded largely by a U.S. Department of Education Title II-A grant and partially by the Roundhouse Foundation and the NSF Long Term Ecological Research Station (LTER) grant program. Data and facilities were provided by the H.J. Andrews Experimental Forest and Long Term Ecological Research program, administered cooperatively by the U.S. Department of Agriculture Forest Service Pacific Northwest Research Station, Oregon State University, and the Willamette National Forest. This material is based upon work supported by the National Science Foundation under Grant No. DEB-1440409.
Teachers
We would like to thank all of the teachers who participated in various parts of this project: Kim Bartolotti, Lynda Beauchamp, Eric Beck, Colleen Behrens, Dante Biancucci, Leilagh Boyle, Dave Colburn, Quinn Daly, Nate Day, Jessica DeVan, Jody Fletcher, Jessica Flood, Amber Freeman, Heidi Gillespie Dixon, Rima Givot, MeriLe Glass, Molly Honea, Mark Hubler, Laura Home Kaiser, Christine Kasberger, Lisa Kelly, Tawnya Layne, Jeff Lowenbach, Katie Lyons, Janey McCormack, Stephanie Morrison, Jessica Mumm, Sallie Nigg, Valerie Nixon, Valerie Overlay, Michelle Powers, Blake Poyner, Jay Sklenar, Adam Stefanek, Stacy Stringer, Kailey Sutton, Charlene Walker, Stacy Welsh, Jennifer Williams, Bryce Withers, and Jake Zywicke.
Project coordinators
Dr. Michael Giamellaro (Oregon State University–Cascades, College of Education), Dr. Kari O’Connell (Oregon State University, Center for Research on Lifelong STEM Learning), Dr. Melinda Knapp (Oregon State University–Cascades, College of Education)
Scientists
Dr. Alba Argerich (University of Missouri, School of Natural Resources; formerly Oregon State University), Dr. Ivan Arismendi (Oregon State University, College of Agricultural Sciences, Department of Fish and Wildlife), Dr. Dan Jaffe (University of Washington Bothell, Division of Physical Sciences, and Director of the Mt. Bachelor Observatory), Dr. Marc Rubin (Oregon State University–Cascades, College of Engineering, Department of Computer Science), Dr. Ron Reuter (Oregon State University–Cascades, College of Forestry, Forest Resources Department), Travis Roth (PhD student at Oregon State University, College of Earth, Ocean, and Atmospheric Sciences, Department of Water Resources), Dr. Mark Schulze (Oregon State University, College of Forestry, Department of Forest Ecosystems and Society, Director of the H.J. Andrews Experimental Forest)
Michael Giamellaro (giamellm@oregonstate.edu) is an assistant professor of science and mathematics education in the College of Education and the Roundhouse Foundation Faculty Scholar of Science Education at Oregon State University in Bend, Oregon. Kari O’Connell (kari.oconnell@oregonstate.edu) is a senior researcher at the Center for Research on Lifelong STEM Learning at Oregon State University in Corvallis, Oregon.