
How to Design a Performance Task
Follow a sequence of steps to develop an authentic performance task.
Performance tasks enable teachers to gather evidence not just about what a student knows, but also what he or she can do with that knowledge (Darling-Hammond and Adamson 2010). Rather than asking students to recall facts, performance tasks measure whether a student can apply his or her knowledge to make sense of a new phenomenon or design a solution to a new problem. In this way, assessment becomes phenomenon-based and multidimensional as it assesses both scientific practices and content within a new context (Holthuis et al. 2018).
As we move away from traditional testing, the purpose of assessment begins to shift. Instead of only measuring students’ performance, we also strive to create an opportunity for students to learn throughout the process. Not only are students learning more as they are being assessed, but the feedback you gain as a teacher is far richer than traditional assessment (Wei, Schultz, and Pecheone 2012). This allows teachers to gather more information about what students do and do not know in order to better inform meaningful next steps in their teaching.
The design process
In the next sections, we describe a sequence of steps to design performance tasks for a science course using a sample middle school performance task, titled “Deer Population in Colorado.” Performance tasks are intended to assess individual student performance and can be administered at points that make sense for your instruction, either within or at the end of a unit. While we have defined a clear and meaningful sequence for this process, we want to emphasize that it is iterative in nature and often requires returning to earlier steps.
Step 1: Unpack the performance expectation
The first step of designing a performance task is to unpack the performance expectation (PE). “Unpacking” means digging into the Next Generation Science Standards (NGSS) documents to interpret what the PE really means; this ensures that your performance task assesses what you want it to assess.
Imagine you are planning a unit on interactions within ecosystems and you would like to write a performance task that assesses students on the life science PE MS-LS2-1. Take a look at the NGSS document pictured (Figure 1). The first step is to read the PE at the top, which also includes an important clarification statement that lends more detail. This is where many of us will stop; however, it is critical you continue to unpack the three dimensions listed below the PE.
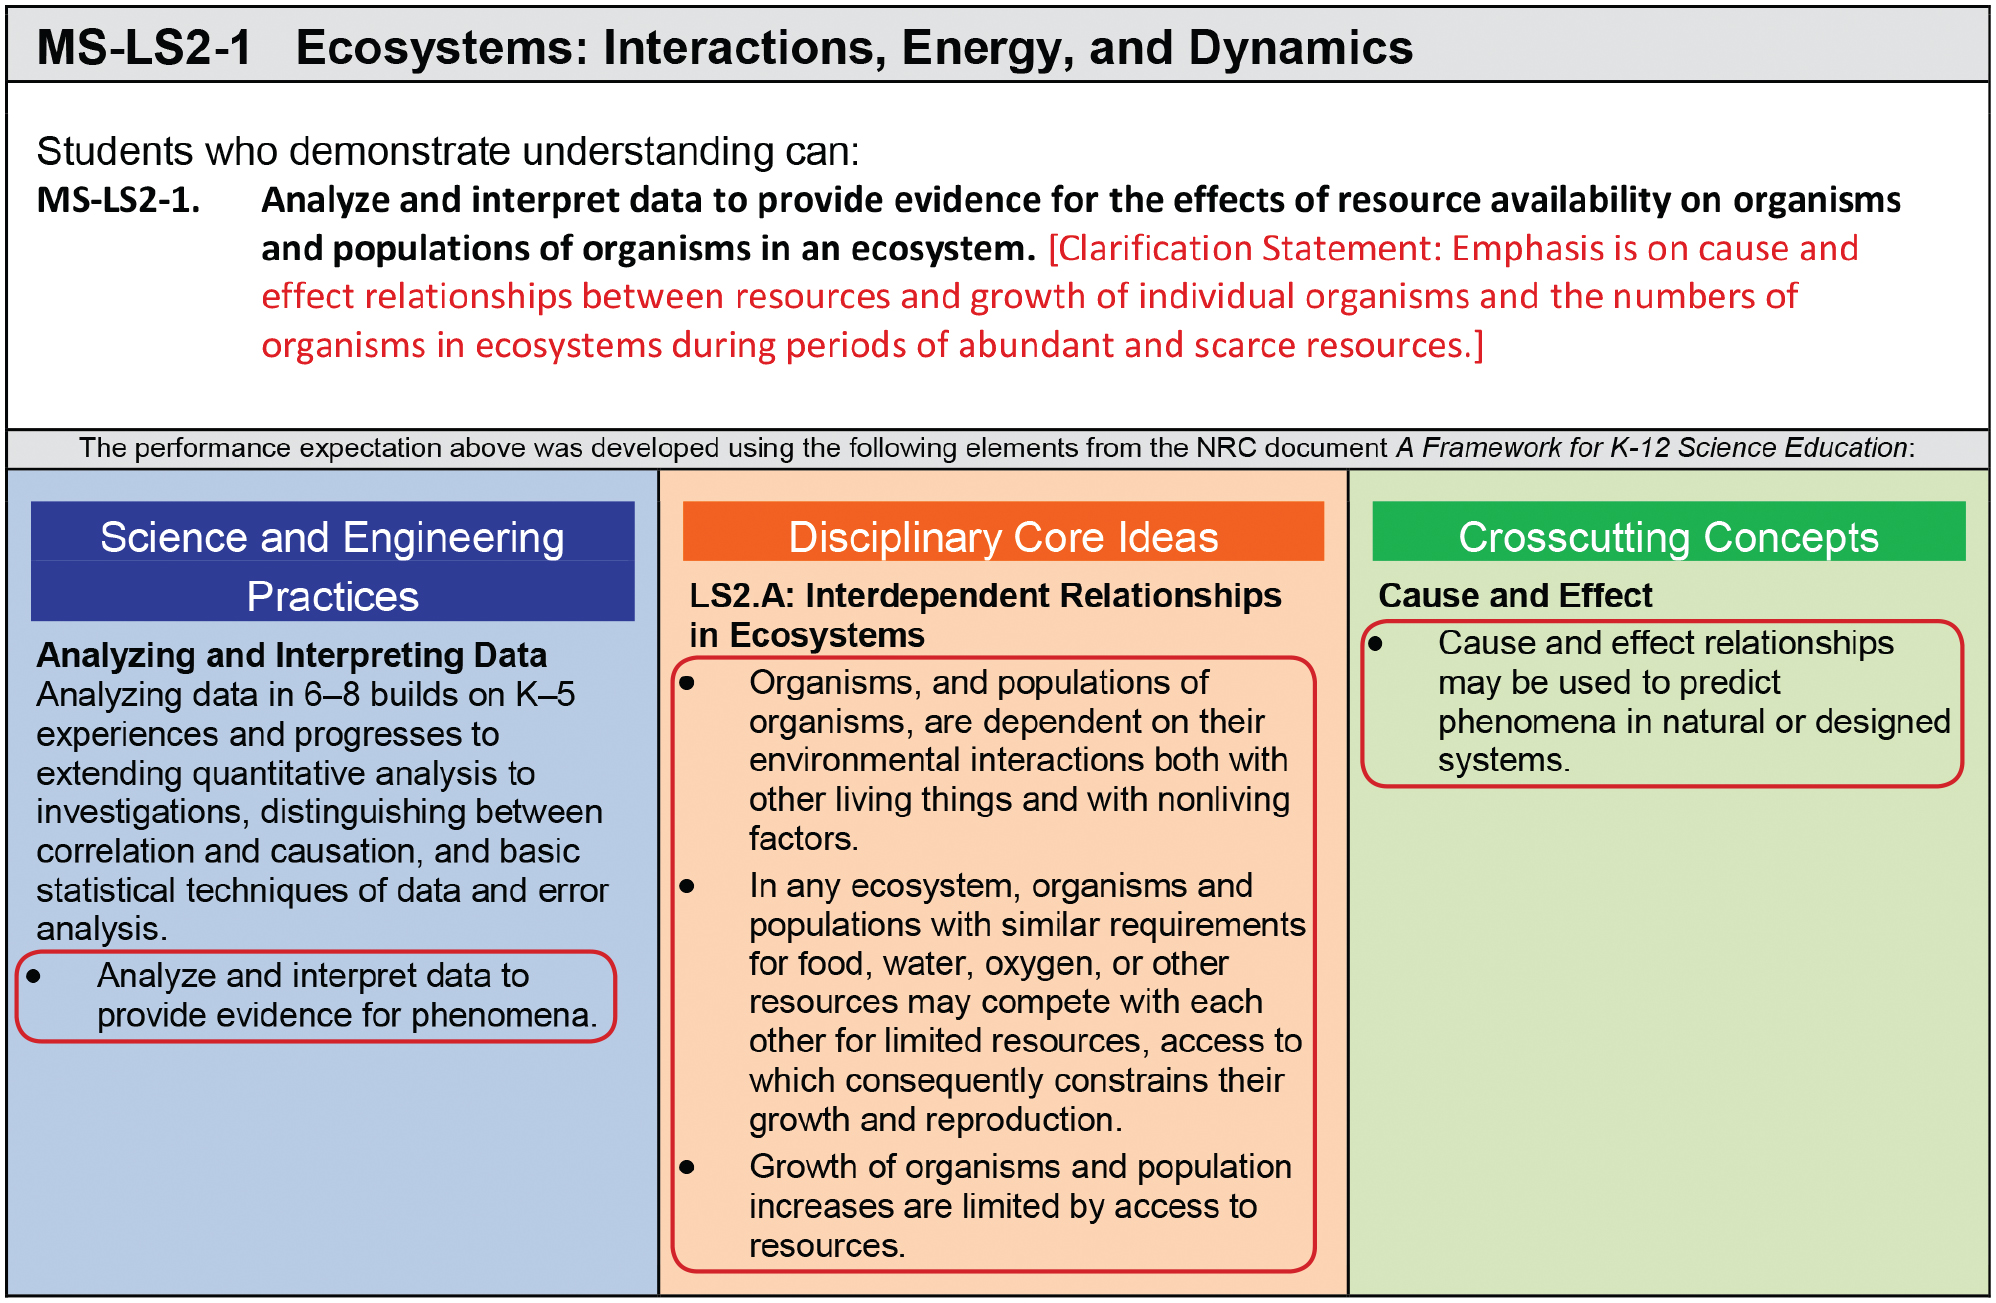
Notice that we have circled the bullet points underneath the science and engineering practice (SEP), disciplinary core idea (DCI), and crosscutting concept (CCC). If you need more specific information for each dimension, you can click on the bulleted language, which will take you to the NGSS K–12 framework. By unpacking each dimension to this element level, we ensure that we are addressing these dimensions at the correct grade level for this PE. This ensures that we create a meaningful spiral for students throughout their K–12 education as they build complexity within these three dimensions over time. For example, with MS-LS2-1, we will not just ask students to identify cause-and-effect relationships, which would be at the 3–5 grade band level; we actually need to ask students to use cause-and-effect relationships to predict phenomena.
Keep in mind that this process also provides the flexibility to incorporate NGSS dimensions that are not specifically associated with a PE; we will show an example of this in step 3 of the process. By doing a thorough analysis and asking yourself these critical questions during the unpacking process, you will avoid major revisions later.
Step 2: Identify a rich and authentic phenomenon
The second step is to identify a rich and authentic phenomenon or an engineering problem that fits the performance expectation you are trying to assess. The NGSS community defines a phenomenon as an observable event that occurs in the universe; students then use their science knowledge to make sense of the selected phenomenon.
The phenomenon is the foundation of the task, and it is often where teachers experience the most frustration because it is challenging to find an actual phenomenon that truly fits the performance expectation. To begin the process of brainstorming a suitable phenomenon, we often start by looking at the elements of the DCI and connecting these concepts to anything we have seen or done in the past—for example, a cool video we saw, an interesting article we read, an intriguing podcast we listened to, or a great activity we have used in our classroom. These phenomena might be big and exciting—such as the Mount Tambora eruption that led to the “Year Without Summer”—or they could be smaller and more prevalent in everyday life—such as two pumpkins that grew to different sizes in the school garden.
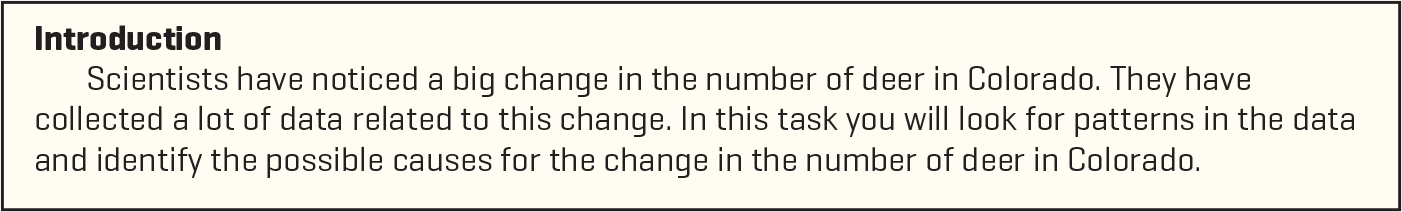
Examining the DCI of MS-LS2-1, we noticed themes of competition, limited access to resources, and population size. This triggered a memory of a research study about a huge decline in the deer population in Colorado. Upon further investigation, we found that this phenomenon aligned with all three dimensions of the PE; it had multiple sources for data analysis to assess the SEP, it showcased each element of the DCI, and it provided opportunities to use cause-and-effect relationships. See Figure 2 for an example of how we engage students with this phenomenon at the beginning of the Deer Population in Colorado performance task, using key words such as “data” and “cause” to introduce students to the NGSS dimensions they will be performing in this task. You will see this phenomenon weaved throughout the rest of the performance task.
In this process, we learned that a lot of interesting phenomena may seem initially applicable, but upon further investigation, they are not well-aligned with the PE and the corresponding dimensions we are trying to assess. For example, a common pitfall is selecting a phenomenon that initially seems to match the language of the PE but, in the end, does not apply to a majority of the elements of the DCI. The key to this step is to keep an open mind and remain willing to change the phenomenon if your first idea does not quite fit.
Step 3: Develop prompts
The next design step is to develop prompts—questions or instructions—that focus on the phenomenon and will elicit evidence of all three dimensions of the PE. In alignment with the SEP of MS-LS2-1, Analyzing and Interpreting Data, we first gathered data relevant to the phenomenon. The research study that inspired our choice in phenomena provided us with graphs that showed the change in the number of deer in Colorado, yearly rainfall, amounts of cheatgrass and sagebrush, population sizes of deer and elk, and causes of fawn deaths. While the data for this task came in a traditional format and was easily accessible from one source, data can come in many different forms (e.g., videos, images, data tables, graphs) and often this data collection process will require much more time and internet research. If data are not available in a form that is accessible to your group of students, you may also consider adapting existing data or using scientific concepts to manufacture your own mock data sets. In some cases, students can also generate data for themselves in the form of observations, measurements, and calculations as a result of carrying out an investigation or doing a simulation.
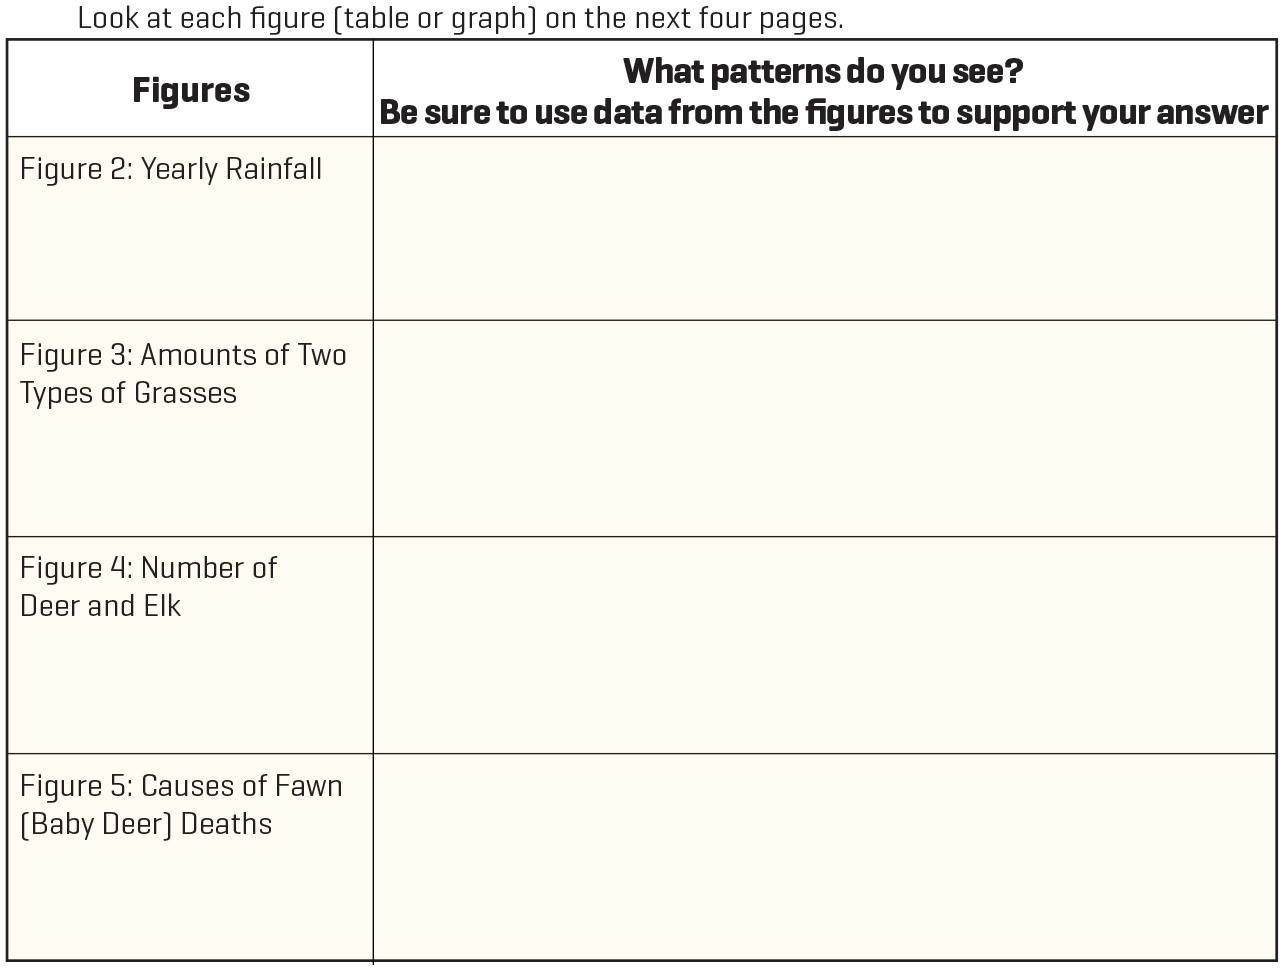
As we begin to write prompts, we must always remember that this type of assessment asks students to engage in a new and very complex thought process. In order to help students understand the phenomenon of the task and engage with difficult multidimensional questions, we also need to build in scaffolding questions that provide all students access to the assessment. If, for example, we ask students to analyze five different sources of data to use as evidence, we should provide them with a graphic organizer to help them organize their data analysis (see Figure 3). This is not only a tool to help each student organize and make sense of data as he or she independently completes this performance task, but it also offers another assessment opportunity for teachers to determine each student’s ability to read, analyze, and interpret data.
In line with this goal, we also want to make sure that our prompts are aligned with the NGSS vision of assessing the integration of relevant practices, knowledge, and concepts. For example, the above prompt was multidimensional because it asked students to show evidence of the SEP, Analyzing and Interpreting Data, and the DCI, LS2.A Interdependent Relationships in Ecosystems. As another example, take a look at the final prompt of this performance task (Figure 4).
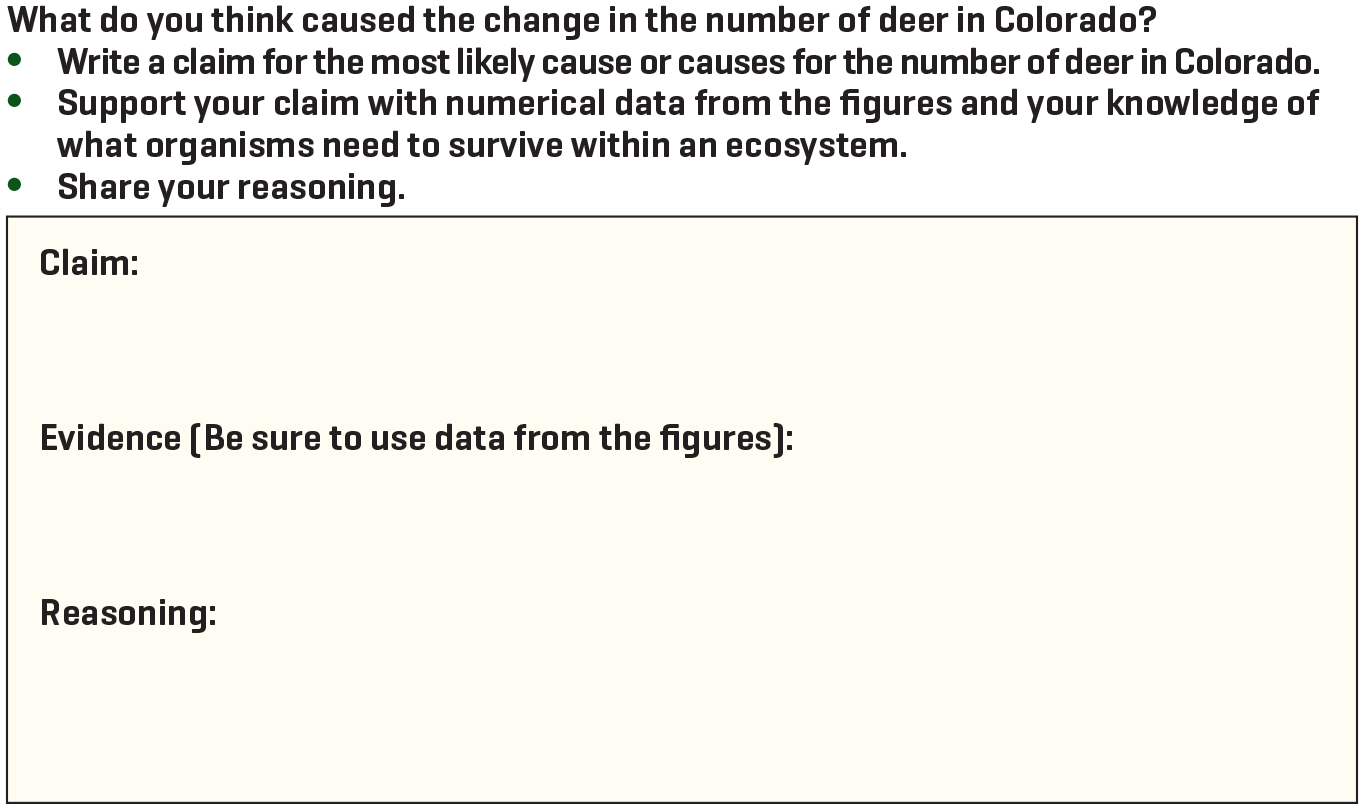
This prompt asks students to use their data analysis and their cause-and-effect relationships to make a claim about the phenomenon—the cause of the change in the deer population in Colorado. Notice we are not only assessing the relevant DCI LS2.A and CC of Cause and Effect for MS-LS2-1, but we are also choosing to assess an additional SEP element of Constructing Explanations: “Construct a scientific explanation based on valid and reliable evidence obtained from sources (including the students’ own experiments) and the assumption that theories and laws that describe the natural world operate today as they did in the past and will continue to do so in the future” (Appendix F 2013).
To decide which SEP to assess, we needed to hone in on the distinction between Constructing Explanations and Engaging in Argument From Evidence—two SEPs that are so similar, they are often used interchangeably. For this particular prompt, students are required to construct a causal explanation of a phenomenon—which the NGSS defines as Constructing Explanations. This prompt focuses on assessing how students can use the provided sources of evidence as well as their understanding of appropriate scientific concepts in order to support one primary explanation for the number of deer in Colorado—lack of food.
This final prompt not only showcases this emphasis on the NGSS and multidimensionality, but it also reinforces that when we write performance tasks, it is essential that our prompts keep returning to the phenomenon—in this case, the change in the number of deer in Colorado. If this connection is not maintained, it is no longer a performance task, but rather a series of content-focused questions.
Step 4: Create scoring guides
Upon drafting a performance task, the next step is to create a scoring guide that includes rubrics that clearly assess the three dimensions of the PE. We will summarize the key components here.
When writing rubrics, we first need to identify the dimensions addressed in the prompt. Take the example of the final prompt of the Deer Population in Colorado task (Figure 4). In this prompt, students are asked to show evidence of the SEP of Constructing Explanations, the DCI of Resource Availability and Populations, and the CC of Cause and Effect. Using the NGSS language of each of these dimensions, we write a specific statement, known as the rubric construct, that helps clarify what we are trying to assess in that prompt (see Figure 5).
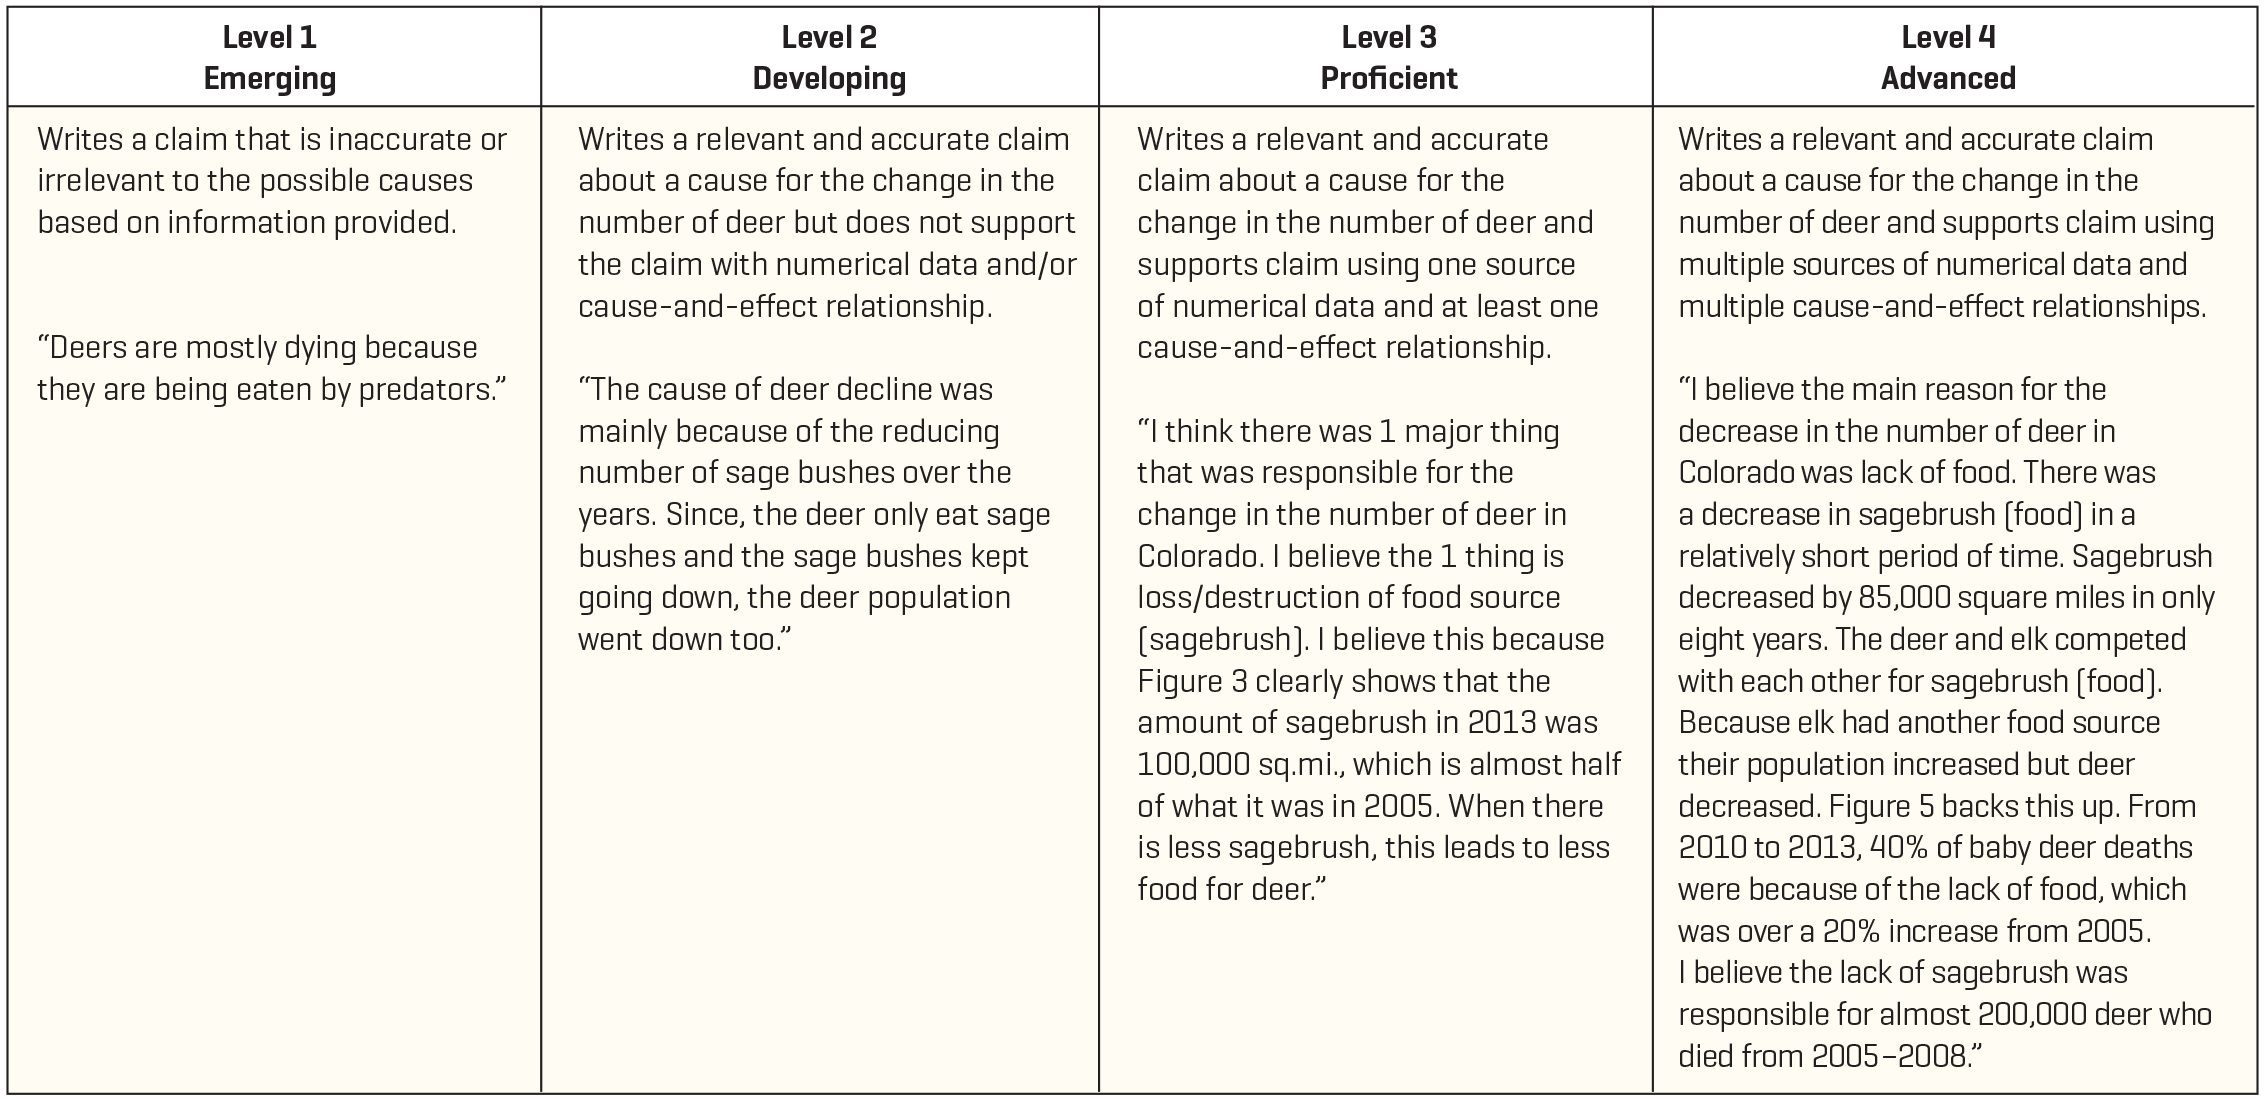
Once we have an idea of what we are looking for, we can look at student work to identify a range of exemplars and use these to write descriptions for each level of performance. By including a student sample for each level of performance (see the last row of the rubric in Figure 5), we also provide teachers a range of authentic examples to know what student performance looks like for that prompt. Using this approach ensures that we create what is known as a multidimensional rubric, meaning it assesses the integration of multiple NGSS dimensions, rather than assessing only content. Keep in mind that writing rubrics is a very iterative process. At each step, you will want to stop and reflect on the alignment, and you will often return to previous steps to make adjustments.
Step 5: Pilot, score, and revise
Step 5 is often skipped due to time constraints, but it is the most essential. Piloting the task with students at the appropriate grade level and scoring student responses will help you identify prompts and rubrics that need to be revised.
In the case of the Deer Population in Colorado performance task, we learned that if we want students to show evidence of knowledge and practices, we must ask for it explicitly in the prompt. As we scored student samples for the final prompt, we noticed that students were able to demonstrate their ability to analyze data, but rarely included numerical data in their responses. To remedy this, we returned to the task itself and revised the prompts to specifically ask students to cite numerical data. We must remember that this kind of assessment is new for many students, so we need our expectations to be as clear and explicit as possible to give every student the best opportunity for success.
The most important step
While understanding the steps of the design process is essential, you will also find that support and collaboration are integral parts of the process. Remember that like any new process, designing performance tasks is going to be challenging. As you prepare to make the shift to NGSS-designed performance tasks, we highly recommend you put together a team of forward-thinking teachers like yourself, and seek out professional development to guide you through this new process.
For more information on the support SCALE Science provides around performance task design, please visit our website at scienceeducation.stanford.edu or contact us at scalescience@stanford.edu.