
Investigating Urban Trees
(Volume 86, Issue 8)
By James Carrigan, Alec Bodzin, Thomas Hammond, Scott Rutzmoser, Kate Popejoy, and William Farina
Mobile geospatial technologies enable high school students to engage in authentic scientific data collection and analysis that promote spatial-thinking and reasoning skills, as well as problem-solving in a school’s local environment. We developed and implemented an Ecological Services investigation aligned to the Next Generation Science Standards in an urban high school with a large population of economically disadvantaged students. The investigation includes local field data collection with mobile devices and classroom data analysis using a freely available Web Geographic Information System or GIS. The field investigation focuses on observation skills and uses a dichotomous key to identify local tree genus and species. Student data analysis focuses on spatial patterns of tree species surrounding the school and exploration of the geospatial relationship between percent tree canopy cover and crime statistics in the city. Students were actively engaged with using geospatial technologies to investigate relevant socio-environmental issues in their community. Students thought critically about the costs and benefits associated with urban trees and proposed changes to their community that will have a positive impact on their local natural and built environment.
Trees provide many ecological, aesthetic, safety, and economic benefits to urban environments. One study estimates the economic benefits alone to be worth $394 per tree (Nowak, Crane, and Dwyer 2002). Trees provide many ecological services including habitats and food sources for birds, rodents, and insects. They also reduce energy costs and power plant emissions by providing shade, thus reducing cooling needs in the summer, and wind blocks, reducing heating demands in the winter (Akbari 2002). Trees, more than most plants, remove common pollutants (CO2, NOx, SO2, particulate matter) from the air and sequester carbon dioxide, improving air quality (Endreny et al. 2017). Their role in hydrology is critical; they intercept precipitation and reduce surface runoff into streams and rivers, thereby reducing flooding and erosion (Endreny et al. 2017). Finally, trees also provide aesthetic value to local communities, enhance social interactions, reduce crime rates (Troy, Grove, and O’Neil-Dunne 2012), and provide a pleasant environment for urban day-to-day activities.
We have developed a Trees and Ecological Services (TES) investigation in which students explore the area around their school to identify different types of trees, learn about the environmental and societal benefits that trees provide, and then investigate the relationship between tree distribution and crime in their city. The investigation emphasizes the use of geospatial technologies—tools that collect or process location-specific data, typically referenced by a global coordinate pair (latitude and longitude, Universal Transverse Mercator [UTM] coordinates). Geospatial technologies include global positioning systems (GPS), geographic information systems (GIS), and virtual globes (e.g., Google Earth).
We taught the TES investigation over the course of four 90-minute class periods with urban ninth-grade students, 21% of whom were English learners (ELs). For these students, learning with geospatial technologies helped meet their needs by providing an active learning environment with dynamic data visualizations.
Getting started
We designed the lesson using Esri’s Collector app for mobile data collection and ArcGIS Online for data analysis, both of which are easy for students to use and freely available to K–12 schools (see “On the web”). If students are not already familiar with Collector and ArcGIS Online, you may want to run a short introductory activity. For example, during the second week of the school year, our students complete a short ecosystem scavenger hunt activity (see “On the web”) to become familiar with these technologies. We run the apps on tablets with GPS capability. If your school does not have equivalent devices for data collection, smartphones can be used. (We find that many high school students own smartphones that can be used for data collection.)
The student-collected data are then uploaded and shared into ArcGIS Online (see “On the web”). We developed the Arc- GIS Online map to include other freely available data layers derived from public data sets that are displayed with students’ collected data and observations. The data layers are displayed in an interactive mapping visualization that includes a suite of tools that students use to manage, query, and analyze the geospatial data.
While our investigation was designed specifically for our city, a related investigation could be designed for any other school by customizing the ArcGIS data layers to fit the local area. The background data sets used for this investigation include land cover data, percent tree canopy data, and personal and property crime statistics from U.S. Census data.
For best results, we recommend reviewing the teacher’s guide (see “On the web”; user ID: eliteacher and password: 87dja92) before beginning the activity, as it contains additional detailed information not covered in this article. In addition, we recommend viewing the video tutorials on the website to become familiar with the ArcGIS online and the Collector app interfaces.
Day 1: Data collection
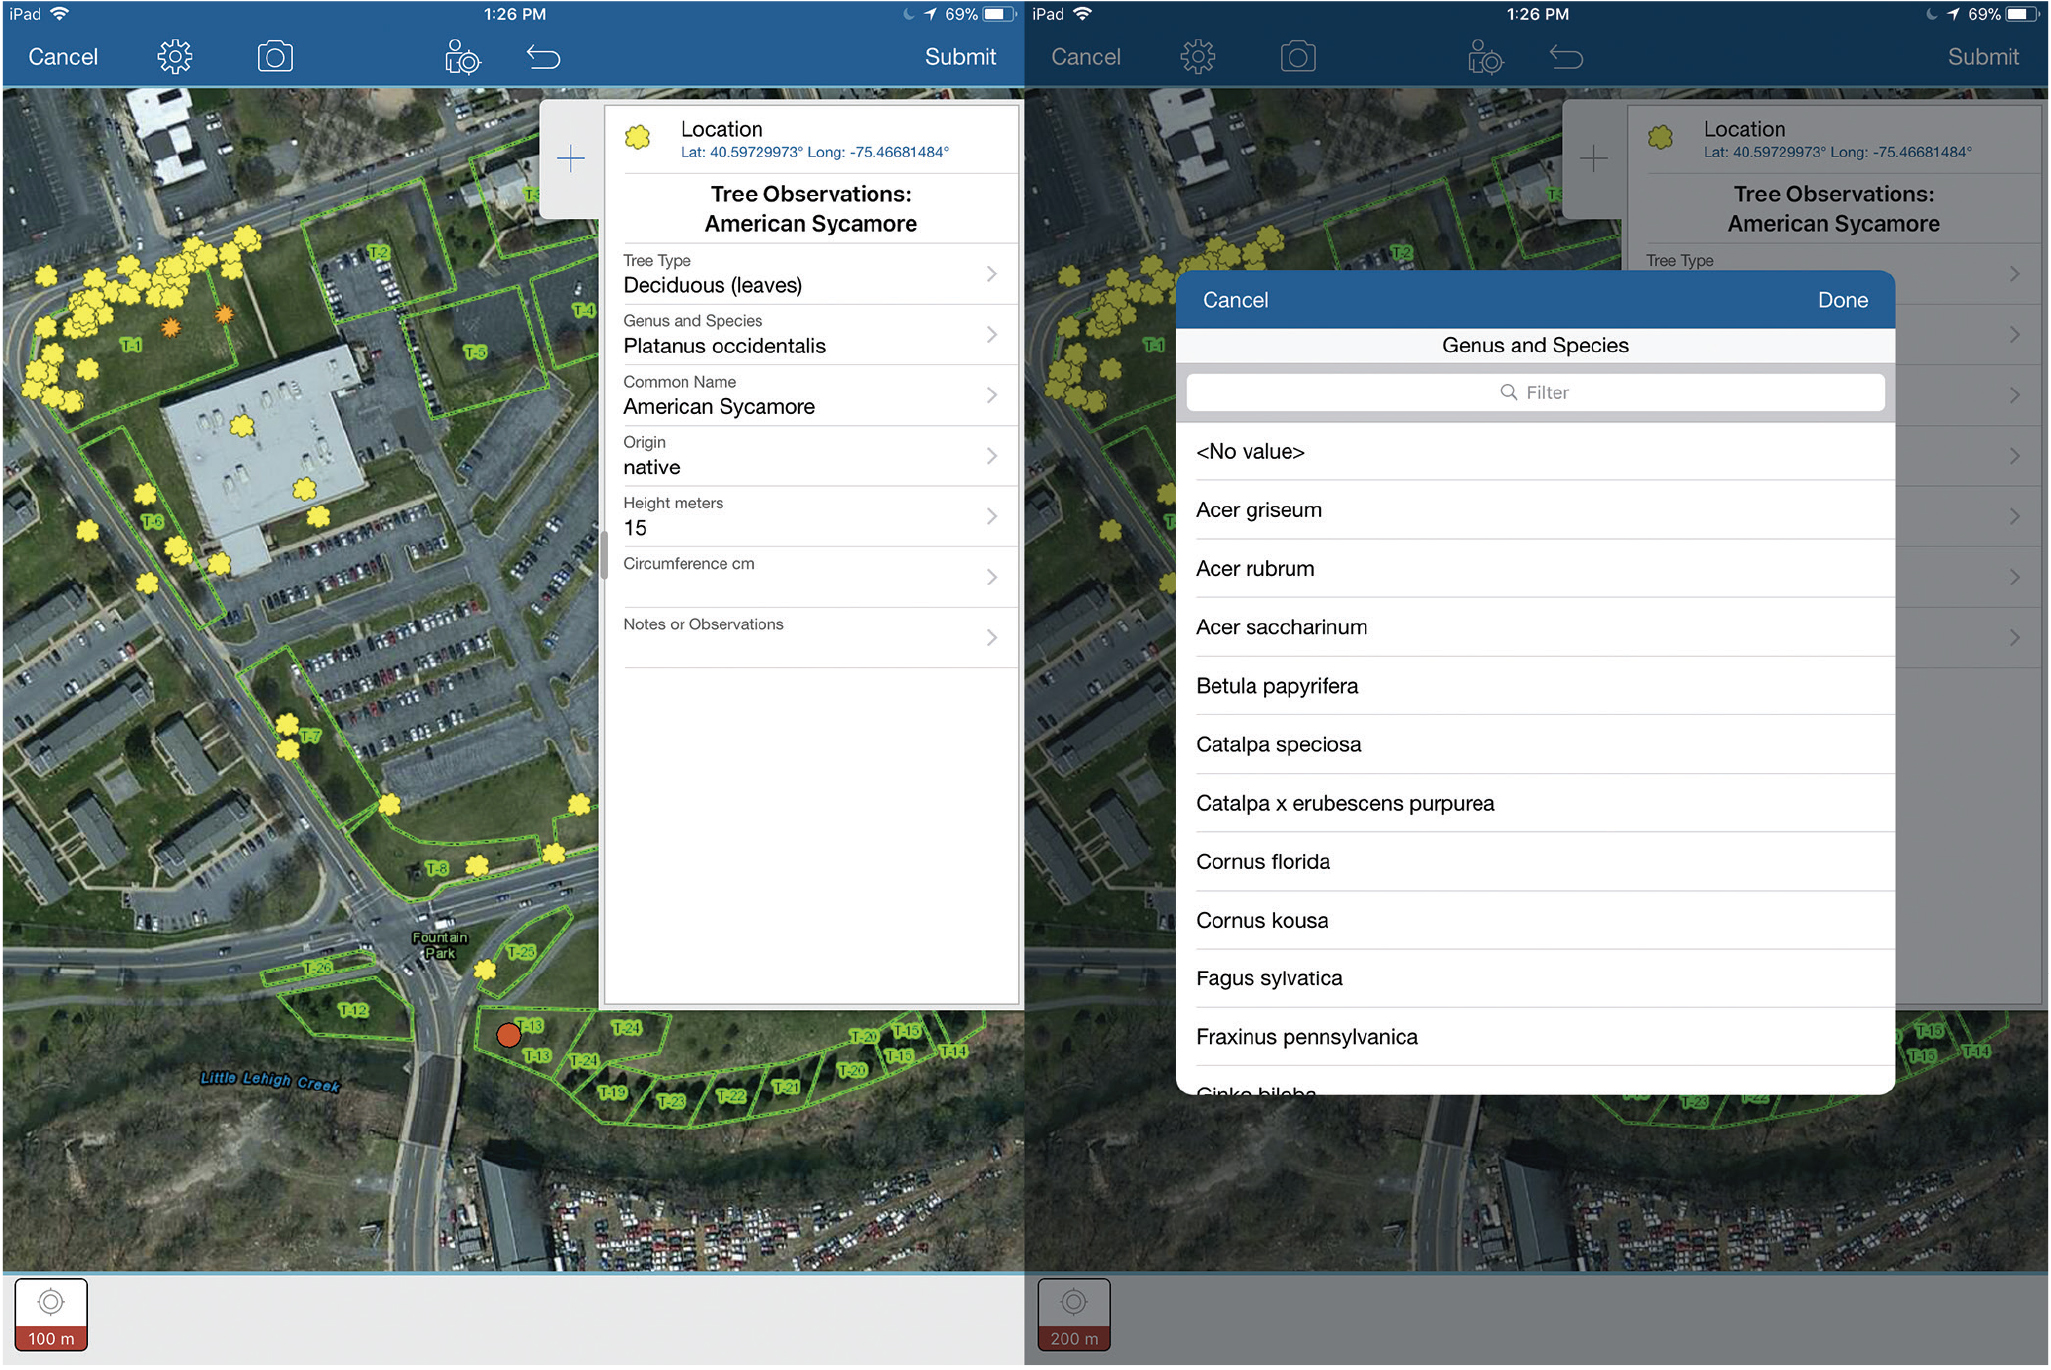
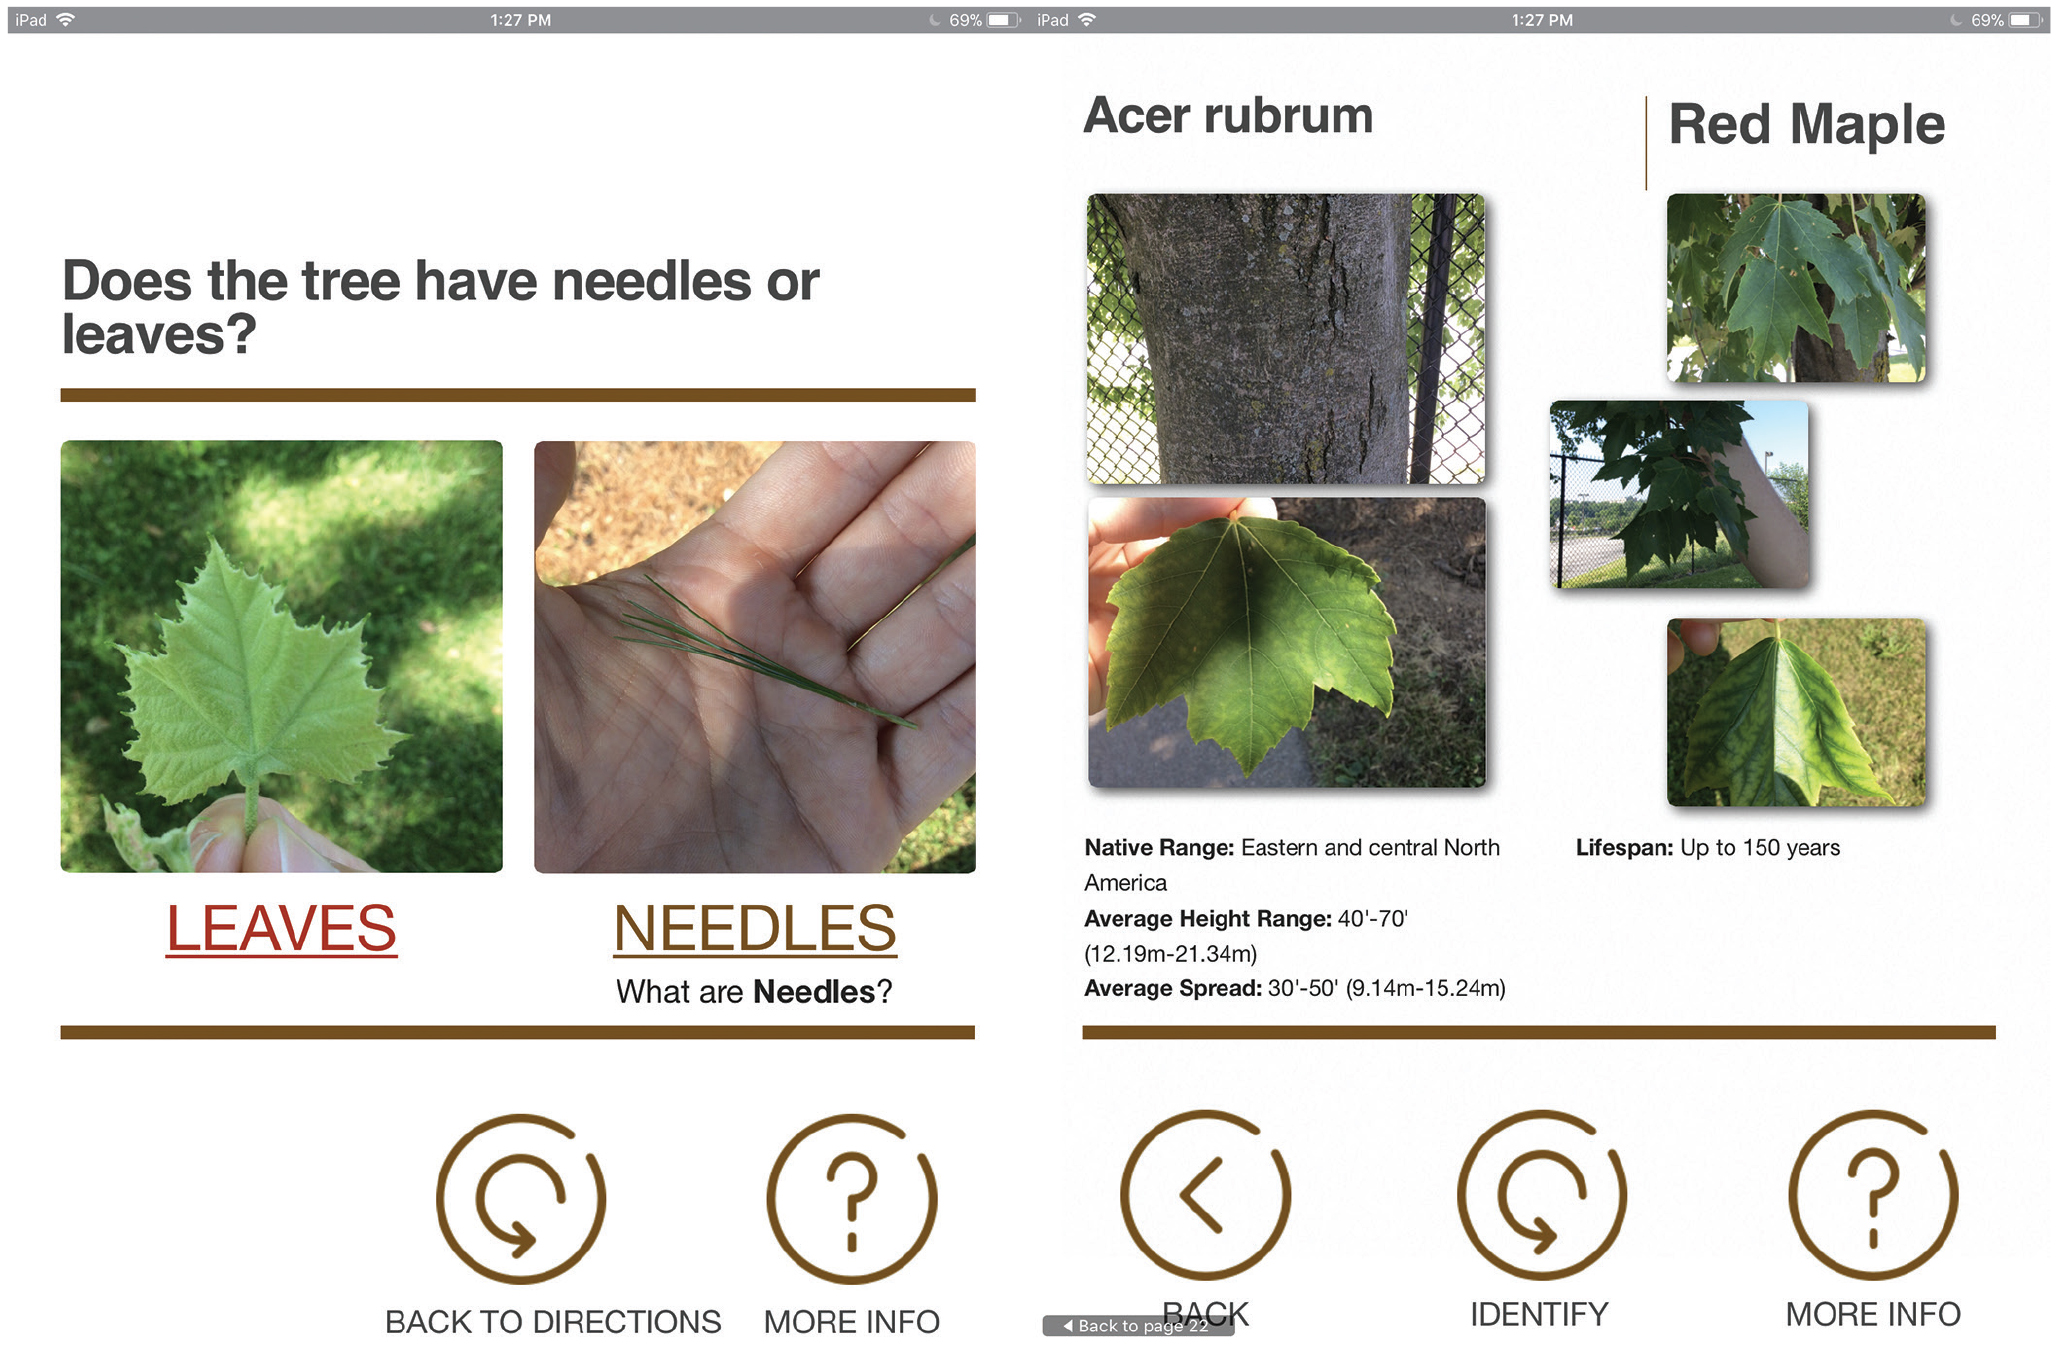
Students begin the activity by downloading a local map on their tablets that will be used for outside data collection (Figure 1). While the map is downloading, we explicitly demonstrate how to use the dichotomous key we created, using examples of different types of leaves that students will encounter during their data collection (Figure 2, p. 30). Students identify the main characteristics (such as leaf shape, organization, and vein arrangement) by reading through a series of questions accompanied by displayed sample images to identify the tree species and learn whether their tree is a native or exotic species.
We then divided the students into small groups (3–6 students) and assigned specific investigation areas (see numbered polygons in Figure 1). We had previously recruited community members who use geospatial technologies in their careers to serve as mentors and to work with students as they collected data. Their occupations included arborists with the local power company, city planning and GIS staff, and academics and retirees with past work experience in these areas. We provided them online and in-person orientation before working with students.
Matching student groups with mentors provides students with opportunities to discuss careers that use geospatial technologies, and also enables the classroom teacher to circulate among groups without having to directly supervise each group. If mentors are not available for your classroom, we recommend selecting data collection areas that are in close proximity to provide appropriate safety and supervision by the classroom teacher.
Each group collects observational data about the trees within its assigned investigation area. Using the dichotomous key to identify the tree genus and species, students learn the tree’s common name and determine whether it is native or exotic. At our school, located in the mid-Atlantic region, the most common genera around the building include Acer, Malus, Picea, Platanus, Prunus, Quercus, and Tilia. A fabric tape measure is used to measure tree circumference, a statistic related to tree height and carbon fixation. Students also estimate tree height and input evidence of animal habitats into a data field (Figure 1). Students take pictures of each tree, which are georeferenced to their data points, and evidence of bird nests or burrows in and around trees.
Back in the classroom, students synchronize their observations to a cloud-based service that will then display the entire classroom data set in ArcGIS online. Students then respond to the following prompts:
- List each genus and species of tree you observed.
- Did you see any evidence of animal habitats in the trees you observed (bird’s nest, rodent hole, squirrels)?
- What was the genus and species of the tallest tree you observed? How tall was it in meters?
- What was the genus and species of the widest tree you observed? What was the circumference of that tree in centimeters?
Day 2: Exploring patterns
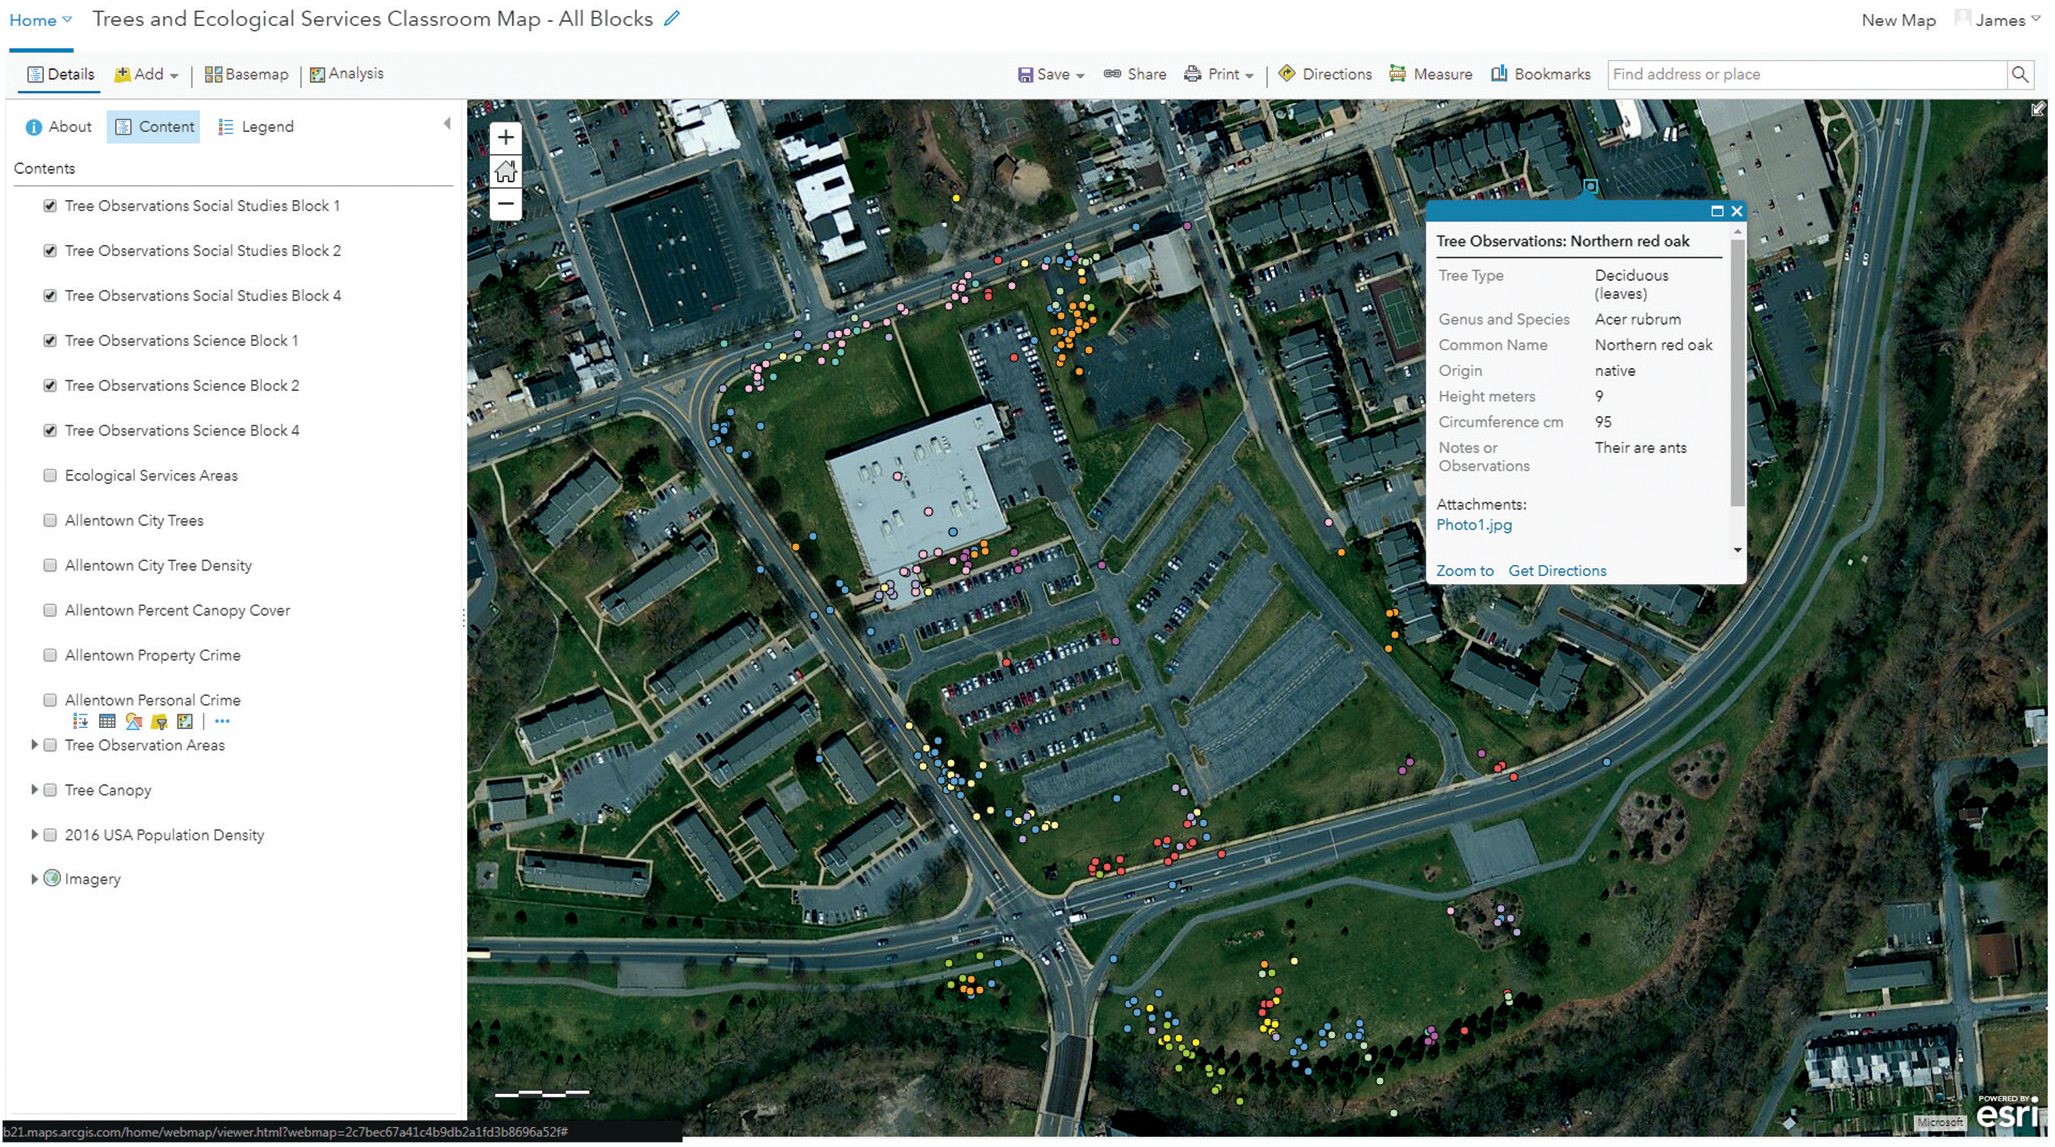
The next phase of the investigation takes place in the classroom, where students can work independently or in their groups to manage, query, and analyze the cumulative class data with ArcGIS Online (Figure 3). We find it effective to explicitly model how to use the ArcGIS Online tool features to our students before they begin this part of the investigation. They should understand how to view and interpret the legend, view data from each point and in the table, and use the filter tool.
The students view their collected data and compare their findings to a data layer of planted city trees provided by our city. The students identify tree-planting patterns and think about benefits of planting shorter trees in certain locations (e.g., under power lines). Students are instructed to answer the following prompts:
- What is the most common tree on the school property? Provide the genus and species name. Is this tree native or exotic?
- Look at all classes’ observations. Notice how tree species differ around the entire observation area. Where do changes in the species of trees occur? Describe any patterns you see. Be specific. Hint: Look at the color patterns on the map.
- Why do you think the tree species are different in the different locations around the school?
- Why would you want shorter trees planted in certain locations?
At our school, tree species and genera change at street intersections (see color patterns in Figure 3). Student responses note that different species are planted because of a specific characteristic they have (size, aesthetic, shade), while others may have been planted for financial reasons.
Next, students are instructed to complete a data chart that displays the ecological services of a tree and corresponding value of those services. Students estimate the value of all the trees within one block of their school. A completed table with typical student responses for the school is in Table 1.
| Completed ecological services table for our school. | ||||||||||||||||||||||||||||
|---|---|---|---|---|---|---|---|---|---|---|---|---|---|---|---|---|---|---|---|---|---|---|---|---|---|---|---|---|
|
||||||||||||||||||||||||||||
Day 3: Relationship between crime and tree cover
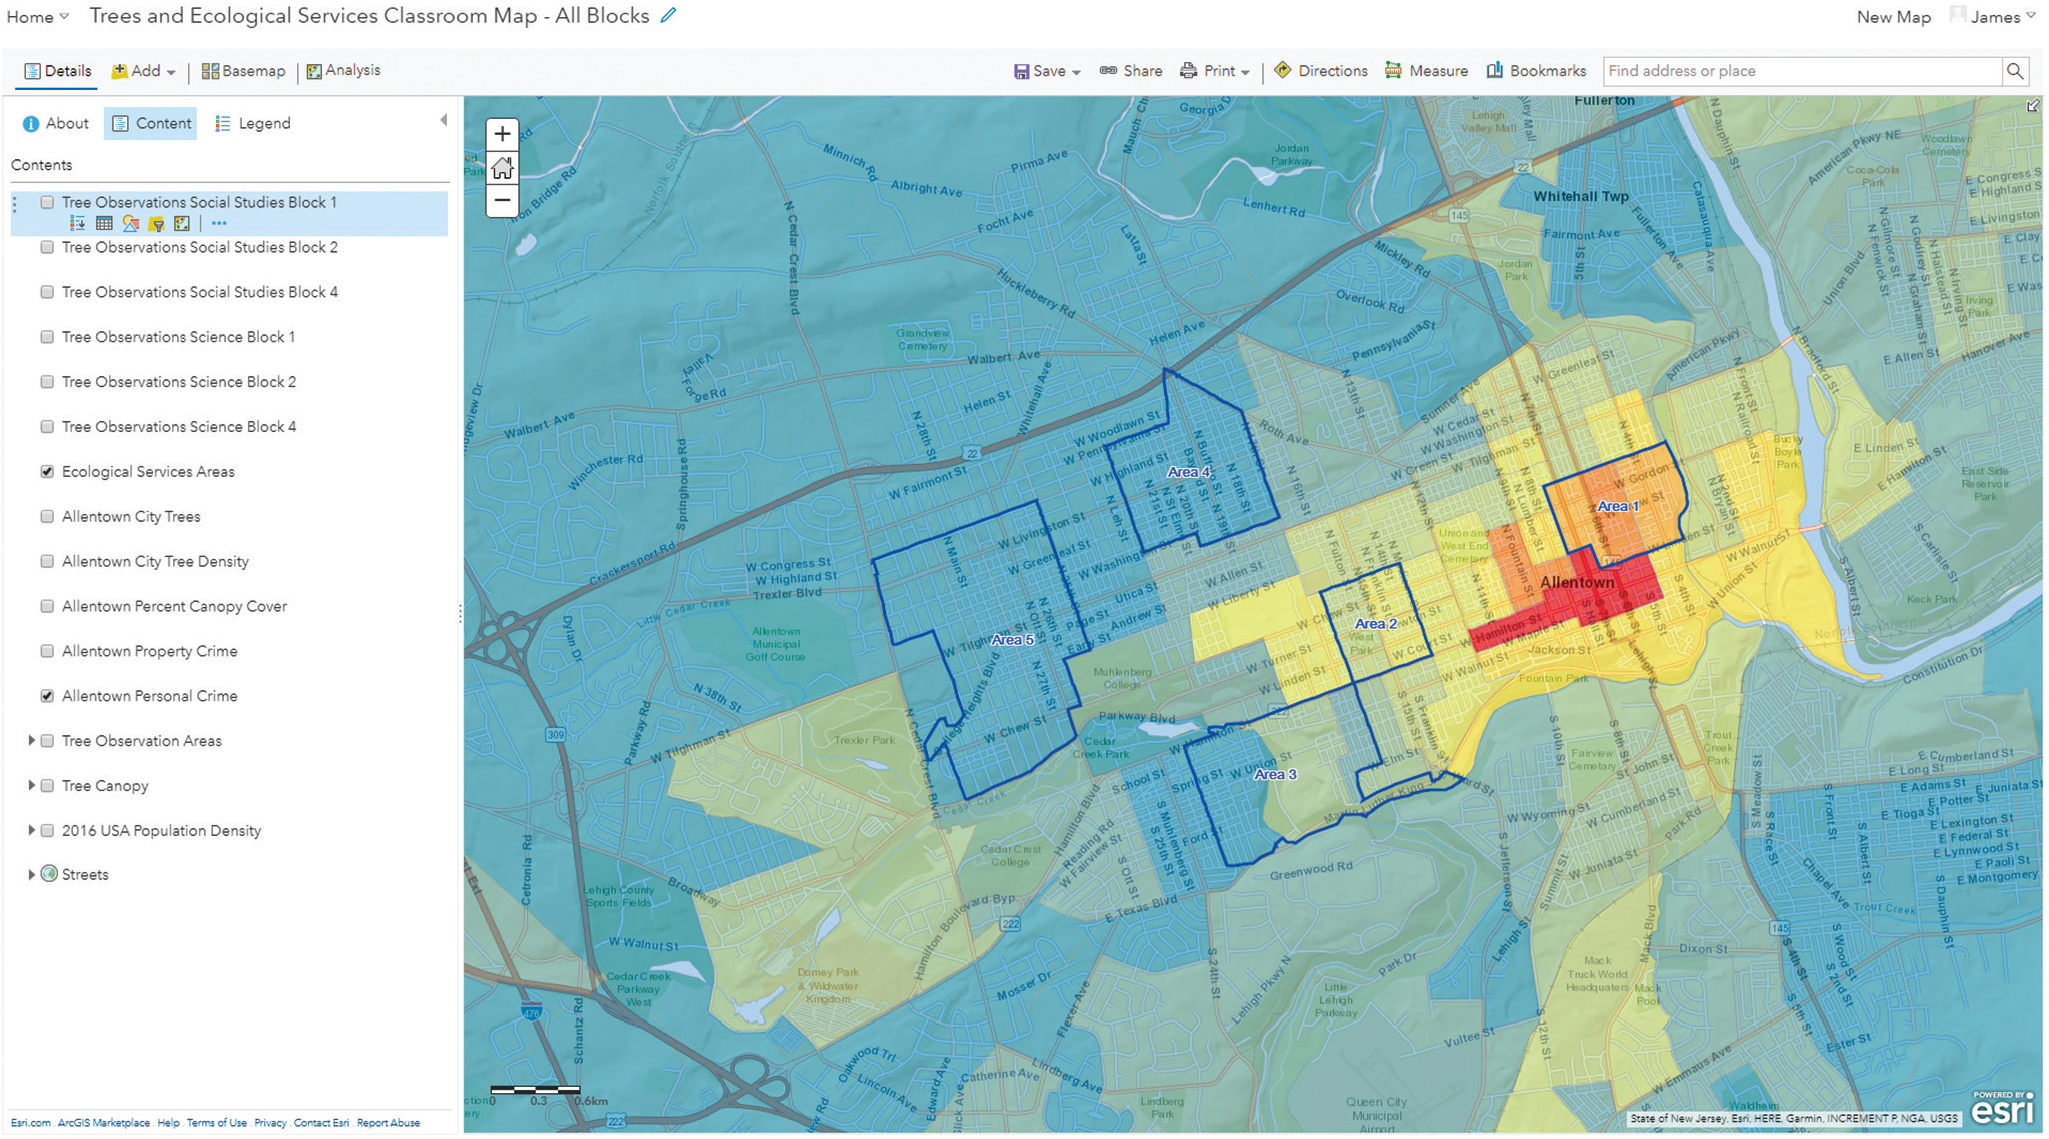
To explore the relationship between crime and tree canopy cover in their city, students view data layers divided into census blocks throughout the city that visually display personal crime, property crime, and percentage of tree canopy cover (Figure 4). Students can also select an individual census block and view more detailed data of specific personal and property crime (Figure 5).
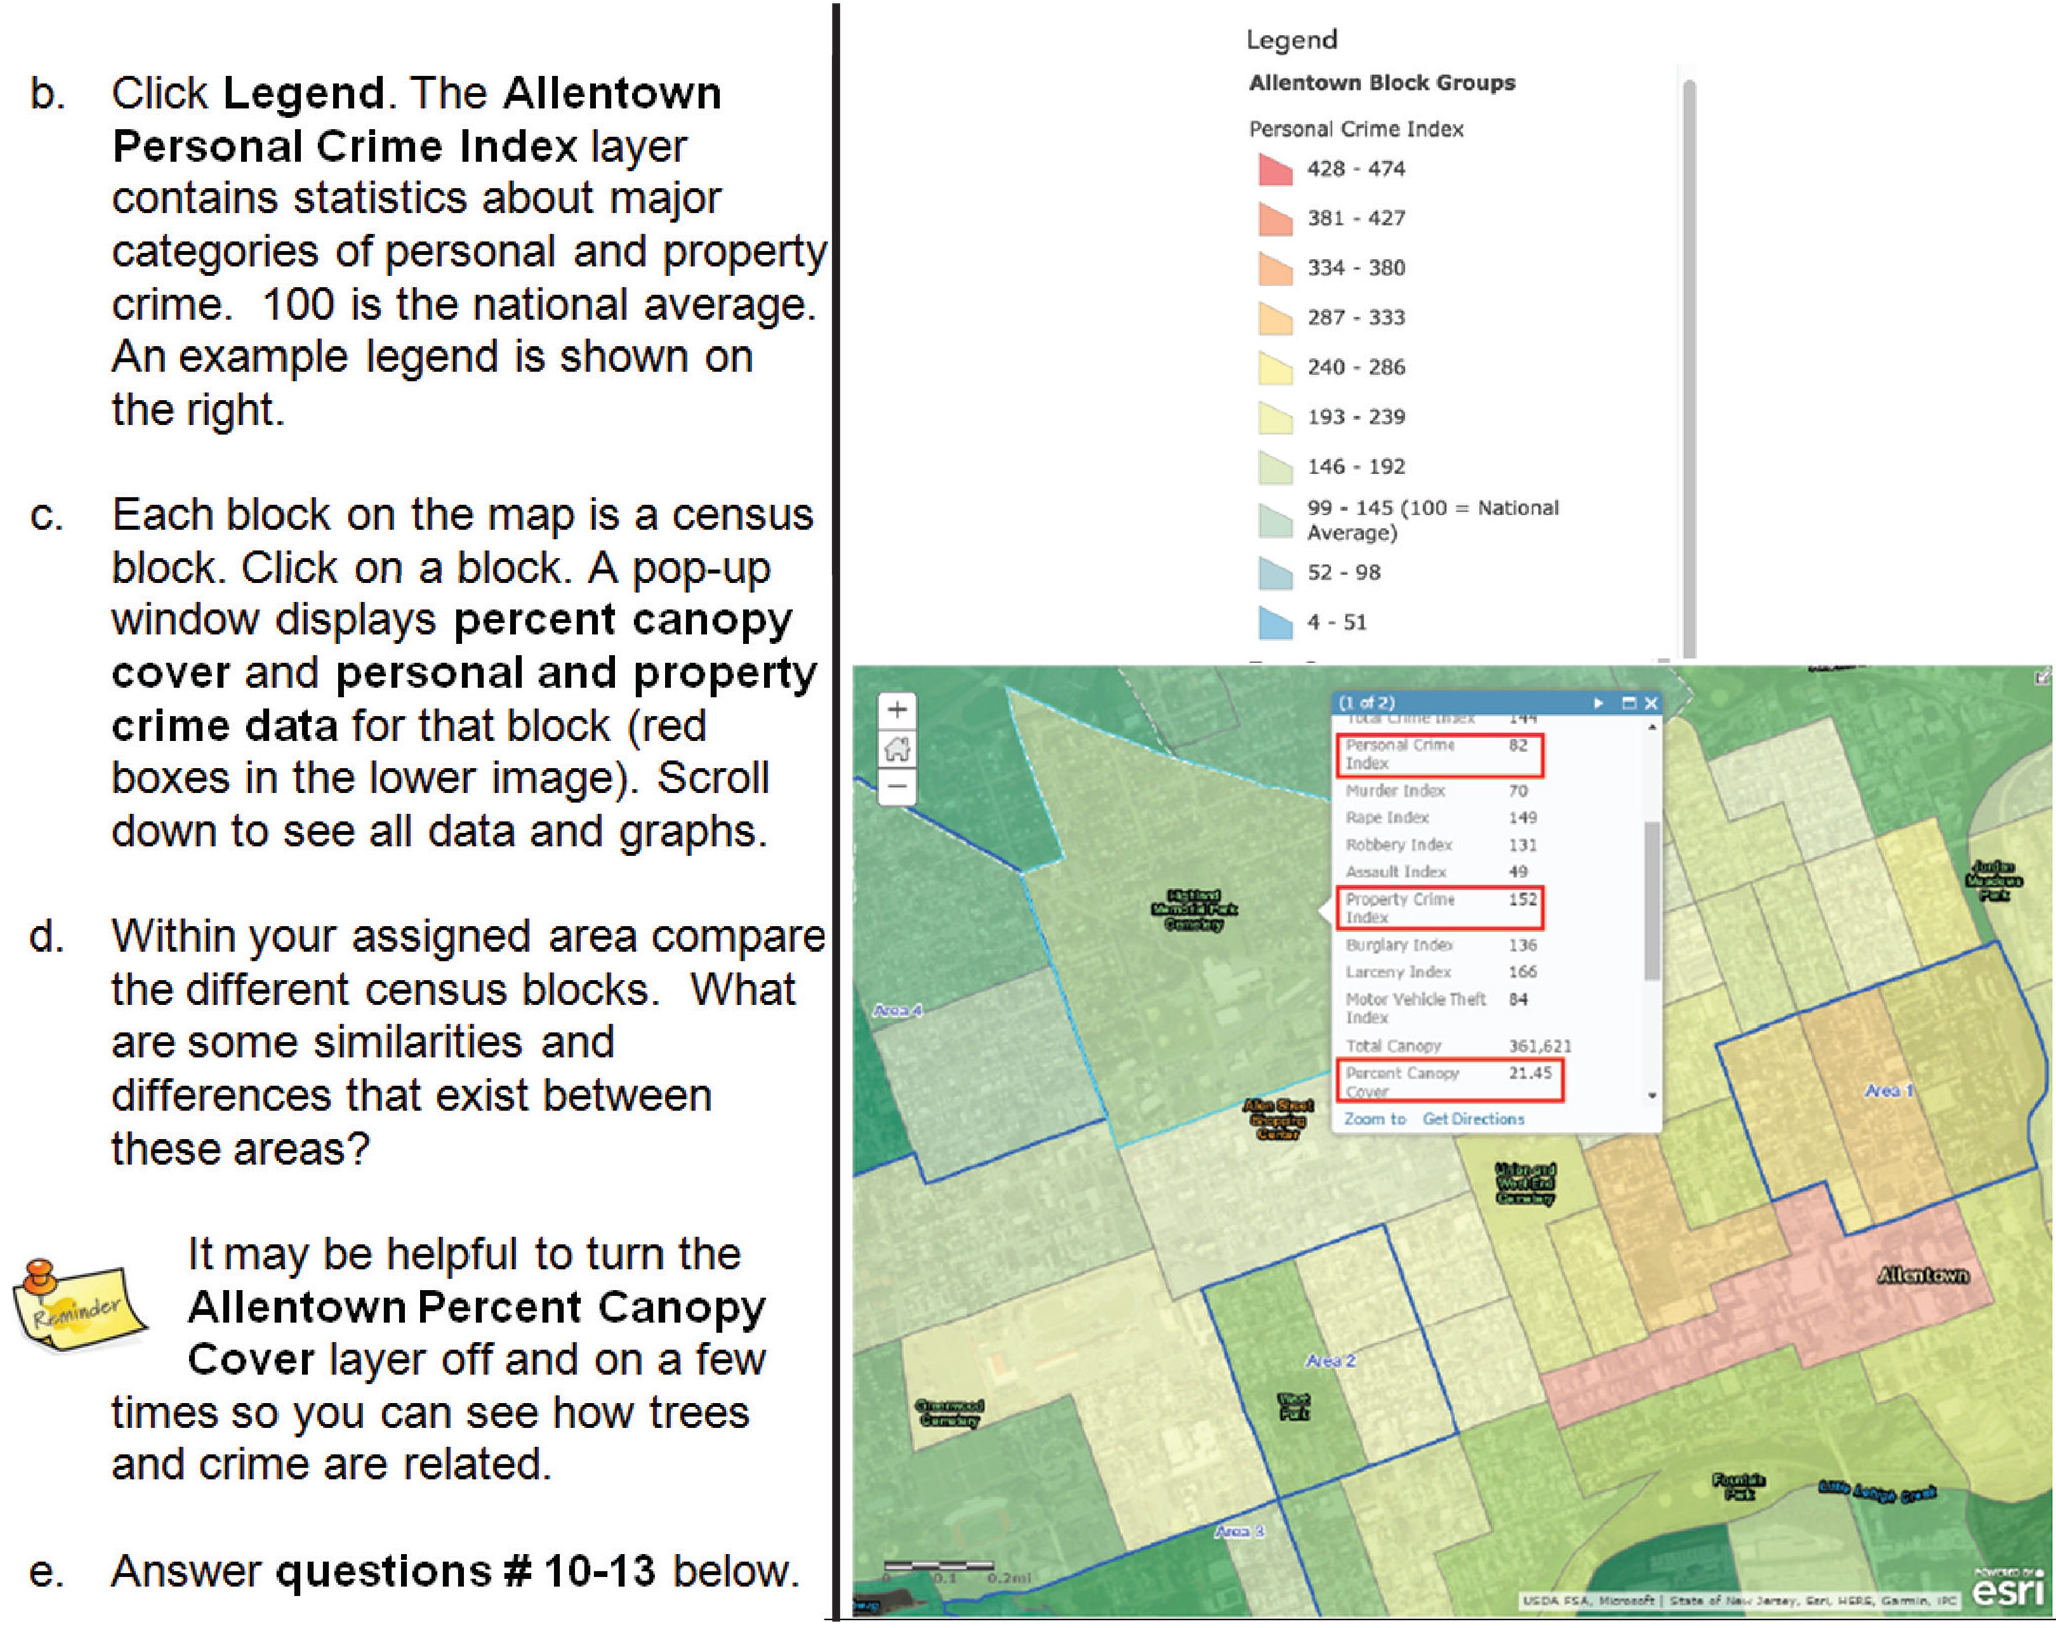
We use design features in our instructional materials that include offset text and boldface fonts to draw attention to key terms in addition to specific visual cues to direct student use of the web GIS (Figure 5) to assist the English learners in our school.
Students examine one of five designated regions around the city, composed of three census blocks. Each student records the personal and property crime and percentage of tree canopy in their area, and then calculates an average for the entire assigned area. Then, as a class, students compare different areas across the city to examine the relationship between tree canopy cover and crime (Table 2, p. 34).
| Completed class data table for five areas of our city. | ||||||||||||||||||||||||
|---|---|---|---|---|---|---|---|---|---|---|---|---|---|---|---|---|---|---|---|---|---|---|---|---|
|
The data show that areas with a greater percentage of tree canopy tend to have less crime. While some students are able to detect the pattern immediately, we arrange the data table to allow the teacher to scaffold the process for identifying patterns and relationships among the data. We can draw students’ attention to the first row—is the crime rate high or low? Is the tree canopy percentage high or low? Students are able to observe that in locations where crime is high, tree canopy cover is low.
Next, we draw students’ attention to the last row and we repeat the questions—is the crime rate high or low? Is the tree canopy coverage high or low? In this row, we observe the inverse: where crime is low, the percent of tree canopy cover is high. If the student has not yet identified this pattern (negative correlation, or an inverse relationship between the two variables), we ask them to predict what they might see in between the extremes—given an average tree canopy percentage, would they expect a high, low, or average crime rate?
Here, we can use the middle row, which conveniently captures this in-between case. It is important to note here with students that while there is a relationship between tree canopy and crime, it is not necessarily one of cause and effect. This interesting relationship has been explored in a number of studies (e.g., Kuo and Sullivan 2001; Troy, Grove, and O’Neil-Dunne 2012; Wolf 2010).
We find this strategy helpful for the English learners in the classroom. As students work with these data relationships—correlation versus causation, negative versus positive correlation—the arrangement of the data table and the teacher’s explicit modeling of the GIS steps involved act as linguistic supports that facilitate their comprehension. For example, the teacher can toggle between the tree canopy layer and the crime layer in the map (see Figure 5) to provide a visual cue to the inverse relationship: In one layer, the white-shaded areas (indicating low tree canopy cover) match the other layer’s red-shaded areas (indicating higher rates of crime).
Correlation does not necessarily mean causation, and it may be useful to have the students consider whether trees cause a decrease in crime (or conversely, lack of trees promotes more crime), or whether high crime areas are those with densest human population or lowest income statistics. This can lead to a fruitful discussion.
Day 4: Investigating your own neighborhood
In the last part of the investigation (Day 4), students compare the tree canopy in their own neighborhood to the city average (30% tree canopy coverage in our city) and distribution, and estimate the number of trees within a block of their home using satellite imagery in ArcGIS Online or another technology such as Google Earth. Students may also take pictures to document their neighborhood and annotate their web GIS map to suggest changes that could enhance the environmental and/or societal health in their community.
Our students have provided a variety of suggestions, including the aesthetic value of trees, the importance of increasing tree canopy to reduce personal and/or property crime, enhancing species diversity in their neighborhood, and reducing carbon dioxide in the atmosphere. These answers reinforce changes that students can make in their local surroundings and to critically reflect on how trees may benefit their community in important ways.

The teacher’s guide (see “On the web”) provides detailed assessment information for each question to which the students respond. We use this as a formative assessment. For a summative assessment, our students complete a map-based tree planting project in which they develop a proposal to plant trees in at least two different areas on the property of their school using at least two different species. This authentic learning task includes a detailed rubric available on the website. In addition, our students present their tree-planting proposals to mentors and members of our community and city government.
Conclusions
Overall, our students submitted satisfactory work, with a wide range of responses to questions and ideas to promote the planting of more trees in geospatially referenced neighborhoods throughout the city. Students quickly learned how to use both the Collector app and ArcGIS Online interface to collect and analyze data. Students thought critically about the benefits trees provide to their city and understood that different species have their own pros and cons that urban planners and property owners must consider.
Many students applied spatial thinking and reasoning skills while collecting and analyzing the data. Most students were able to recognize patterns in urban tree planting. For example, different species of trees along different roads represent an artificial pattern provided by city planners and property owners. Students were able to discuss some positive benefits of trees in urban environments such as cleaner air, lower cooling costs, and enhanced aesthetics.
Students had some difficulty understanding the relationship between tree canopy cover and crime statistics. Students could visualize the inverse spatial relationship between tree canopy cover and crime within the city, but inferring the potential causal relationships between trees and crime was quite difficult for some. During our analysis, we emphasized that correlation is not necessarily causation. Discussing the extent to which trees provide a local environment less conducive to crime, or to which city planners neglect urban forestry in economically disadvantaged areas proved to be more complex than could be accomplished within the context of the investigation.
We found that most of our students were actively engaged in this investigation. The students enjoyed using both the Collector app and ArcGIS Online. By the end of the investigation, our students had a more comprehensive understanding about the ecological services that are provided by urban trees. The concepts and learning activities can be adapted for any other school environment. When analyzing their own local environment, students learn the benefits trees provide to their community and can formulate actions that can be taken to improve that community.
Environmental Science High School