
Research and Teaching
An Introvert’s Perspective: Analyzing the Impact of Active Learning on Multiple Levels of Class Social Personalities in an Upper Level Biology Course
Journal of College Science Teaching—January/February 2020 (Volume 49, Issue 3)
By William C. Beckerson, Jennifer O. Anderson, John D. Perpich , and Debbie Yoder-Himes
With calls to reassess higher education teaching methods, active learning practices have quickly become a popular alternative to traditional lectures, especially in STEM courses that traditionally rely heavily on large-lecture formats. In this regard, active learning environments stand to better prepare students for life after college; however, student personality may play a major role in how students perform in these settings. Our research examines the effect that active learning environments have on the performance of individuals by a variety of personality types, determined by the IPIP Big Five Measures of Personality. Although our research found a trend toward improved tests scores overall for those who attended group-based learning sessions in an active learning environment, we found statistically significant differences between how introverts and extroverts perform on exam questions pertaining specifically to material covered in the groupbased active learning sessions. This research highlights that class composition of personality plays an important role in how active learning should be implemented and provides evidence that active learning is not a one-size-fits-all practice.
There have been frequent calls to reform science education teaching practices in recent years, many of which remain the same as they were decades ago (among others, see Baepler, Walker, & Driessen, 2014; Crouch & Mazur, 2001; Freeman et al., 2014; Haak, HilleRisLambers, Pitre, & Freeman, 2011; Khourey-Bower, 2011; Smith. Sheppard, Johnson, & Johnson, 2005). As our understanding about how student learning evolves, so should curriculum and methodology to match. One such approach to modernizing instruction on college campuses is the introduction of active learning settings. Active learning is anything course related that students in a course are asked to do other than watching the instructor, listening to content, and taking notes (Felder & Brent, 2009). Active learning also facilitates higher levels of learning. Although typical lectures rely heavily on memorization, Bloom’s taxonomy of learning demonstrates that there are several levels of thinking, many of which lead to better retention and ability to apply learned material than those used in typical lecture settings (Croew, Dirks, & Wenderoth, 2008).
Although some active learning teaching strategies target individuals—for example, one-minute papers (Svickni & McKeachie, 2014) and quick writing (Green, Smith, & Brown, 2007)—most tend to involve paired or small-group interactions in an attempt to engage students in these higher order learning practices (Angelo & Cross, 1993; Prince, 2004). High-tech, interactive spaces called active learning classrooms (ALCs) have emerged at institutions around the world to facilitate student interactions in small-group, collaborative configurations. Implementation of ALCs, and their promising changes to the way we disseminate coursework, have led the nonprofit research group Educause to declare ALCs the top strategic technology for 2017 (Brooks, 2017).
The University of Louisville (UofL) is one of many institutions that has installed several such classrooms that provide a cutting-edge active learning environment to test instructional technologies, observe new pedagogies, and develop novel teaching strategies to drive students’ success during and after their undergraduate education. UofL piloted its version of an active learning classroom in 2016, with a space the institution refers to as the TILL (Teaching Innovation Learning Lab). The TILL is equipped with moveable furniture, mobile whiteboards, speakers with individual group microphones, Wi-Fi, and multiple monitors equipped with content-sharing software. Since its introduction, UofL has opened an entire classroom building full of ALCs modeled after the TILL. Although many studies have demonstrated the efficacy of the active learning environment (Favero, 2011; Haak et al., 2011; Hake, 1998; Hung, 2015, 2017; Kortz, Smay, & Murray, 2008; Morosan, Dawson, & Whalen, 2017; Prince, 2004), and many institutions have begun to incorporate classrooms to facilitate this modern style of teaching, there remains a need for more in-depth analysis into whether these new teaching methodologies improve information retention and application among all students of various backgrounds and personalities.
On the aggregate level, research has consistently suggested that active learning improves student performance. When comparing active learning environments to courses featuring traditional lecture, students in ALCs achieve higher marks (Crouch & Mazur, 2001; Haak et al., 2011; Hake, 1998; Kortz et al., 2008). In one meta-analysis of STEM (science, technology, engineering, and mathematics) courses, student performance was almost half a standard deviation higher on exams, concept inventories, and other assessments (Freeman et al., 2014). This finding repeats with minor variations across not only STEM disciplines, but also in education, humanities, business, and more (Favero, 2011; Hung, 2015, 2017; Morosan et al., 2017; Prince, 2004).
Although there are many studies that approach the efficacy of active learning from an institution group level, fewer take into account how active learning teaching strategies interact with individual-level characteristics. The existing body of research on effects of active learning pedagogies at the individual level has found active learning largely affects individuals in similar ways, regardless of a student’s background or demographic characteristics. Many individual-level variables appear to have no effect on a student’s likelihood to benefit from active learning pedagogies, including gender, major, academic classification, and seating position within the classroom (Park & Choi, 2014). Although considering individual academic background, active learning benefits students of all levels of academic ability (Chiu &d Cheng, 2017), but it tends to have a disproportionately positive effect on poorly prepared but capable students (Haak et al., 2011).
Modeling how active learning impacts the student body at various levels, from entire classes, to groups, to the individual, is essential for providing recommendations for new teaching practices. This multivariate approach is especially significant for designing an optimal curriculum for various group compositions of students rather than a single one-size-fits-all method. In addition to renovating the classroom setting, understanding that no two classes of students are the same is vital for change in an outdated education system.
Although the implementation of active learning practices will undoubtedly contribute to higher level learning in class, dissemination of large portions of curriculum in large lecture halls is likely to remain necessary, especially for larger universities; however, supplementing this approach with occasional active learning sessions may improve student success. Both teaching and learning are social endeavors that benefit from the expression of diverse and varying viewpoints, viewpoints that are much easier to express in small group settings and are integral for creating an inclusive culture.
Active learning environments that enable the exchange of ideas not only provide multiple ways of looking at a problem, but also reflect the types of environments students will face in the workforce after college. Therefore, determining classroom conditions that encourage learning by a community of students can improve learning in students as a collective and prepare them further for their future careers. Because active learning relies so heavily on social interactions between students, understanding how social personalities (e.g., level of extroversion) affect the structure, exchange of ideas, and participation in active learning settings is imperative for providing suggestions for best-practice methods, and for promoting various formats for the classroom environment that reflect diverse social compositions in multiple fields of academia.
Although each class varies in social composition from year to year, there are often observable trends among different fields of academia. In reference to the STEM disciplines, there is an overall trend for more introverted individuals, and given that many introverts struggle with social interactions, albeit to various degrees, active learning may put introverts at a disadvantage. Although often described as a dichotomy, social personality exists in various complex flavors and on a scale of degree of extroversion. To differentiate between these various levels, our research utilizes the IPIP (International Personality Item Pool) measures of the Big Five Markers to group these social phenotypes into categories on the basis of their tested level of extroversion, agreeableness, conscientiousness, neuroticism, and openness to experiences, all of which play an important role in group-based activities. The IPIP measure of Big Five Markers examination is a standardized 50-item questionnaire that administers a psychological assessment of the participant’s social personality (Goldberg, 1992, 1999). The IPIP is available to the public domain and has been a standard test for social personality for over 2 decades (Johnson, 2017).
Based on the results of these surveys, our objectives were to: (a) determine if active learning environments promote improved exam scores in the class as a whole; (b) characterize the relationship between the social personality and performance on exam questions, both overall and those relating specifically to material learned during active learning settings; and (c) identify how social personality contributes to group perception within the active learning sessions.
Materials and methods
Preliminary analysis of personality distribution
To demonstrate the difference between group composition of personality among upper level classes, our study tested several classes, both within the discipline of biology and from different fields of study at the UofL in the fall of 2018. From these classes, eight courses set aside time for a voluntary participation study of the students. Students in these classes were given the option to complete the same IPIP Big Five Measures of Personality exam that were completed by students from the BIOL 357 General Microbiology course, around whom this study is focused. Results from the surveys for students who signed the consent form were recorded and averaged by course.
General procedural framework
This research uses a multivariate study design wherein the research question is approached using both qualitative and quantitative data. Thirty-three students from BIOL 357 General Microbiology agreed to participate in the study in the spring 2018 semester. Participating students were required to attend only two of four available active learning sessions during the semester, sessions that were available during the second, third, and fourth units of the class. During active learning sessions, each group of students was further divided at random into groups of approximately six students for the class activities. During the units where the participants did not attend the active learning sessions, the participants instead received an online video lecture during which the instructor walked students through a similar exercise covering the same material, as would be the norm for a passive learning lecture environment. At the end of each unit (roughly a quarter of the semester long), students were given a multiple-choice test of the material. Overall exam scores were recorded for every participant for each of the four exams corresponding to each of the four units. For the second, third, and fourth exams, student responses to questions directly pertaining to the active learning session materials were also analyzed for correct/incorrect answers and compiled for each student.
In addition to their participation in the active learning sessions, participating students were also required to complete the IPIP Big Five Markers examination to determine their degree of respective social personalities, on a scale from 10 to 50, for Extroversion, Agreeableness, Conscientiousness, Neuroticism, and Openness to New Experiences. A standardized scoring key, available at , was used to rate student responses and assign categorical groupings based on the class range of personalities. Students were placed into various categories based on their scores for Extroversion on the IPIP survey and the overall range of scores in the class. These personality groups were compared with test scores after the respective active learning sessions, for groups that attended and groups that did not attend the active learning session. Overall exam scores, as well as scores on a subset of questions that particularly addressed material covered during the active learning sessions or lecture alternatives, were compared between groups that participated in active learning sessions and those that received the typical lecture style for the same material instead.
Each student was required to actively participate in attended active learning sessions, and peer evaluations were designed to observe fellow group members’ contributions. To ensure some level of participation, each student was also assigned, at random, particular roles to perform within their group. Furthermore, during each group’s scheduled participation in active learning sessions, participants were required to complete a peer evaluation to rate the performance of their fellow group members during each active learning session (Supplement 1; available at ), as well as a questionnaire used to gauge each student’s personal response to the active learning environment (Supplement 2; available at ).
Ethical considerations in research with human subjects
Only students over the age of 18 were invited to participate in the study. All students, regardless of their participation, were given a consent form that outlined participant responsibilitiesin the study; however, only subjects that agreed to the terms and signed the consent form were included in this study. Furthermore, students that agreed to participate in the study were given the option to withdraw from the study at any time, although none did.
To ensure the privacy of all participants, measures were taken to protect the identity of all subjects. During the data collection period of all trials, student names were only used initially to compile information from each person. After the initial data collection period, student names were replaced by randomized identifiers. All data analyses were conducted using these identifiers with no access to original student names. No student was given access to their own or others’ data or results during or after the course of this study.
Statistical analysis of the results
All statistical analyses were performed using RStudio. The packages “lme4” and “lmertest” were used to perform a three-way analysis of variance (ANOVA) to test for a significant effect between the tested unit, personalities, and active learning class attendance on student exam performance. The variables examined in this study are listed in Table 1. Student surveys and peer evaluations were used to rule out a lack of participation by students in the active learning session, but were not included in any of the ANOVA analyses.
| Table 1 | ||||||||||||||||||||||||||||||||||||||||||||||||||||
|---|---|---|---|---|---|---|---|---|---|---|---|---|---|---|---|---|---|---|---|---|---|---|---|---|---|---|---|---|---|---|---|---|---|---|---|---|---|---|---|---|---|---|---|---|---|---|---|---|---|---|---|---|
|
||||||||||||||||||||||||||||||||||||||||||||||||||||
Results
General personality distribution in upper level A&S classes
Results from our interdisciplinary survey were averaged by class (Figure 1). Our results showed fairly consistent ranges of scores for each personality across all 194 students who participated in the IPIP survey: Extroversion (12–50), Agreeableness (21–50), Conscientiousness (17–50), Neuroticism (13–47), and Openness (21–50); however, although the average score indicated a normal distribution for Extroversion (30.99) and Neuroticism (28.95), Agreeableness, Conscientiousness, and Openness exhibited a skew toward the higher end of the scale with an average score of 39.85, 36.08, and 37.63, respectively. IPIP survey results were also complied following the parameters used to categorize degree of Extroversion into personality types for this study in Figure 2. Microbiology had a higher ratio of introverts compared with other classes within the Biology Department, as well as across the spectrum of classes at UofL, with an average score of 28.09 compared with the average score of 30.99 across all nine classes (Figure 2).
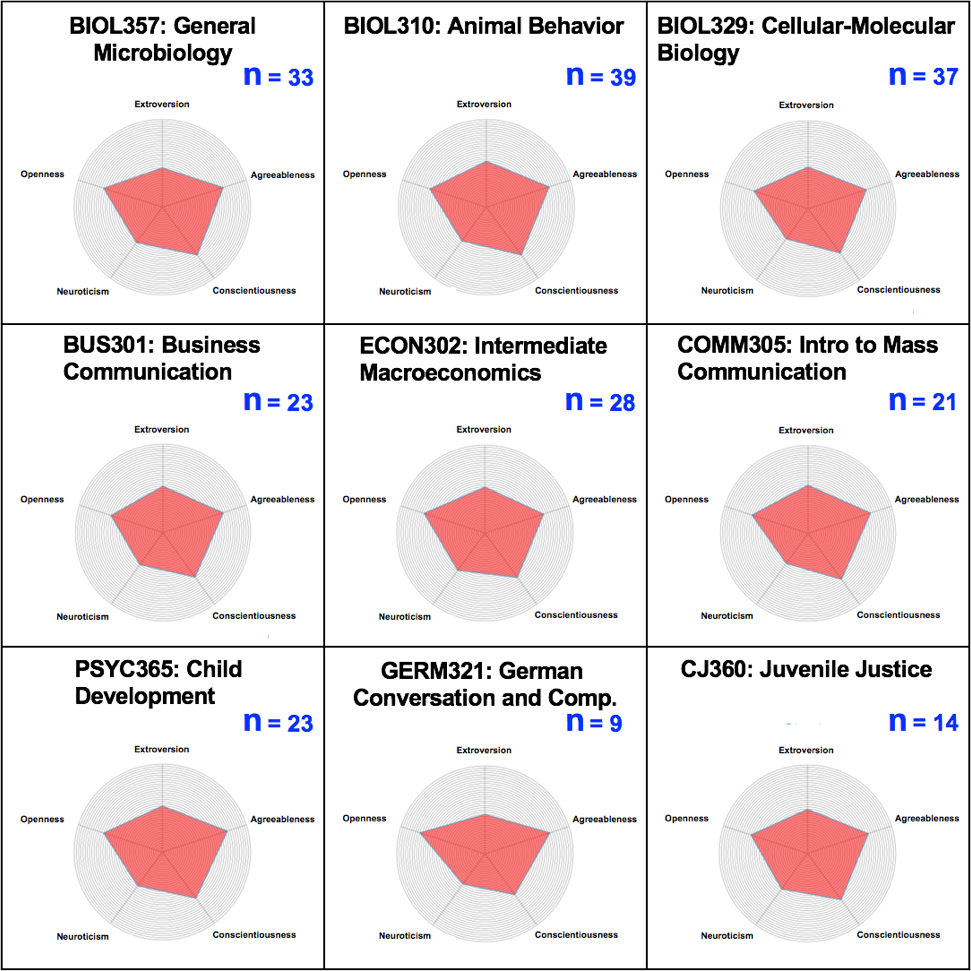
Radar chart of average scores in Extroversion, Agreeableness, Conscientiousness, Neuroticism, and Openness to New Experiences, by class. The top row shows the differences between classes within the discipline of Biology, and the bottom two rows show the group composition of personalities in classes from other disciplines at the University of Louisville. Each ring represents 1 point with the outer ring representing the maximum score (50) and the inner most ring representing the minimum score (10).
Radar chart of average scores in Extroversion, Agreeableness, Conscientiousness, Neuroticism, and Openness to New Experiences, by class. The top row shows the differences between classes within the discipline of Biology, and the bottom two rows show the group composition of personalities in classes from other disciplines at the University of Louisville. Each ring represents 1 point with the outer ring representing the maximum score (50) and the inner most ring representing the minimum score (10).
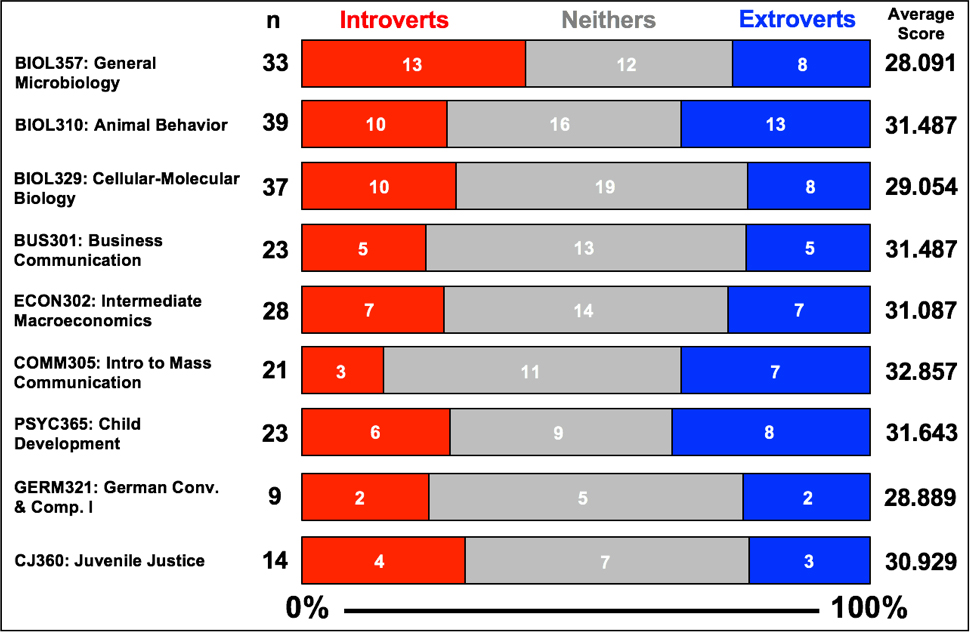
Distribution of Extroversion by class, as defined by this study (10–23 = Introvert; 24–37 = Neither; 38–50 = Extrovert). Average scores for level of Extroversion are listed on the right with a possible range of scores of 10–50. The color-coded bars indicate the relative percentage of students that are categorized as introverted (red), neither (grey), and extroverted (blue) for each class. Each bar also includes a number indicating the number of students that were grouped into that personality type, by class (red = Introvert, gray = Neithers, blue = Extroverts).
Distribution of Extroversion by class, as defined by this study (10–23 = Introvert; 24–37 = Neither; 38–50 = Extrovert). Average scores for level of Extroversion are listed on the right with a possible range of scores of 10–50. The color-coded bars indicate the relative percentage of students that are categorized as introverted (red), neither (grey), and extroverted (blue) for each class. Each bar also includes a number indicating the number of students that were grouped into that personality type, by class (red = Introvert, gray = Neithers, blue = Extroverts).
Survey results and distribution of participants in Microbiology
The IPIP survey results demonstrated two general distributions of scores for the five measured personality types within our General Microbiology class. These scores reflected the trends observed in the findings from all 194 participants. Extroversion and Neuroticism were represented across the entire range of possible scores (10–50); however, Agreeableness, Conscientiousness, and Openness to New Experiences all exhibited reduced ranges of scores and were skewed toward the higher end of the possible range of scores. The same trends observed in our analyses are consistent with findings from the Open-Source Psychometrics Study on IPIP, which demonstrated that when the test was offered to 10,189 individuals on the Internet, degree of Extroversion and Neuroticism exhibited a normal distribution across the 10–50 range of possible scores with Agreeableness and Openness to New Experiences being skewed to the higher end of the range, and Conscientiousness falling in between the two groups. The distribution of scores for students in our General Microbiology class are shown in Table 2.
| Table 2 | |||||||||||||||||||||||||||||||||||||||||||||||
|---|---|---|---|---|---|---|---|---|---|---|---|---|---|---|---|---|---|---|---|---|---|---|---|---|---|---|---|---|---|---|---|---|---|---|---|---|---|---|---|---|---|---|---|---|---|---|---|
|
|||||||||||||||||||||||||||||||||||||||||||||||
Although our findings are consistent with the Open Source Psychometrics Study, the IPIP warns against interpreting the distribution of this survey based on any “norm,” as results can fluctuate significantly between sample populations. Therefore, to normalize the range of scores for statistical analysis based on the population of General Microbiology students in this study, each personality type was further divided into subcategories on the basis of the distribution of answers for the class as a whole. Level of Extroversion and Neuroticism were easily divided into a grouping of three categories with normal distribution, individuals who are on the introverted or lower range of the scale, “Introverts/Low”; individuals who were not extreme on either end of the scale, “Neithers/Medium”; and individuals who trended toward the more extroverted or the higher end of the scale, “Extroverts/High.” Agreeableness, Conscientiousness, and Openness to New Experiences were not normally distributed across the range of possible scores and showed skewing towards the higher end of the scale. To account for this, these groups were subdivided into “low” and “high” categories based on the range of class responses (Table 3).
| Table 3 | ||||||||||||||||||||||||||||||||||||||
|---|---|---|---|---|---|---|---|---|---|---|---|---|---|---|---|---|---|---|---|---|---|---|---|---|---|---|---|---|---|---|---|---|---|---|---|---|---|---|
|
||||||||||||||||||||||||||||||||||||||
Because the majority of students in this study scored high in Agreeableness, Conscientiousness, and Openness to New Experiences, the subcategories used in this study are specifically in reference to the range of a student body representative of a higher level microbiology class and should be only be considered “High” or “Low” with such framework in mind. Further studies looking at the correlation between these personality types and other majors should consider reevaluating the distribution of these personality types, as “Low” for a typical microbiology student may be high for a typical student from another field. The adjusted distribution of student responses into subcategories, following these normalization parameters, are listed in Table 3.
Comparing exam scores by personality and ALC attendance
The grade distribution for each of the four unit exams was analyzed to determine if any bias exists in the distribution of exam scores depending on the particular unit being tested. We found that each of the four exams exhibited a fairly normal distribution of scores as demonstrated in Figure 3; however, individual unit had a significant impact on student performance overall and on active learning–specific questions (p-value 3.05e–3, and p-value 4.8e–7, respectively), but showed no significant correlation when paired with personality or type of learning environment.
One student was a no-show on Exam 4; therefore, the data point was removed from further analyses as the student did not receive a zero for their performance, but rather for not taking the exam at all, and therefore should not be considered in correlation analyses between exam performance and other factors.
To test for the overall impact of the active learning sessions on the class as a whole, the overall exam scores for each exam were averaged, grouped by personality subtypes, and compared between groups that attended the active learning sessions and groups that received online passive learning lessons (Figure 4). The comparison showed a general trend for improved overall exam scores for those who attended the active learning sessions compared with those who did not, regardless of personality type, findings that are consistent with many previous studies; however, our findings were not statistically significant (p-value = 0.33; Figure 4).
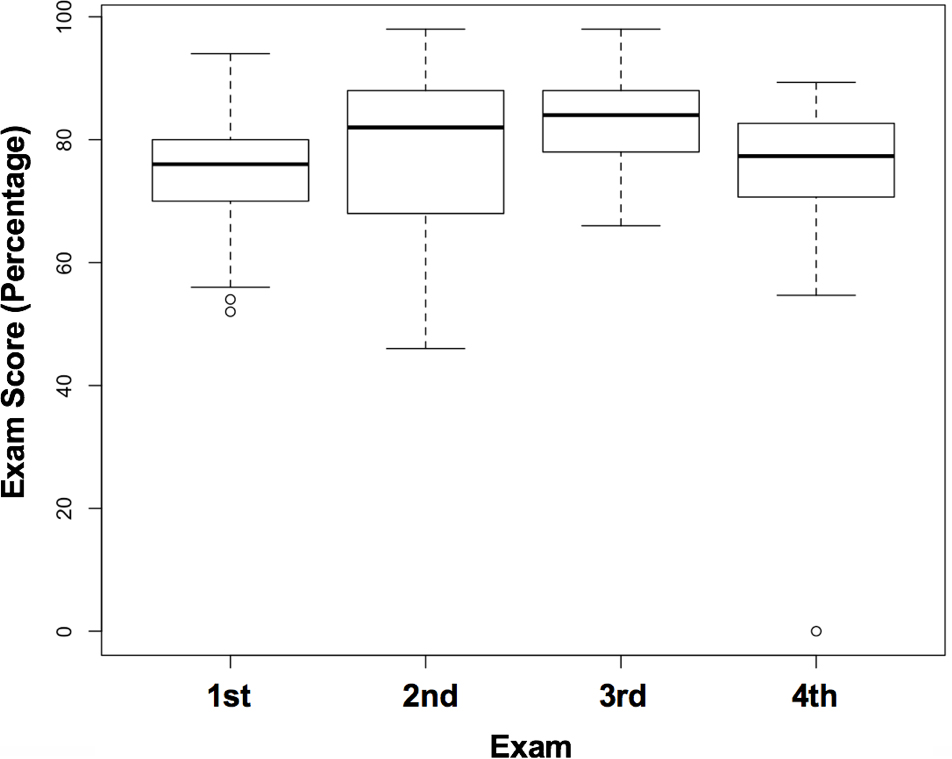
Distribution of overall exam scores for each of the four unit exams. Exam 2 contained material from Unit 1, the third exam contained material pertaining to Units 2 and 3, and Exam 4 contained material from Unit 4. The box and whiskers represent quartiles. The bolded middle line represents the average. Open circles are data points determined to be outliers, by the “boxplot” function of R, for the given range of exam scores. The outliers from the first unit were included in the analyses; however, the outlier for the fourth unit was due to a student who was a no-show for the exam and therefore the data point was removed from analyses pertaining to exam performance.
Distribution of overall exam scores for each of the four unit exams. Exam 2 contained material from Unit 1, the third exam contained material pertaining to Units 2 and 3, and Exam 4 contained material from Unit 4. The box and whiskers represent quartiles. The bolded middle line represents the average. Open circles are data points determined to be outliers, by the “boxplot” function of R, for the given range of exam scores. The outliers from the first unit were included in the analyses; however, the outlier for the fourth unit was due to a student who was a no-show for the exam and therefore the data point was removed from analyses pertaining to exam performance.
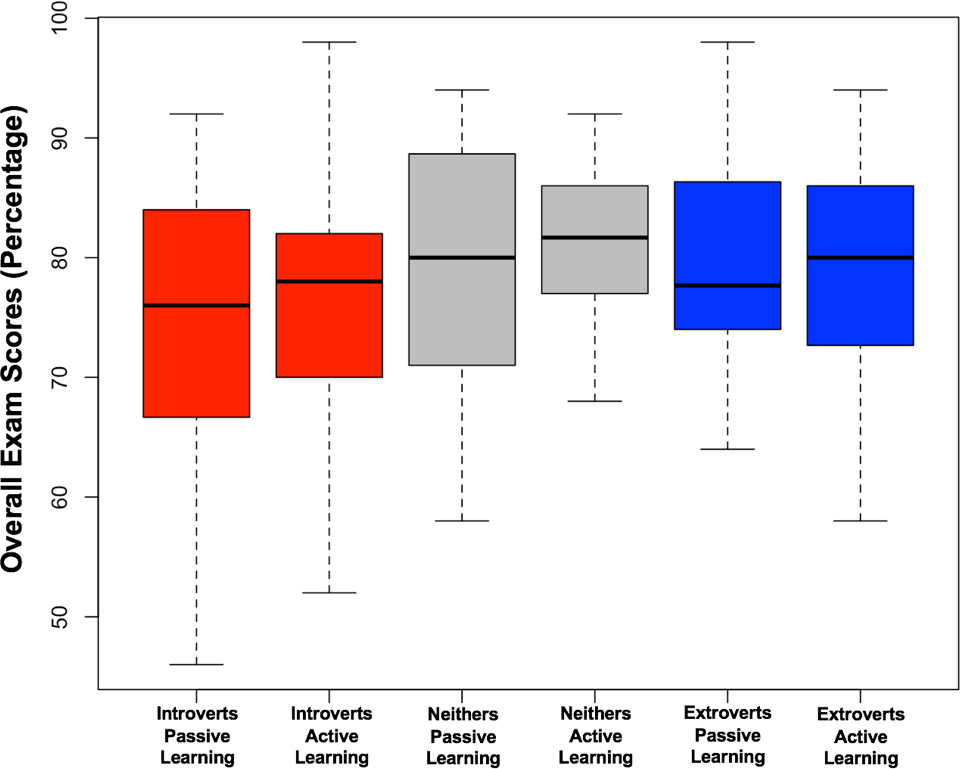
Average distribution of overall exam scores by personality type for groups who attended the active learning sessions and groups who attended the passive lecture. The box and whiskers represent quartiles. The bolded middle line represents the average. Type III ANOVA (analysis of variance) was used to test for significance (p-value 0.33).
Average distribution of overall exam scores by personality type for groups who attended the active learning sessions and groups who attended the passive lecture. The box and whiskers represent quartiles. The bolded middle line represents the average. Type III ANOVA (analysis of variance) was used to test for significance (p-value 0.33).
Although there was a positive correlation for overall exam performance for those who attended the active learning sessions, a different trend was observed when performing the same analysis for scores including only exam questions pertaining specifically to the material covered by the active learning sessions and their corresponding lecture alternative (Figure 5). Figure 5 shows a statistically significant difference between how individuals performed on active learning–specific questions by personality type. Introverted individuals who attended the active learning sessions did worse on average than introverts who received the passive lecture alternative, whereas little difference was observed between individuals who are neither introverted nor extroverted, and the opposite trend was observed in extroverted individuals, demonstrating that extroverts who attended the active learning session performed better on active learning–specific exam questions compared with extroverts who received the passive lecture alternative.
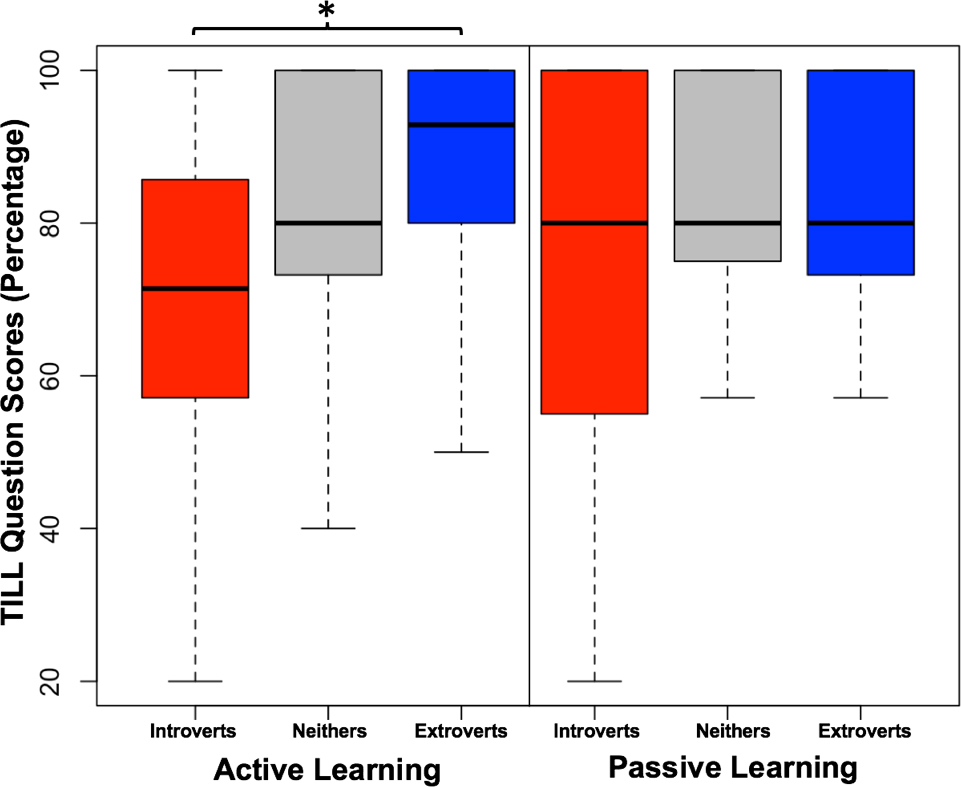
Average distribution of scores for a subset of exam questions pertaining to material specifically covered by the active learning sessions and corresponding passive learning alternatives, by personality type for groups who attended the active learning sessions and groups who did not attend the active learning sessions. The box and wiskers represent quartiles. The bolded middle line represents the average. Type III analysis of variance with Satterthwaite’s methods showed a statistically significant difference (p-value = 3.10e–2) between active learning–specific question performance with regards to personality types and active learning.
Average distribution of scores for a subset of exam questions pertaining to material specifically covered by the active learning sessions and corresponding passive learning alternatives, by personality type for groups who attended the active learning sessions and groups who did not attend the active learning sessions. The box and wiskers represent quartiles. The bolded middle line represents the average. Type III analysis of variance with Satterthwaite’s methods showed a statistically significant difference (p-value = 3.10e–2) between active learning–specific question performance with regards to personality types and active learning.
Although the relationship observed between personality, ALC attendance, and active learning–specific exam scores was statistically significant (p-value = 3.10e–2), no other statistically relevant trends were observed for the same analysis repeated with the other four personality types, although the relationship between conscientiousness, ALC attendance, and active learning–specific exam performance was approaching significance (p-value = 7.23e–2; Table 4).
| Three-way ANOVA results for personality subtypes. | ||||||||||||||||||||||||||||||||||||||||||
|---|---|---|---|---|---|---|---|---|---|---|---|---|---|---|---|---|---|---|---|---|---|---|---|---|---|---|---|---|---|---|---|---|---|---|---|---|---|---|---|---|---|---|
|
Peer evaluations and student surveys
To analyze whether student performance on exams could be explained by their degree of participation in the active learning sessions, student feedback about individuals from their group was compared with overall exam scores as well as their performance on active learning–specific exam questions (Figure 6). Students were privately evaluated by every other member from their group, usually consisting of five other students. Each student was evaluated in four areas; Preparation, Contribution, Listening, and Focus, and was rated between 1 to 5 points (Supplement 1). To encourage student participation, students also received a score based on their average peer evaluations as part of their ALC participation grade. Superscores of the averages for each student were used in the comparison. Although there was a general positive correlation between exam scores and student peer evaluation superscores, there is no apparent significant difference between the trends by personality type.
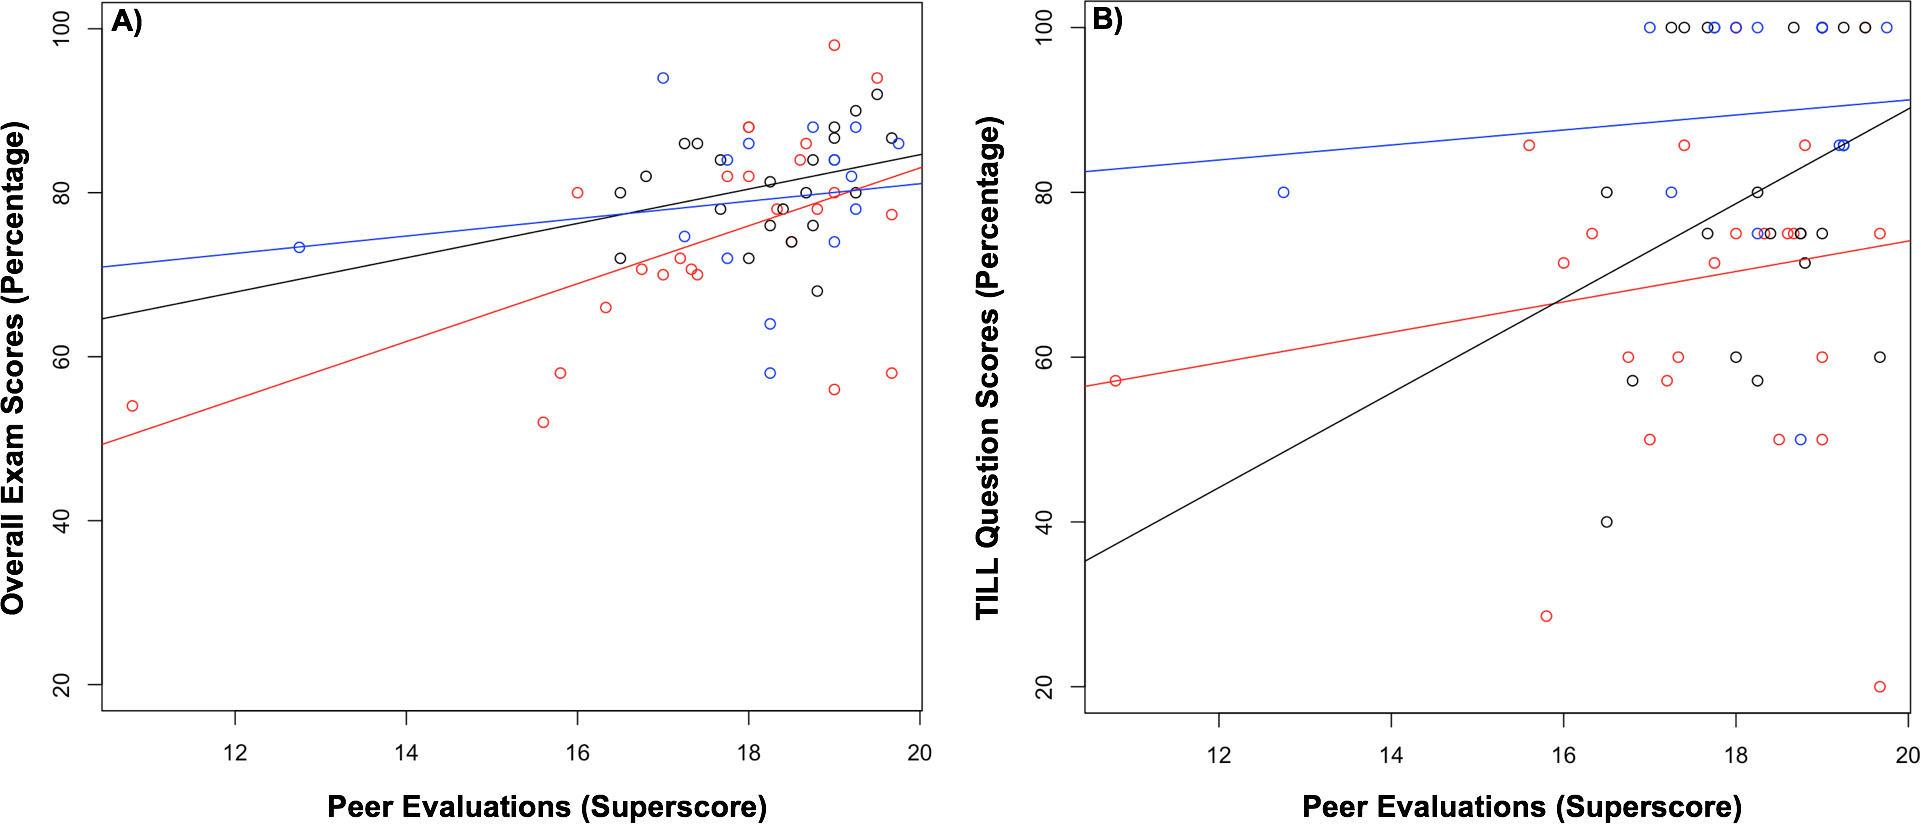
(A) Students’ average performance on all four exams by their average superscores from their peer evaluations during active learning classroom (ALC) sessions. (B) Students’ average performance on active learning– specific questions for all four exams by their average superscores from their peer evaluations during ALC sessions. Red dots represent introverted individuals, black dots represent neither individuals, and blue dots represent extroverted individuals. The average peer evaluation superscore for each personality group is 17.36 for introverts, 18.30 for neithers, and 18.08 for extroverts.
(A) Students’ average performance on all four exams by their average superscores from their peer evaluations during active learning classroom (ALC) sessions. (B) Students’ average performance on active learning– specific questions for all four exams by their average superscores from their peer evaluations during ALC sessions. Red dots represent introverted individuals, black dots represent neither individuals, and blue dots represent extroverted individuals. The average peer evaluation superscore for each personality group is 17.36 for introverts, 18.30 for neithers, and 18.08 for extroverts.
Furthermore, each student participating in the ALC was required to fill out a survey to gauge individual preference toward the active learning environment. The responses to three questions specifically pertaining to the individual students’ opinions about the ALC are shown in Figure 7, by personality type. Although there were no noticeable differences between the opinions of introverts and neithers, it is apparent that extroverts generally preferred the experience more than the other two personality types with an average score of 4.53 compared with 3.59 for introverts and 3.61 for neithers. The complete student survey is included in supplemental documents (Supplement 2).
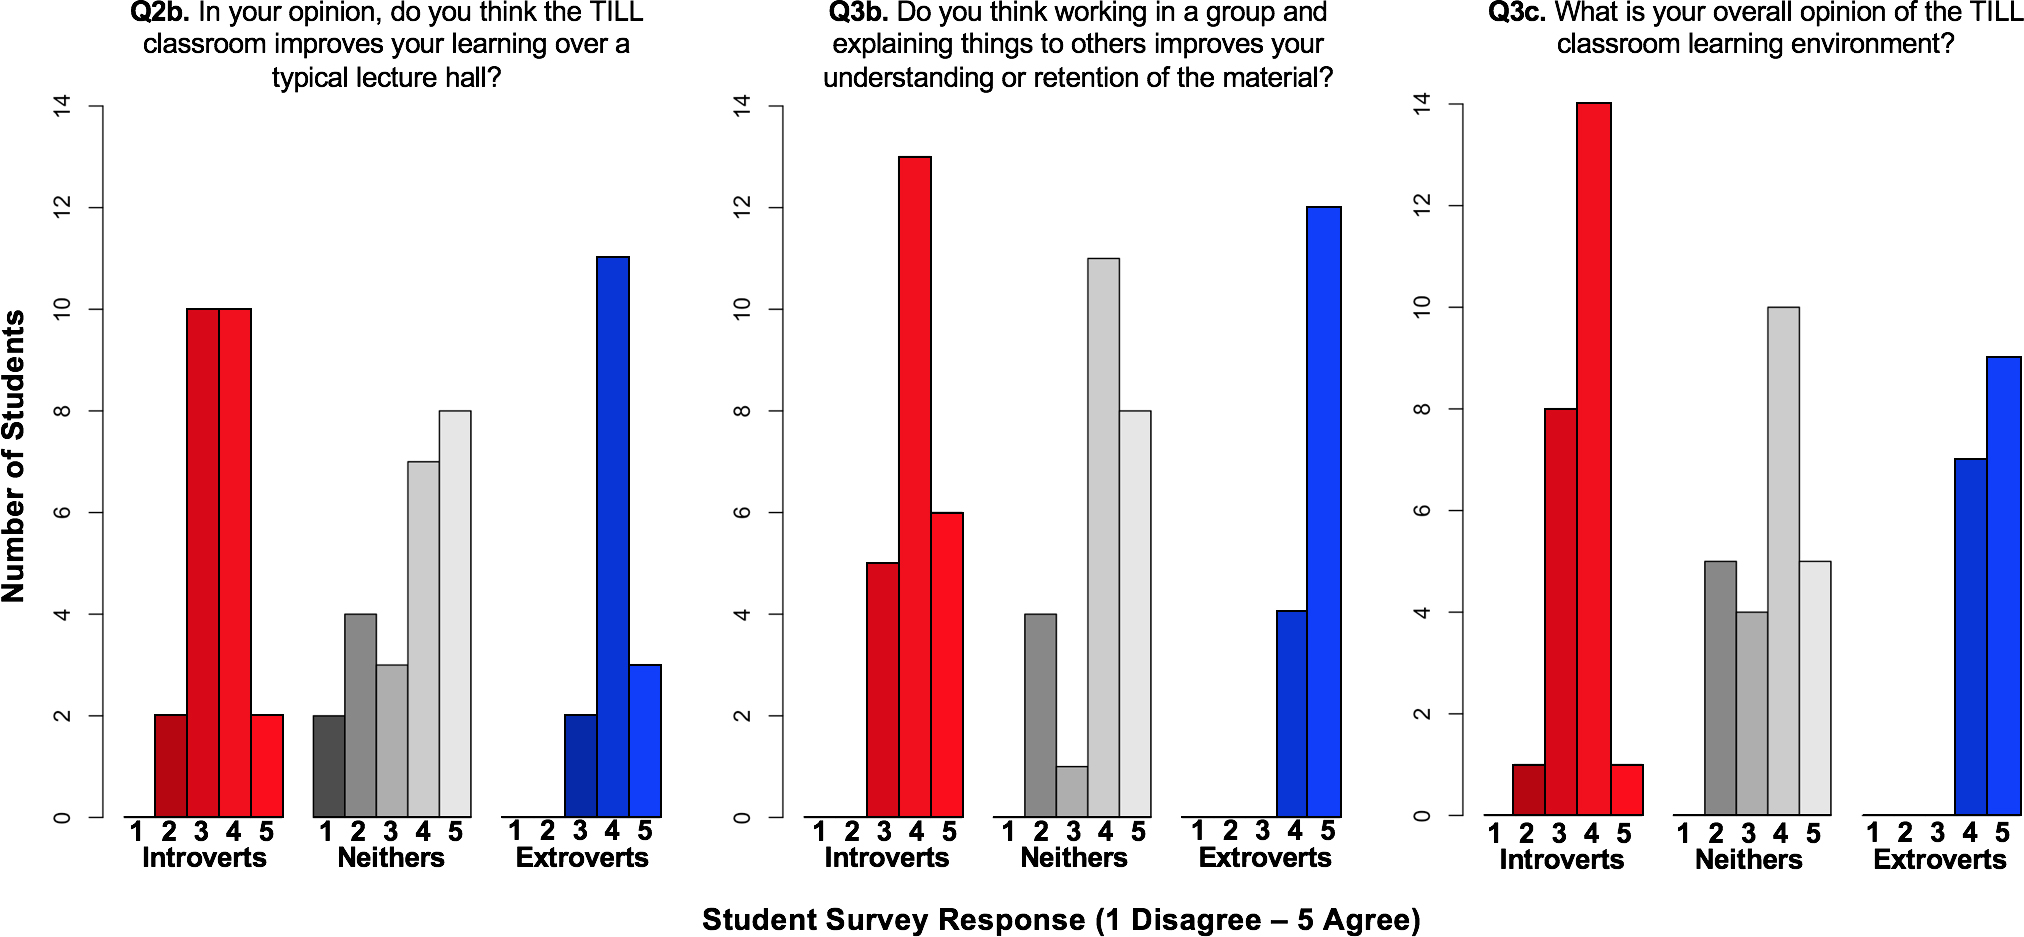
Distribution of responses for student survey questions 2b, 3b, and 3c. The possible responses were; 1 = disagree, 2 = slightly disagree, 3 = neutral, 4 = slightly agree, 5 = agree. The average scores for Q2b, Q3b, and Q3c for each personality grouping were 3.39, 4.09, and 3.59 for introverts, 3.57, 3.91, and 3.61 for neithers, and 4.07, 4.80, and 4.53 for extroverts, respectively. TILL = Teaching Innovation Learning Lab.
Distribution of responses for student survey questions 2b, 3b, and 3c. The possible responses were; 1 = disagree, 2 = slightly disagree, 3 = neutral, 4 = slightly agree, 5 = agree. The average scores for Q2b, Q3b, and Q3c for each personality grouping were 3.39, 4.09, and 3.59 for introverts, 3.57, 3.91, and 3.61 for neithers, and 4.07, 4.80, and 4.53 for extroverts, respectively. TILL = Teaching Innovation Learning Lab.
Discussion
Results from our analysis demonstrate that despite a trend toward improved overall exam scores for individuals who participate in active learning classes, the level of an individual’s extroversion can significantly impact how they perform in active learning environments. These findings are particularly important to consider with regards to the group composition of students by classes and for classes that rely more heavily on active learning for distribution of course material, especially in classes with higher than average ratios of introverted individuals, such as Microbiology.
However, despite our findings that personality can significantly impact learning in the active learning environment, one potential reason for the observed difference between introvert and extrovert performance on active learning–based questions may be due to a dose-dependent reaction to the way the students adjust to new ways of receiving lecture material, that is, active learning environments may improve overall retention of material; however, introverts have a harder time transitioning to the new style of learning than do extroverts, especially in upper level courses where they have become accustomed to lecture-style learning over several years of college.
Furthermore, our findings have unique applications to upper division microbiology students with regard to their eventual career path. Based on the composition of majors in the class, the majority of students who take microbiology do so with intentions of seeking a career in the medical field, jobs where social interactions are abundant, teamwork is important, and the work environment resembles the type of environment one experiences in an active learning setting. Therefore, our findings that introverts perform worse in group environments may indicate that supplementing active learning is even more important in upper level biology classes to prepare individuals for their careers after college.
Although our group was able to find a significant correlation between student performance, personality, and the active learning environment, our sample size is comparatively small. The study should be replicated further before any major suggestions are made for implementing new active learning practices in biology. Although more research is needed, this study demonstrates that the active learning environment is indeed not a one-size-fits-all solution for improving the way all students learn. When utilizing the active learning setting, group composition of personality type within a class should be considered with regard to how an instructor teaches in the classroom.
Note: Author contributions are as follows: WCB, JOA, JDP, and DRY-H designed the experiment. WCB, JDP, and DRY-H implemented the TILL sessions and collected the data. WCB and DRY-H analyzed the data and performed the statistical analyses. WCB, JOA, and DRY-H wrote the manuscript.
William C. Beckerson (william.beckerson@louisville.edu) is a graduate teaching assistant in the Department of Biology, Program on Disease Evolution; Jennifer O. Anderson is a program director in the Delphi Center for Teaching and Learning; John D. Perpich is a postdoctoral associate in the Department of Oral Immunology and Infectious Diseases at the University of Louisville School of Dentistry; and Debbie Yoder-Himes is an assistant professor in the Department of Microbiology and Immunology, all at the University of Louisville in Louisville, Kentucky.