
Student-Constructed Weather Instruments Facilitate Scientific Inquiry
Students in introductory college science courses often have a simplified understanding of the scientific method. To introduce students to the complexity of the scientific process and the value of empirical observations, I implemented a semesterlong assignment that required introductory-level college science students to build and calibrate weather instruments from household materials. Students built their choice of a thermometer, barometer, hygrometer, or an anemometer, with a calibrated scale to record changes. Students then observed weather with their instruments for a period of 5 days and wrote reports on their instruments and observations. I evaluated these reports to determine how well students engaged in the scientific processes, including experimentation with their instruments and analysis of their data. Assessment data suggests this assignment successfully engages students in the process of scientific inquiry and helps them gain research experience as well as a better understanding of what goes into empirical observations. It also has potential to help students build quantitative skills in data analysis and interpretation. The exploratory structure of this assignment could be successfully adapted for use in introductory-level courses in other science disciplines.
Introductory college science courses can offer students opportunities to build a fundamental understanding of basic scientific principles that will serve them in everyday life while experiencing the richness and complexity involved in pursuing science. Numerous studies have shown that student engagement and scientific literacy increases with more opportunities for scientific inquiry, such as hands-on activities and interactive problem solving (Krajcik & Sutherland, 2010; Meers, Egan Demers, & Savarese, 2004; Yang, 2010). Quantitative reasoning skills in data analysis and interpretation also improve with active learning methods and real-world applications (e.g., Marshall & Swan, 2006; McFarland, 2010). Although the use of clickers has broadened and improved opportunities for interaction in large lecture courses (Van Daele, Frijns, & Lievens, 2017), hands-on learning opportunities are still not optimal in all courses (Lawrenz, Huffman, & Appeldoorn, 2005). It is a logistical challenge to incorporate activities in a large classroom or lecture hall setting. These circumstances call for creative approaches that can give students a hands-on learning experience while keeping logistics manageable for faculty (Dean & Wright, 2017).
Many introductory science class students have learned a version of the scientific process that bears little resemblance to what is involved in the pursuit of scientific inquiry (Harwood, 2004; Herreid, 2010). Meteorology lends itself well to offering students opportunities to become engaged in science through observation and experimentation as it offers a natural opportunity for students to apply their understanding to something that they observe and experience on a daily basis. Many students take meteorology courses to satisfy general education requirements. Students have a natural curiosity about the environment and weather, as they have been observing weather their entire lives. Thus, a genuine interest in the environment also drives them to take these types of courses (Samara, 2015).
Meteorology presents its own unique challenges. First, introductory meteorology courses are content heavy, with a lot of new terminology. This makes applying the new material, in the short time span of a semester, a difficult prospect (Kahl, 2008). Also, the highly variable nature of the atmosphere makes it difficult to plan hands-on activities and assignments built around a specific theme or topic that is also related to analysis of daily weather observations.
To address these challenges, I implemented an assignment in my introductory meteorology course that required students to build and calibrate their own weather instruments from simple, household materials. The assignment introduced students to the research process and taught them about the properties of the atmosphere, as well as the process of recording, analyzing, and sharing data in the form of a report. It gave them an opportunity to learn about the nature of scientific observation, and about themselves, as scientists. Project-based assignments such as this have the effect of building self-efficacy (Fencl & Scheel, 2005) and moving students away from simple versions of scientific methodologies they may have learned elsewhere toward a more authentic understanding of the process of scientific inquiry (Harwood, 2004; Understanding Science 101, ). They also have the potential to improve quantitative reasoning skills by having students gather and examine data (Klug, Carey, Richardson, & Gougis, 2017).
Course context
The weather instrument assignment was introduced in a general meteorology course at a large public university (for assignment details, see Appendix 1, available at ). This course satisfies one of the science requirements for the university’s general education curriculum. Students who take the course range from freshman to senior and span a wide range of majors. This course is required for some students majoring in Earth Sciences (this includes students emphasizing meteorology, environmental science, or secondary earth science education), as well as students majoring or minoring in Environmental Studies. All together, these earth and environmental science students comprise about 20% of students enrolled in any given section of this course. There are three 50-minute lectures each week, as well as one 2.5-hour lab session taught by a graduate teaching assistant.
The weather instrument assignment
By the third week of the semester, students have had some introduction to the properties of the atmosphere and meteorological variables that are observed on a daily basis. Students then build a weather instrument, develop a numerical scale for it, calibrate it, compile data, and submit a report consisting of 5 days of weather observations at home. They needed to include a detailed description of their experiences constructing their instruments and their efforts to evaluate the data they collected from their instruments. Whether or not they got their instruments to work, I asked them to document everything they did, so that they could develop an understanding of the importance of keeping detailed records. A timeline of the assignment with specific student tasks is presented in Table 1.
| TABLE 1 | ||||||||||||||||
|---|---|---|---|---|---|---|---|---|---|---|---|---|---|---|---|---|
|
||||||||||||||||
I analyzed student reports using four criteria (Table 2). Specifically, I was looking for evidence that they could engage in the scientific process by designing their instruments and evaluating them through data collection and analysis. I also collected assessment data on the final exam in the form of an essay question designed to test quantitative reasoning. The question required students to evaluate a calibration curve. Student perceptions and attitudes about the assignment were collected from feedback forms on the day they brought their instruments to lab and from end-of-semester evaluation and course feedback forms.
| TABLE 2 | |||||
|---|---|---|---|---|---|
|
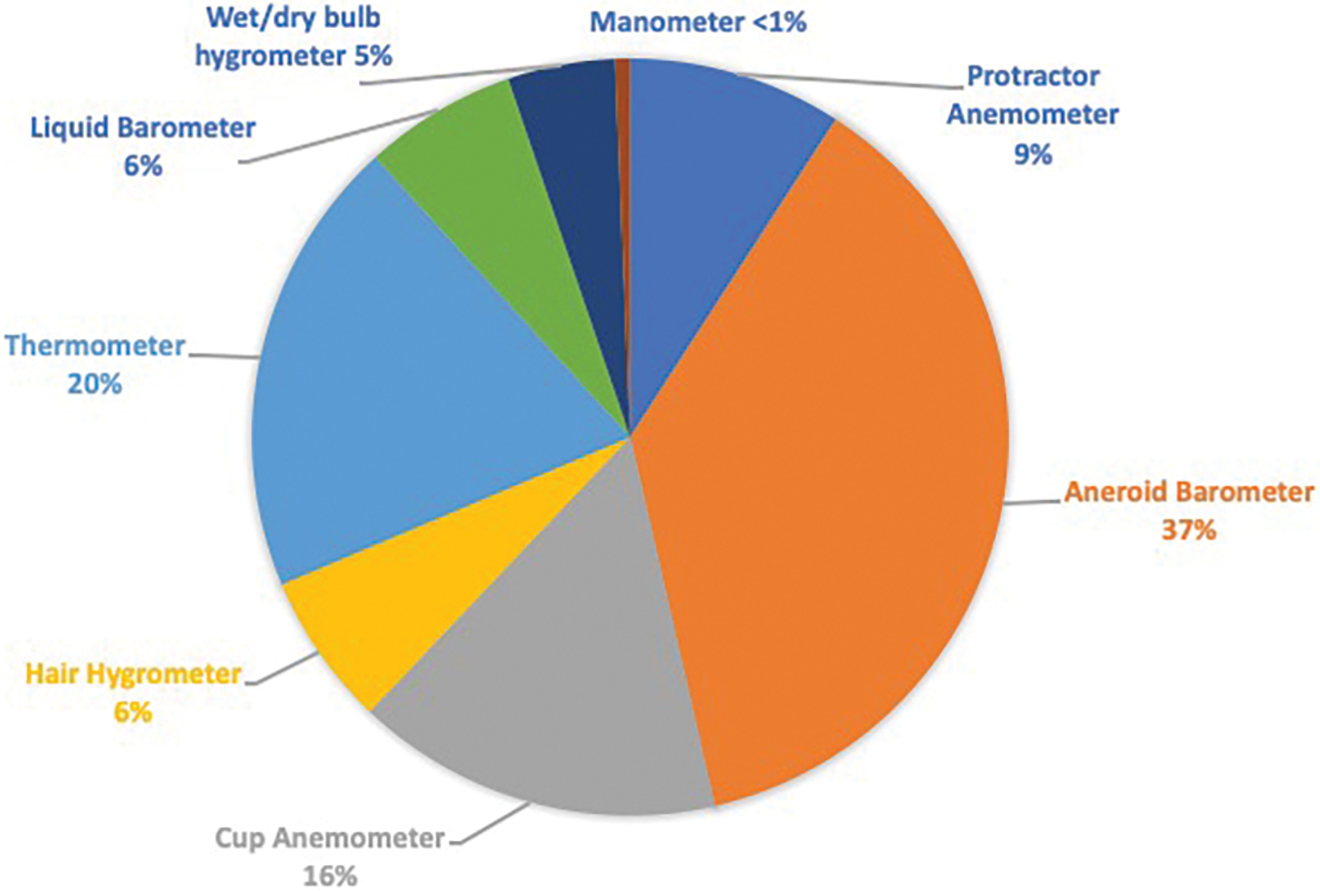
Student reports needed to provide a brief summary of the historical development of the chosen instrument and a description of the basic physical principles governing its operation. I provided them with suggestions for websites that included instructions on how to build meteorological instruments from household materials. Most websites with instructions for homemade weather instruments are written for elementary and secondary school students and teachers. The fact that students must create a numerical scale for the instrument before they make weather observations, as well as verify the data they collect and evaluate the consistency of their instrument, adds a level of complexity. Throughout a 5-day observing period, students evaluated the performance of their instruments with verifications using local weather observations online or another instrument. Over three semesters, 153 students completed this assignment: 46 in spring 2012, 49 in fall 2012, and 58 in fall 2013. Lectures, assignments, and exams varied minimally from one course offering to the next. The percentage of students that constructed each type of instrument is illustrated in Figure 1.
Percentages of students who constructed each type of weather instrument (n = 153).
Percentages of students who constructed each type of weather instrument (n = 153).
In addition to the observations with their constructed instrument, students kept a record of cloud types, percentage of sky cover, and perceptions of other weather variables (temperature, relative humidity, wind speed and direction, based on skin sensations). As they did with their constructed instruments, students were required to verify the accuracy of their perceptions using another instrument or using data available from the campus weather station or National Weather Service online. The goal of this activity was to give them an idea of how their perceptions of temperature, relative humidity, or wind speed informed their personal estimates, and how those differed from empirical observations. This aspect of the assignment provided a unique opportunity to discuss the importance of empirical measurements.
Construction and evaluation of their weather instruments not only gave students the experience of collecting, analyzing, and interpreting data, but also introduced them to the element of trial and error inherent in most experimental designs. In the 10th week of the semester, students brought their weather instruments to their lab session and worked in groups with others who built similar instruments (see Figure 2 for examples). They discussed optimal instrument design and observing techniques and whether their instruments needed any significant revisions. I also prompted them to apply some of the basic principles of physical meteorology that we had covered in lecture to an interpretation of the weather that they had observed with their instruments. After the lab, students made improvements to their instruments, recalibrated them, and used them to make another 5 days of weather observations.
Sample instruments constructed by students for the assignment: (A) aneroid barometer built by stretching a balloon over the mouth of a mason jar, (B) wet-bulb hygrometer constructed from a cup of water and two thermometers, and (C) cup (spinning) anemomet
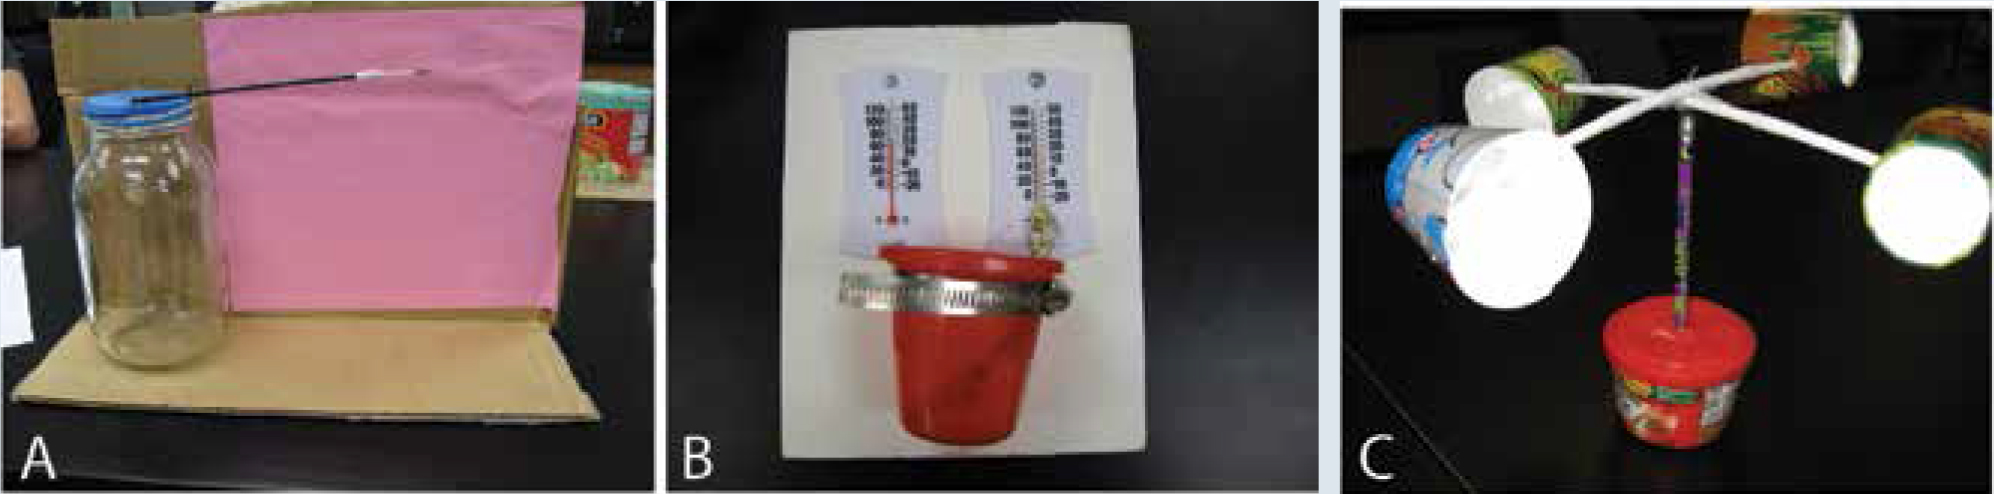
Sample instruments constructed by students for the assignment: (A) aneroid barometer built by stretching a balloon over the mouth of a mason jar, (B) wet-bulb hygrometer constructed from a cup of water and two thermometers, and (C) cup (spinning) anemometer constructed from Dixie cups and straws.
Students’ grades were always a concern as they often worried about instrument failure. In this assignment, I weighted the grade on how thorough they were in attempting to build the instrument and test it, as well as how well they documented what they did. I made it clear to them that their grade did not depend on whether their instruments were fully functional and accurate, but on their efforts to understand why they were not.
Outcomes and impact
The first criterion in Table 2 addresses student understanding of the fundamental operating principle of their instrument. Nearly all students who completed the assignment could provide a general description of how their instrument worked, and nearly all built an instrument that was at least able to respond to changes in weather.
The second criterion addresses whether students have learned to calibrate their observation through trial and error and comparison with another instrument. Development of a scale for their instrument and comparison with another instrument gave students an opportunity to learn about the value of the empirical method. Depending on the type of instrument that a student constructed, designing and testing of a scale could be quite difficult. About 70% of students used observations of instrument behavior to create a scale that was based on observed changes compared with those of another instrument. The remaining students attempted to build scales that were arbitrary and did not compare with any other data sources.
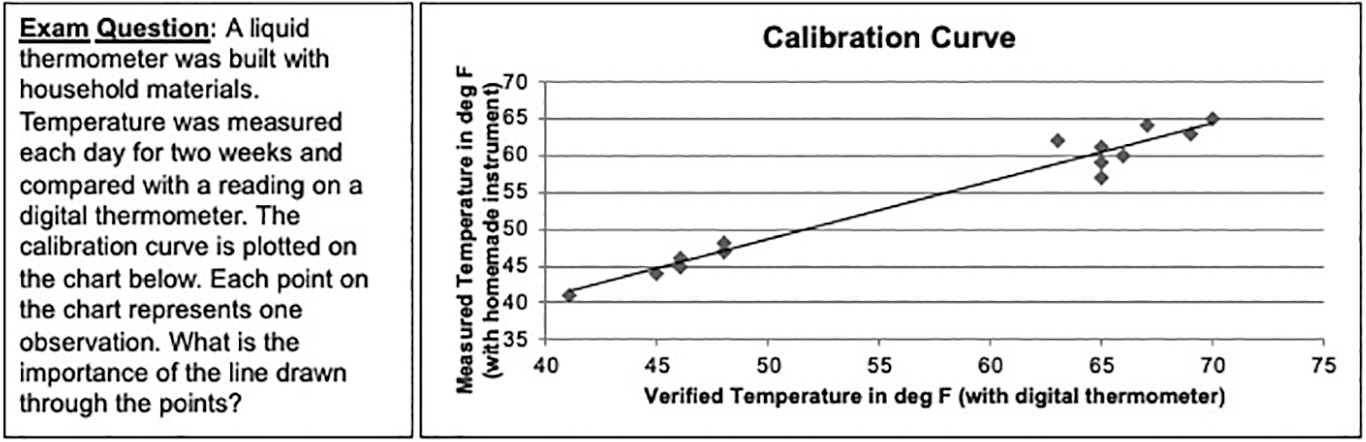
Constructing a calibration curve (third criterion in Table 2) allowed students to determine if their instrument was precise, if not always accurate, in comparison with another instrument. For many students, this was the most difficult part of the assignment. Students were asked to plot their own observation against a verification from another instrument or a weather observation reported online (as depicted in Figure 3). Despite very explicit instructions, many students created two separate plots: one with their observations and another with their verifications. Only 25.4% of all students constructed the calibration curve correctly, according to directions, despite multiple opportunities to learn how in class or lab. About 30% of students constructed another type of graph that compared their observation with the verification, which allowed them to examine accuracy, if not consistency, and 44.6% of students simply did not do this part of the assignment. Nevertheless, it was clear to many of the students who made plots (and even to some who didn’t) that their instruments had trouble responding consistently. This is to be expected in this assignment and, in fact, provided a great opportunity for discussion and reflection in class. Ultimately, discussions like this contribute to the development of quantitative reasoning. In subsequent course offerings, I have been able to increase the number of students who complete the calibration curve by walking them through the process of evaluating their data multiple times, and by providing examples in class and in lab session.
An exam question and graph that were given to students on the final exam at the end of the semester to assess whether students could interpret a calibration curve.
An exam question and graph that were given to students on the final exam at the end of the semester to assess whether students could interpret a calibration curve.
The fourth criterion addressed whether students were able to identify problems and actively work to improve their instruments (or at least whether they recommended improvements). A majority of students cited problems with their instrument design as the source of difference between their own observation and their verification. Their explanations included the use of flimsy materials, as well as the fact that, in the case of building barometers and thermometers, the instruments were likely responding to changes in both temperature and pressure. A majority of students (65%) made changes to their instruments either prior to or during their 5-day observation period. (Not all of them sought to recalibrate after making adjustments. Some did not make adjustments as they either didn’t know what to do or didn’t feel that they needed adjustments.)
Evaluating a calibration curve on an exam
Figure 3 depicts a question I asked students on the final exam as part of the assessment for this project, and Figure 4 shows the most common types of responses to that question. Some students gave multiple interpretations for the graph, particularly if they were unsure. In summarizing responses, each of those multiple responses is counted as an individual response. Despite the fact that so many students did not plot a calibration curve with their data, approximately 60% of all responses from students expressed the idea that the curve had something to do with accuracy or correlation or was a line of best fit (which is true but doesn’t address significance). This suggests that they were able to interpret an analysis, even if they were unable to complete the analysis themselves. About 15% of all responses indicated that the curve was a “trend line” but did not provide additional information, and about 33% of students responded with the misconception that the curve represented an “average” of the observations.
Various types of responses given by students in their interpretation of the calibration curve, and the frequency of those responses expressed as percent of total number of explanations provided for the chart.
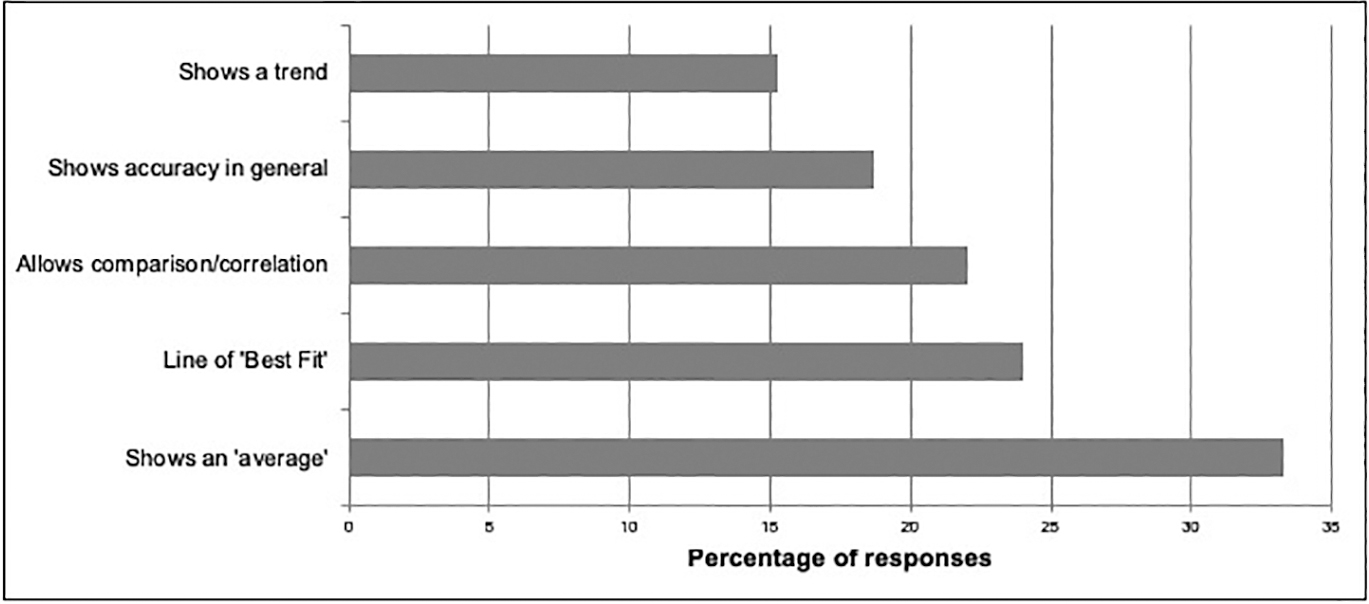
Various types of responses given by students in their interpretation of the calibration curve, and the frequency of those responses expressed as percent of total number of explanations provided for the chart.
Student perception of the assignment overall
Some students were initially a bit put off that they would be required to complete a project that is usually directed toward younger students, but they quickly discovered that constructing an instrument and getting it to work consistently and accurately was not an easy task. Students also commented that their perceptions of weather (estimates of temperature, etc., based on skin sensations) almost never matched with the empirical observations. From a survey administered at the end of the semester, 93% of students stated that they felt they had learned something from the assignment. About 30% of all students mentioned that they had learned a specific skill, technique, or process, and about 15% of students mentioned that the assignment helped them understand some aspect of the science of meteorology.
Some examples of comments include: “I felt like a real scientist. It allowed me to see what ‘research’ might be like.” “I learned that designing instruments is tricky business but that the concepts were surprisingly straightforward.” “Overall I found this project enlightening and fun. I will probably try to do something a little simpler with my own class once I am teaching in an elementary school.”
Conclusions
This assignment required students to plan and conduct investigations, analyze and interpret data, use basic math to analyze their observations, and develop explanations for what they saw. Overall, it was successful in engaging most students in empirical observation and hands-on problem-solving with their instruments. It also helped them become familiar with the role of uncertainty in scientific explorations. The structure of this assignment required students to give each other feedback on their instrumental design and observational protocol, to make scientific observations, and to submit a report. This could be easily adopted in other introductory college science courses.
A few students in each class said that they felt hopeless in getting things to work correctly. For this reason, it is important to support students with opportunities to share their experiences in the process of scientific discovery. Remind students that they are pursuing research, and that they are learning about the scientific process. It also helps to break the project into pieces and have checkpoints along the way. Including discussions about how each particular stage of the project mimics the scientific process (including fixing errors, reporting, and peer review)seems to help ease frustration and helps students be more patient with the process. Students are never comfortable with ambiguity, and there needs to be discussion about this and about how documenting everything they do, even if it doesn’t work, can help them learn. Finally, introductory science students need direction and practice reading graphs. This is where an assignment like this has the largest potential to help students build their quantitative skills in data analysis and interpretation. These are all things that help them become lifelong learners, whether or not they become scientists.
Cindy Shellito (Lucinda.Shellito@unco.edu) is a professor of meteorology in the Department of Earth and Atmospheric Sciences at the University of Northern Colorado.