A Lesson in Geospatial Inquiry
A Lesson in Geospatial Inquiry
Geospatial Inquiry is an educational framework that offers students an opportunity to engage with, and become curious about, geospatial data for a defined purpose. We define Geospatial Inquiry as: “Asking and answering a question through the analysis and communication of data that is linked to a geographic location on, above, or near Earth.” (Rubino-Hare et al. 2017).
When we use the term geospatial, we are referring to an awareness of one’s surroundings on Earth as viewed through the lens of various data, maps, and social interactions (Rubino-Hare et al. 2017). Through Geospatial Inquiry, students gain exposure to practices that bring their personal experiences into a classroom environment where they can learn about geospatial analysis, 21st century workforce skills, geospatial technology capabilities, and science, technology, engineering, and mathematics (STEM) career awareness.
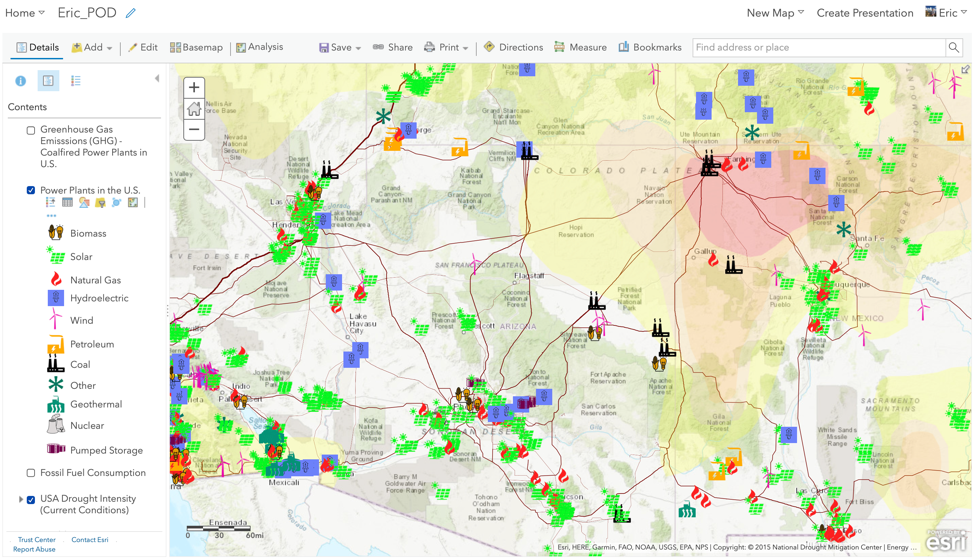
Since Geospatial Inquiry is designed to evoke curiosity and engagement, students have multiple opportunities to seek information and explore ideas on how they see the world they live in. Geospatial Inquiry uses technology and data combined with inquiry-based teaching methods to enhance student learning (Claesgens et al., 2013). These data are often represented visually using maps. In Figure 1, we show the process of geospatial inquiry. The six attributes of the Geospatial Inquiry process are:
- Examine data
- Ask questions
- Acquire additional data
- Analyze and interpret data
- Argue from evidence
- Revise arguments.
These do not have to be followed in a step-by-step process; rather, they may be iterative and cyclical, returned to or skipped, depending on the investigation.
Geospatial Inquiry helps students formulate and structure their interpretations of geospatial data into claims and arguments based on observation, critical thinking, and reflection. Not only are students given opportunities to express their understanding of data in interesting and creative ways, but they also become familiar with the nature of processing and visualizing datasets. For guiding principles that will help create a lesson plan on Geospatial Inquiry, please refer to Figure 2.
Using Geospatial Inquiry within an Environmental Science Unit
To help provide an example of how to use Geospatial Inquiry, we have designed a climate change unit that you can use or modify to fit a more appropriate focus area. The guiding question of the unit is: What is our local impact on global climate change? This unit incorporates two Next Generation Science Standards (NGSS) under Earth’s Systems and Earth and Human Activity (see NGSS box, page XX).
Products for this unit include an outline and a presentation. The presentation should include maps that provide a visualization for the data used. The purpose of the presentation is to help students learn to communicate an argument with data. These products provide students diverse opportunities to engage through writing, discussion, and an oral presentation. The purpose of the outline is to help students structure their presentations with clarity and bring their ideas back to the overarching question. Using outlines may require scaffolding by the instructor to help ensure that students construct their outlines and presentations in an organized fashion to better communicate their findings. This lesson can be conducted for an 11th- or 12th-grade classroom over seven to eight days of 60-minute periods.
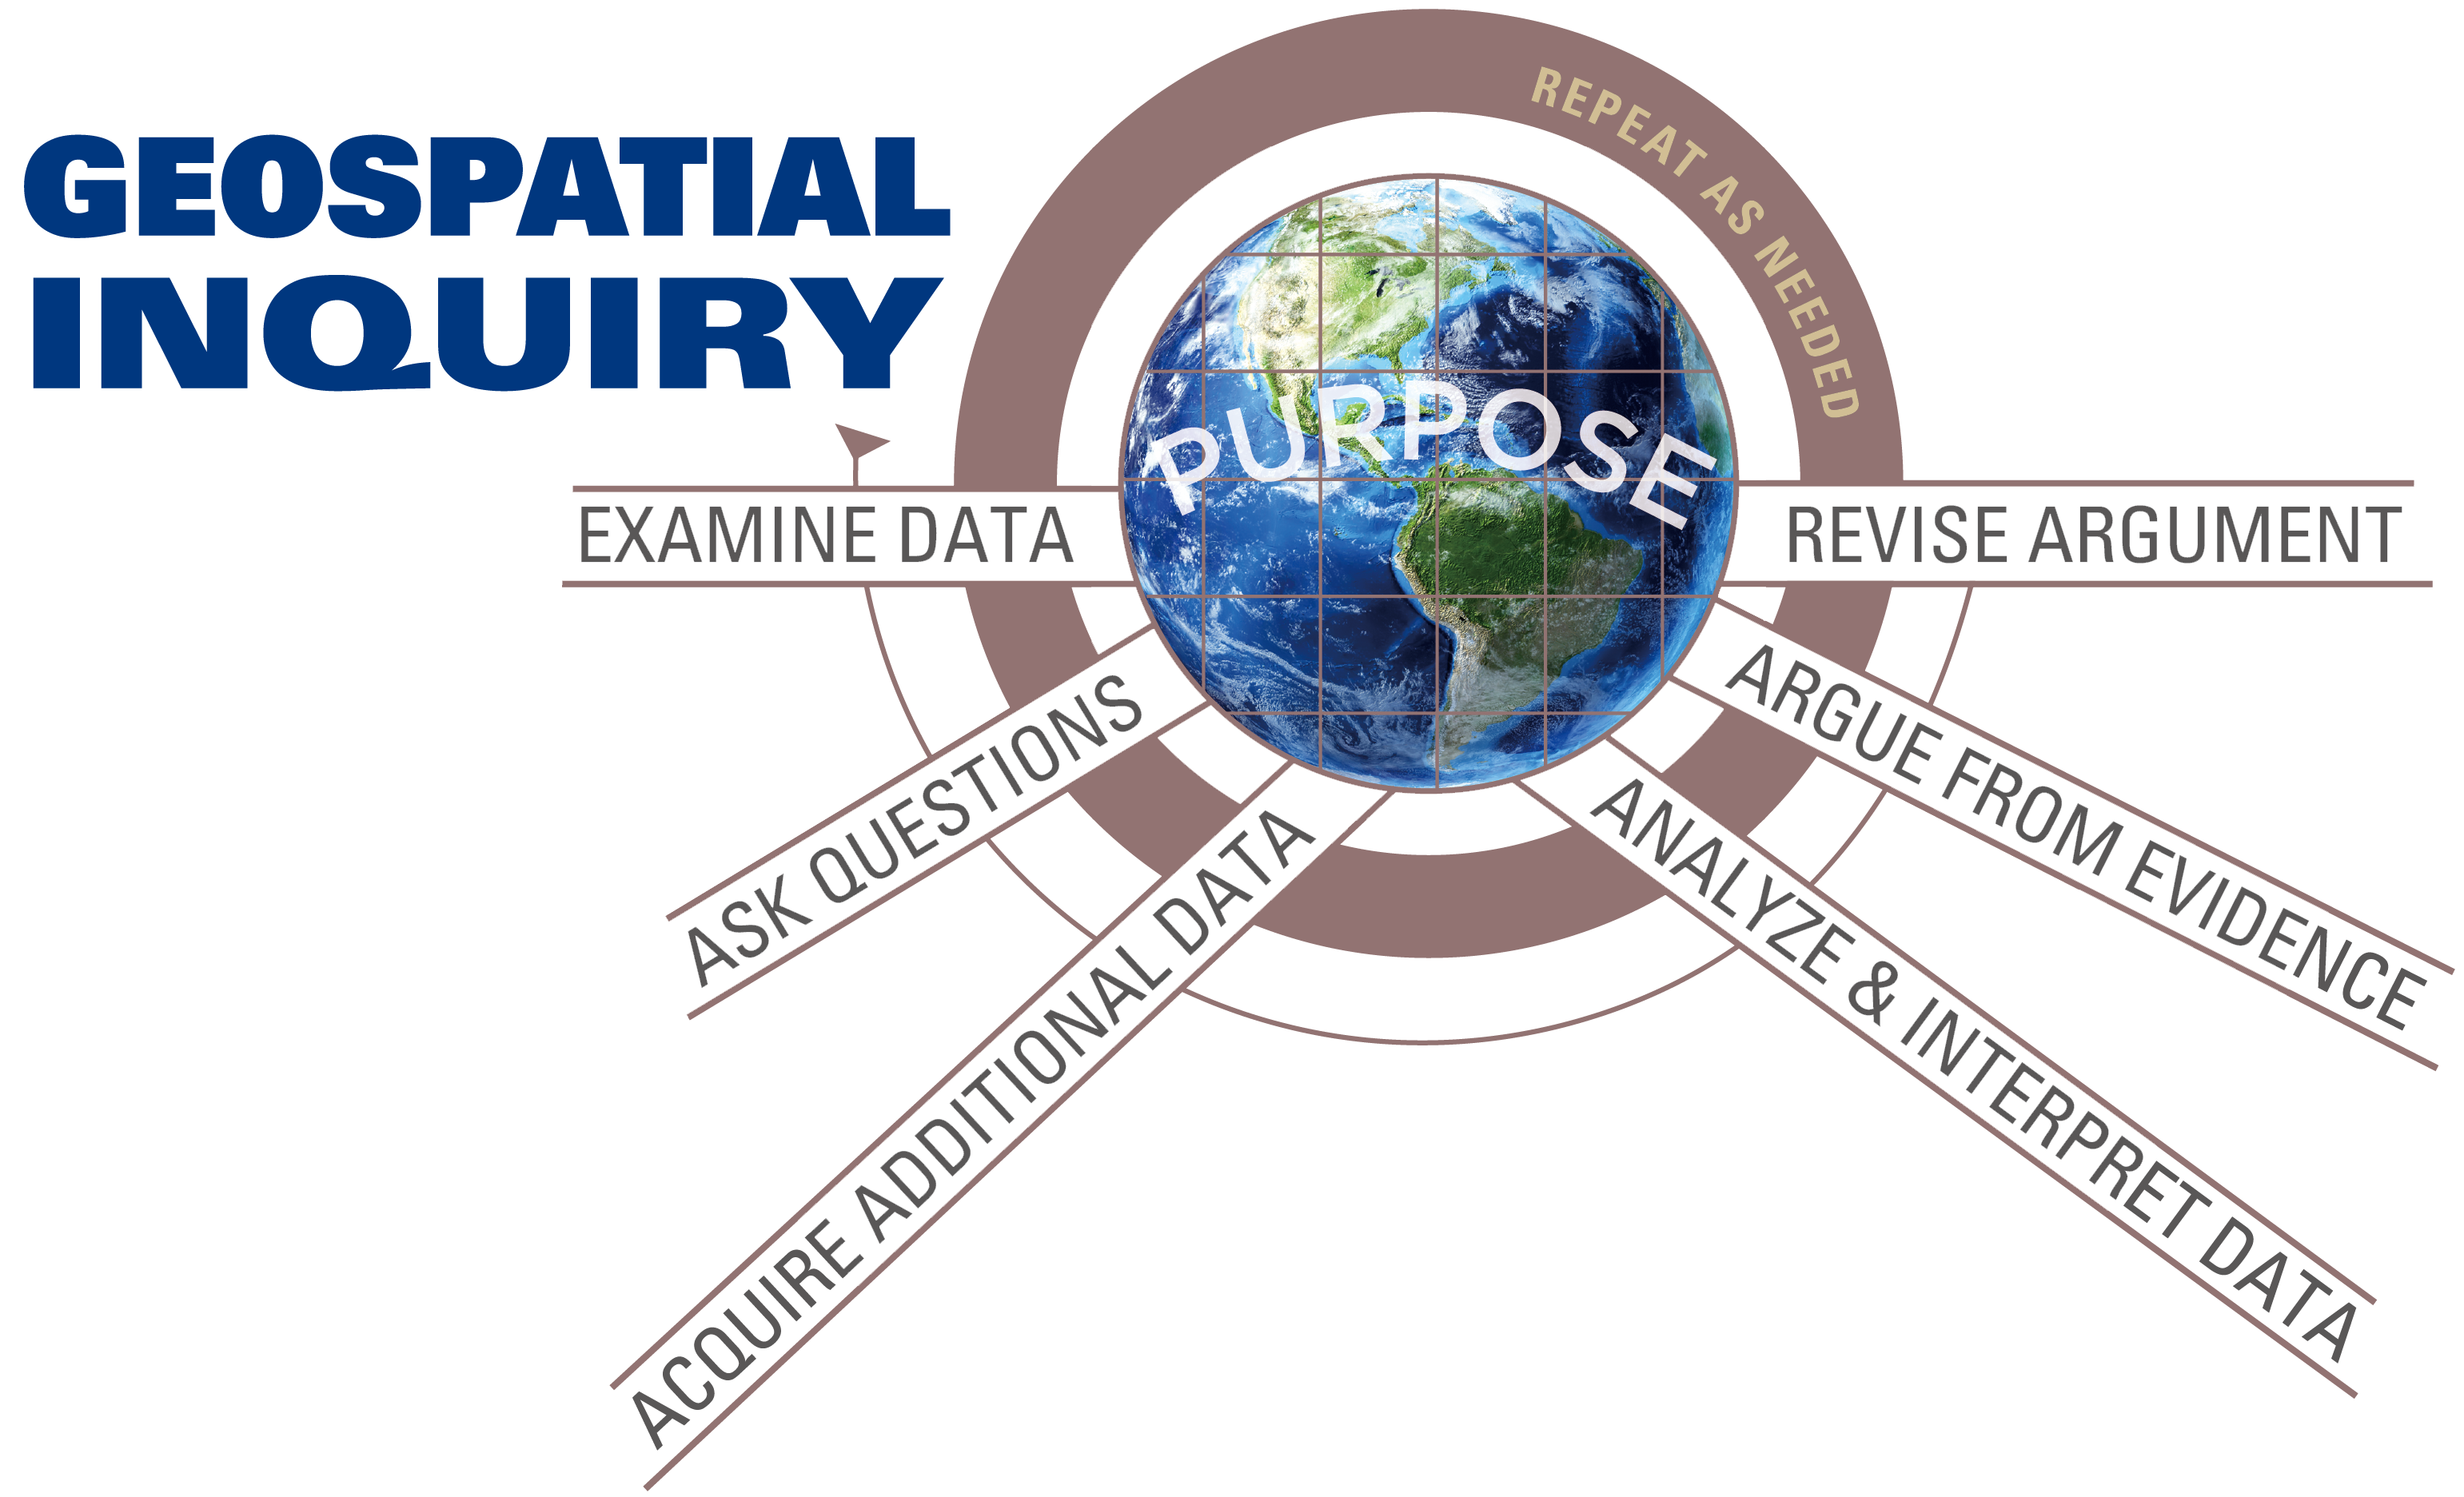
For our unit, we used ESRI’s ArcGIS Online software (see “On the web”), which offers a variety of features for map-building that encourages interaction and overlaying of different datasets (Figure 3). ESRI offers basemaps that show satellite imagery, land and ocean topography, and street views. We used their topographic basemap as the main map style, and selected the Colorado Plateau and Grand Canyon so students have a context of place. Since we are based in Flagstaff, Arizona, we looked at our region of the world as being situated in the high deserts of the Colorado Plateau surrounded by forestland.
ESRI also offers layers, which are company- and user-uploaded data files representing data geospatially on a map. Examples of the many different types of layers include USA Road Density, World Bioclimates, and USA Surface Water. If resources are available, we recommend using ESRI’s ArcGIS Online; if resources are limited, we suggest using Google Earth Pro for Windows or Mac, which is free and offers similar data types. Throughout the course of the unit, it would help to arrange for computers with internet access so students can familiarize themselves with geospatial technology and web-based searches.
When utilizing the internet for classroom use, it is important to make sure that students only open web browsers for the purposes of the unit and do not to engage with social media or other distractions that can take away from the lesson. Also, internet safety use can include (but are not limited to) the following: not sharing login information, keeping passwords private (except from parents), use of appropriate language, and for teachers and administrators to initiate parental controls when and where appropriate.