
Teaching Teachers
The Downstream Collaborative Project
A school-university partnership inspires collaboration through a meaningful watershed educational experience
Science and Children—April/May 2020 (Volume 57, Issue 8)
By William McConnell, Maury Howard, and Katie Catania
“I worked with a real chemist!” was one of many exclamations heard as over 100 fourth graders visited a nearby university. The field trip was a small part of a school-university partnership that continues annually in an effort to provide authentic, field-based experiences focused on environmental education, specifically meaningful watershed educational experiences (MWEEs), to both elementary and university students.
The program, aptly named the Downstream Collaborative Project, combined several interdisciplinary lessons tied to the health of the Chesapeake Bay Watershed and took place inside and outside both institutions. For the purposes of this article, we focus on learning experiences involving water quality monitoring, which provided a means for authentic science practices, data to share and analyze, and a consistent, connective thread between institutions. Although the lesson addressed Virginia Standards of Learning (VASOL) for science in the fourth grade, (SOL 4.5f: The student will investigate and understand the influences of human activity on ecosystems), this activity is also aligned with several fifth-grade NGSS elements (see Connecting to the NGSS).
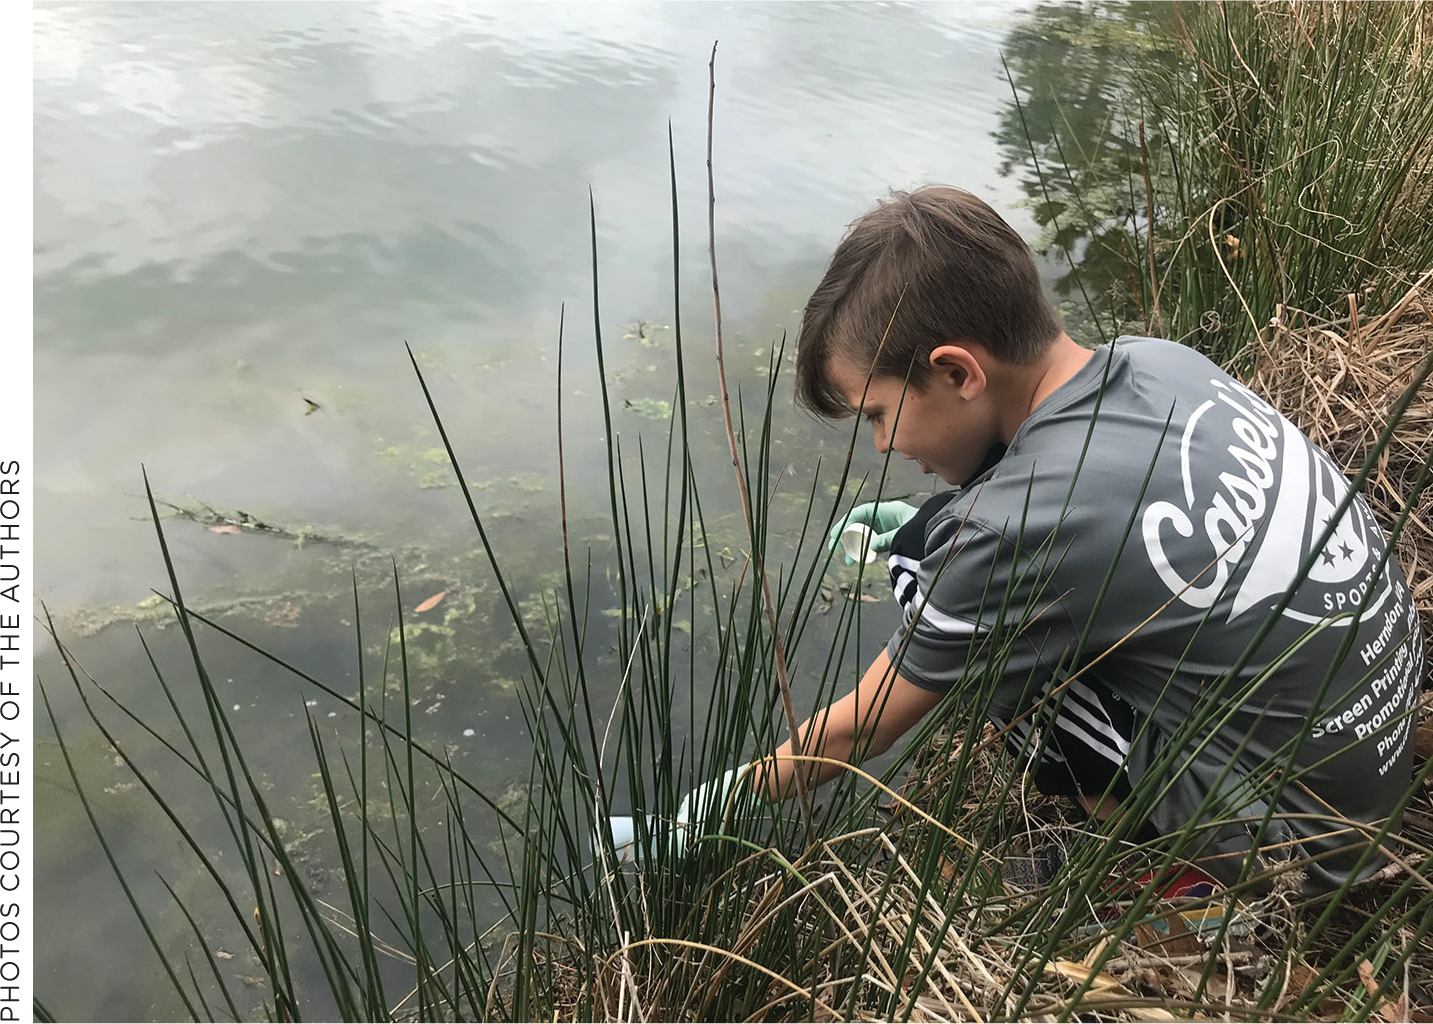
A student collects a water sample (chaperone out of frame!).
To develop activities for the project, we used the Environmental Literacy Model (ELM) Planning Document developed by The Chesapeake Bay Foundation (2017). The ELM includes three main elements: Curriculum Anchor, Issue Investigation, and Stewardship and Civic Action. Thus, this article is organized using these major components.
Curriculum Anchor
A unique aspect of this project is its context. Heimlich and Ardoin (2008) note that when people of any age develop a better understanding or a greater sense of place, they often exhibit more positive environmental behavior. Our project aligned to the 2014 Chesapeake Bay Agreement, which states: “Enable every student in the region to graduate with the knowledge and skills to act responsibly to protect and restore their local watershed” (Chesapeake Bay Program 2014, p. 13). While both the participating university and school are within the same city, they are miles apart and are located near different bodies of water. Still, each of these bodies of water and the land surrounding them are a part of the Chesapeake Bay Watershed. Thus, we hoped that the understanding of our connected watershed would provide students a better understanding and sense of place within their larger community. We drew from our knowledge of the notorious water quality issues within the Chesapeake Bay Watershed to develop an overall driving question for the project: How do our choices and behaviors impact the health of the Chesapeake Bay? From this overarching question, university and school faculty met to discuss the plan and predict questions students may ask after careful observation of targeted areas in their local contexts.
Issue Investigation
University students initiated the collaboration with a video they developed and posted on a shared blog. For the first iteration of this collaboration, we used wix.com to create a blog. Since then, we have utilized Flipgrid.com. Both platforms worked well for our purposes, but students seemed to like the ease of posting videos to Flipgrid better. In the introductory video, university students posed the aforementioned driving question to students. This initiated background research regarding the Chesapeake Bay Watershed. At both institutions, teachers and professors facilitated general observation of the local environment. Students used science notebooks to draw pictures and take bulleted notes of targeted areas. After silent observation, we asked students to discuss their observations with a partner before we traveled back into the classroom to debrief and generate questions from our observations based on the driving question. With this targeted observation, students generated, seemingly organically, a question we predicted for this lesson: Why is there so much algae in (university storm water ponds /Crab Creek near our elementary school)?
On the same platform on which the introductory video was posted, both university and elementary students posted pictures and their observations, spurring pertinent discussion of this question, which prompted a secondary brief session of background research regarding algae. Teachers developed a simple web quest with links to help students investigate the Environmental Protection Agency website (Figure 1; see Internet Resources). Among other things, this investigation helped students understand which nutrients commonly become problematic in our waterways and from where excess nutrients originate.
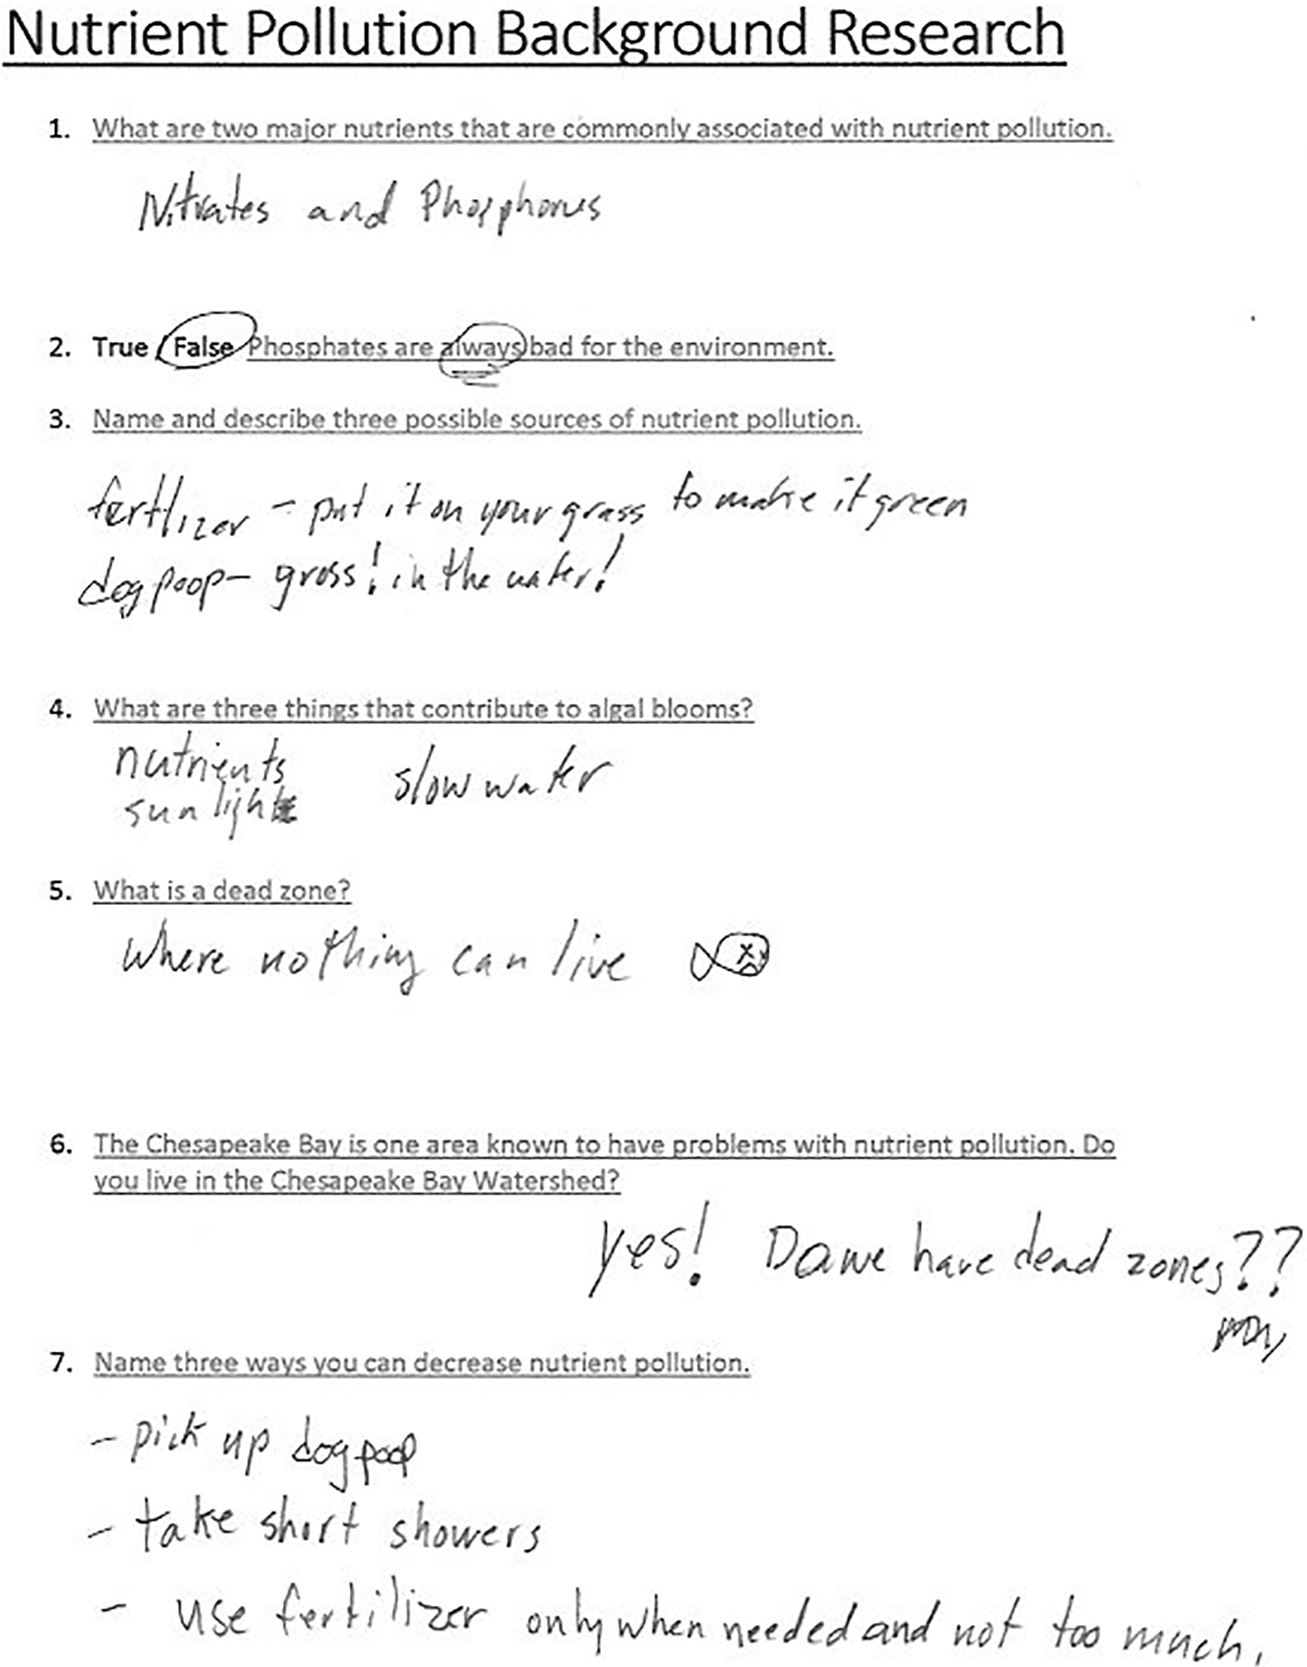
Web quest.
Because we knew comprehension may be difficult for some of the students, we had students pair up to complete a “Word Hunt,” or scan the site for difficult or unknown words. This strategy is helpful for building vocabulary and reading strategies. Students wrote difficult words in their science notebooks and tried to find meaning in context. We then discussed the words and assisted with meaning when needed. For students with difficulty reading in general, there is a video on this site from which they can gather most of the information on the guide sheet. Another strategy we used to assist struggling readers was to have students take part in paired reading of the information on the site. As you can see from question number 6, this background investigation led students to understand there may be too many nutrients in their local waters. This set the stage for the university field trip.
As the fourth graders arrived on campus, they were excited to see much of what was shared on the blog. First, we led students out to observe and sketch one of the four storm water ponds pictured and discussed on the blog (Figure 2). It was easy for fourth graders to notice the great prevalence of algae in the ponds, but we soon realized that they tended to overlook factors that may cause algae overgrowth—sometimes even ignoring their own background research. To mitigate this oversight, we asked probing and prompting questions and encouraged students to return to their science notebooks to scan their background research. “Is what surrounds the pond important to observe?” “Do you notice any differences in the amount of direct sunlight each pond receives?” With this simple guidance, students quickly noted, some from memory and some from their science notebooks, that the pond with the most algae was receiving the most direct sunlight due to its placement away from the shade of the building. Many began to make other connections to their background research at that time. After about five minutes of observation and discussion, we asked students how scientists could find out if there are too many nutrients in the water. It did not take long before a student mentioned that we could test the water. It was at this time that we took the students to the supplies to discuss how scientists safely test for nutrients in the water.
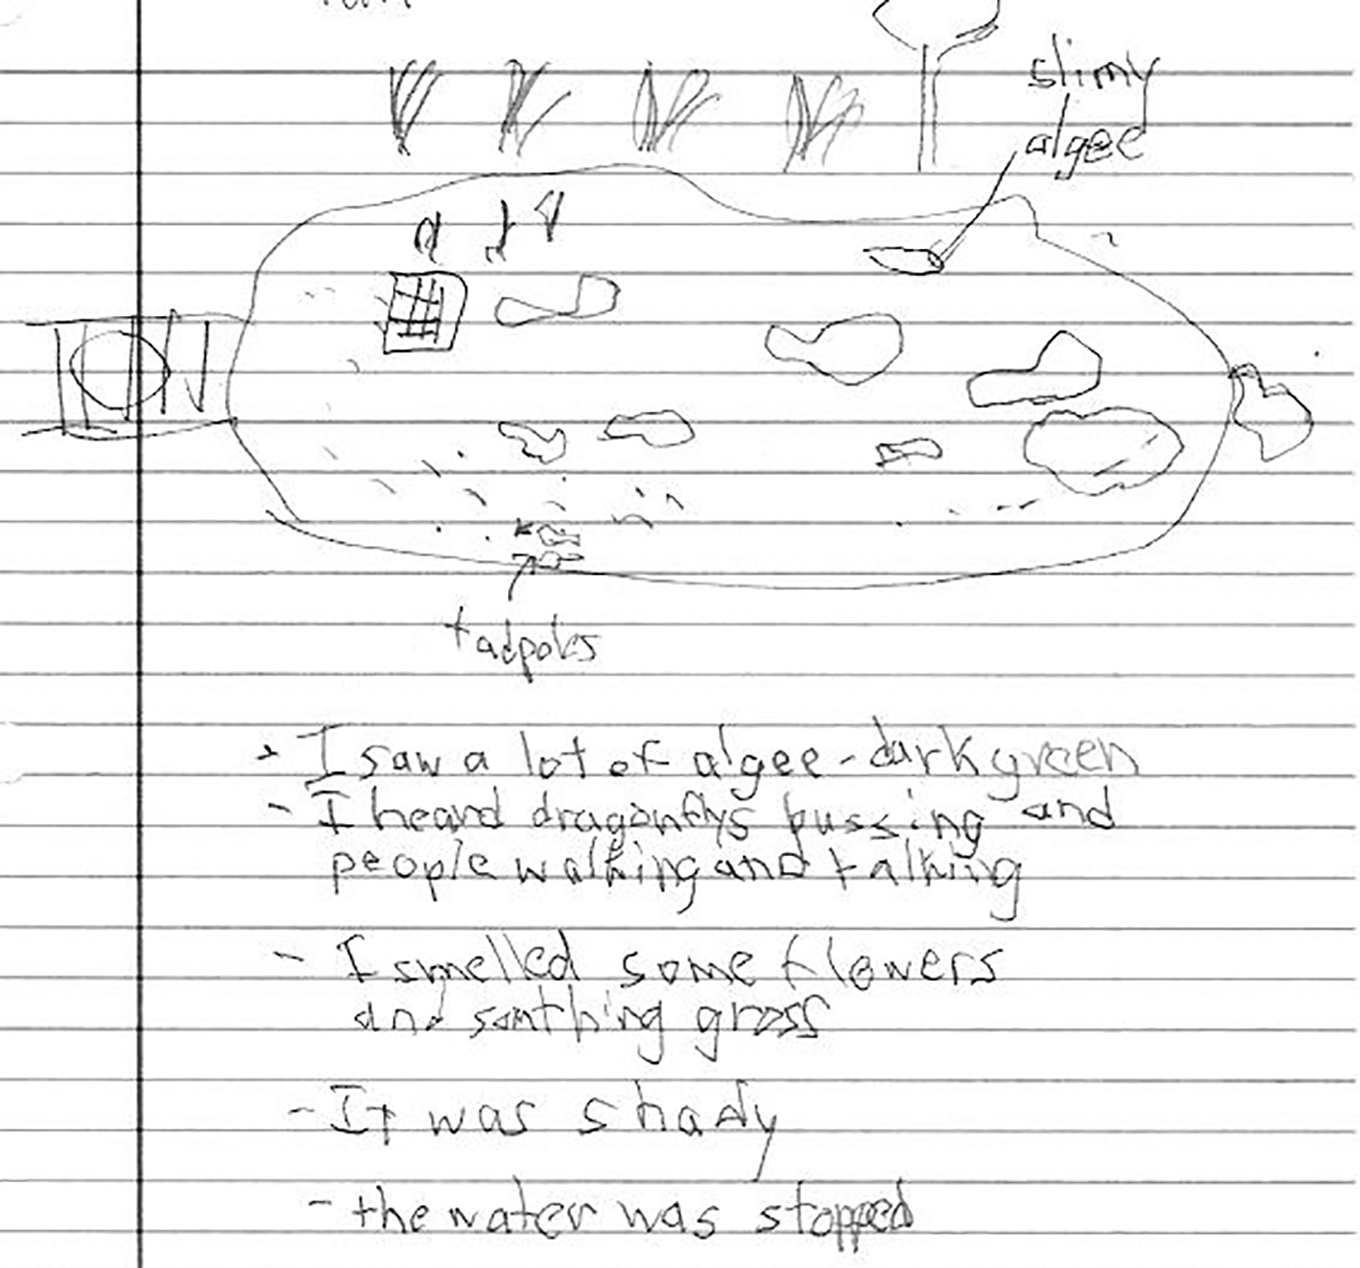
Pond sketch.
Preparation of sampling and testing supplies
It is incredibly important to prepare well ahead of time for this lesson as there are some important safety considerations included in the setup. We employed API nitrate and phosphate test kits from Mars Fishcare for nutrient testing. These kits have thorough directions and safety precautions that any teacher should read in entirety before beginning this lesson. This specific test kit is particularly well-suited for this project because it is not only readily available, affordable, and easy to use, but it also avoids some of the more toxic reagents found in other, similar test kits. However, the kits use acids, so goggles, gloves, and the ready availability of water and baking soda (sodium bicarbonate) to quickly neutralize spills is needed. We also had a sink in the room with soap nearby for hand washing. All students washed their hands after the investigation. During our project an adult was also stationed at each small group to provide assistance and make sure students were working safely.
Having clean sampling bottles helps to ensure the tests work properly. We cleaned sampling bottles with nonionic detergent which contains no phosphates, nitrates, or ammonia and then rinsed them well. We also placed beakers and/or bottles for waste disposal on each table so that students could dispose of their reacted water samples after testing. Although we believe these kits provide valuable practice in colorimetric water quality testing, if available, Vernier Probeware can provide an alternative means for testing for nutrients.
Sample collection
As soon as students arrived at this station, they were sent in small groups (of four or fewer) to collect water samples from each of four stormwater ponds surrounding on campus. We designated one as the sampler, another the equipment manager, and one the scribe (additional members were safety officers and assisted the sampler as needed to prevent him/her from falling into the pond). The sampler carefully collected a surface sample by holding the bottle sideways and dipping the bottle into the pond so the water flowed into the mouth without stirring up sediment from the bottom of the pond and avoiding the collection of insects, plants, or other organisms in the bottle with the water. Once collected, the equipment manager gave the cap to the sampler who sealed it tightly onto the bottle. The scribe wrote the pond number on the bottle and gave it to the equipment manager to take back for analysis. Throughout this process, we took the opportunity to discuss with students the importance of careful sampling when conducting a test like this.
Sample testing for nutrients
As we entered the testing area, we had all students, teachers, and volunteers put on clean gloves and goggles before they were seated at the testing tables. Each student had one partner with whom to complete the water quality tests. When seated at the testing tables, we had students predict and write in their science notebooks which ponds they thought would have the highest levels of nutrients, based on their observations, and we then tallied the predictions and wrote them on the board, along with supporting observations.
The testing process is clearly provided in the directions of the testing kit, and the lead teacher had completed several preliminary tests in preparation for the lesson. It is important that the lead teacher practice the tests several times before the lesson. During the lesson, the lead teacher demonstrated the process for each test as it was executed by the students. Also, the adult volunteer at each table assisted the two student pairs at their table to ensure the process was completed correctly and safely. Each test requires time for the reaction to take place and for the color to stabilize; thus, a timer was an important tool. For this age child, it was also important to explain the difference of shaking the vials and inverting the vials as needed for this test. Again, demonstration worked well for this.
As each timer sounds, student pairs used the test kit color chart to compare the color of their pond water test solutions to the appropriate test chart to find the best color match (Figure 3). We stressed that a color change (pink/red for nitrate and blue for phosphate) indicated the presence of the nutrient, and that the more intense the color, the more was present. No matter what, most students were enamored with the results. They took time to examine the test card color chart to see how the color changes.
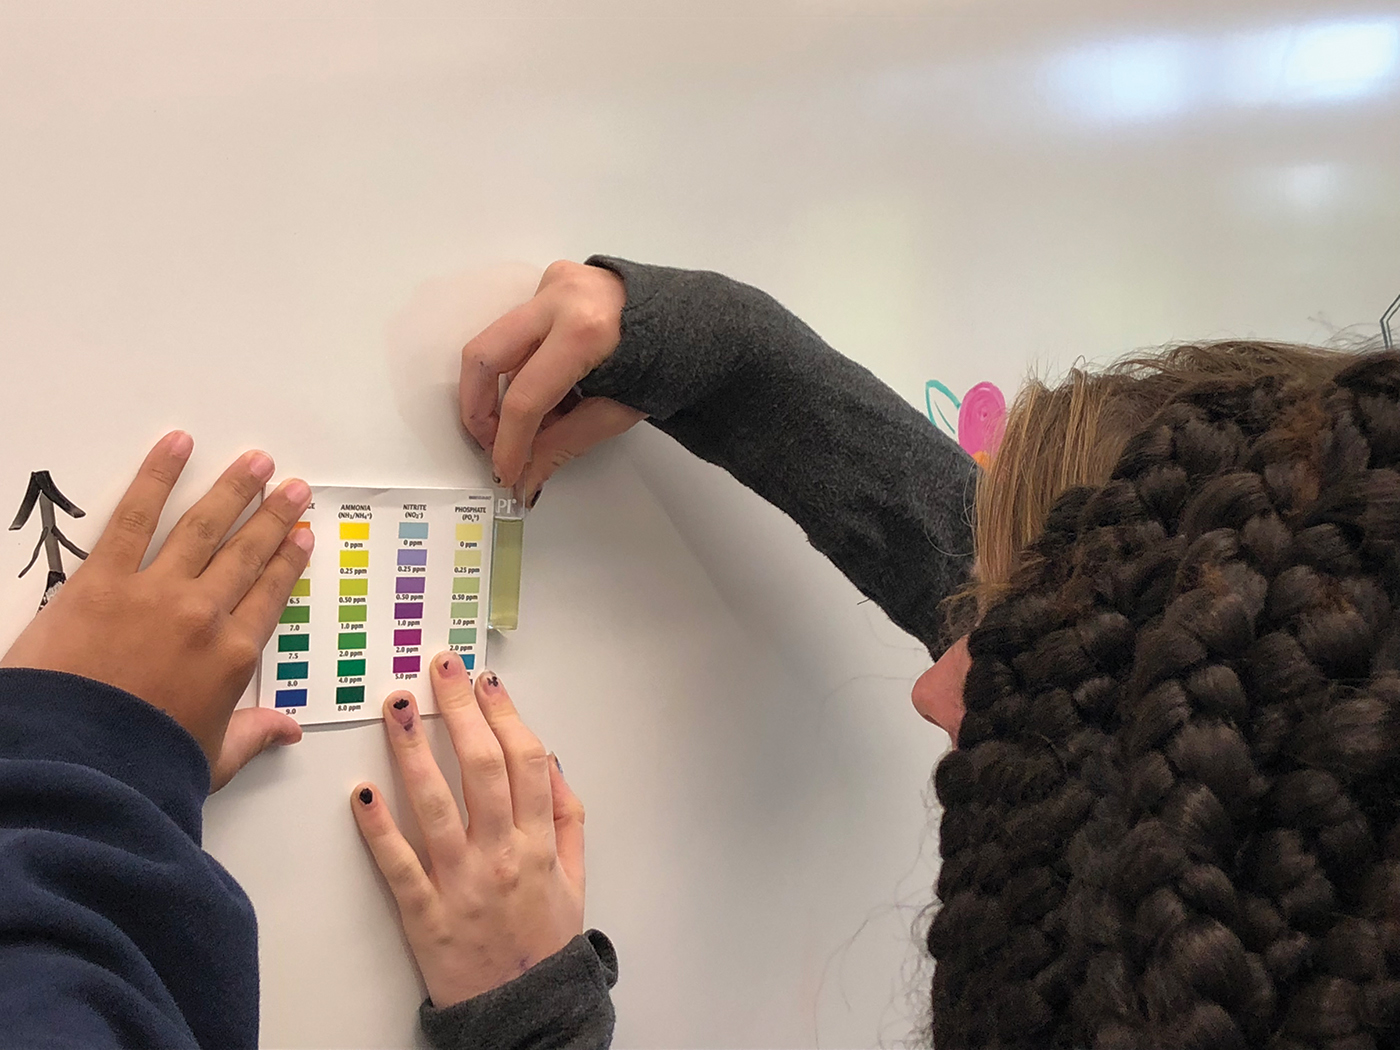
Comparing results with a test chart.
When students find a value from the color chart on which both partners agree, they record the values in their science notebooks and on a dry-erase board where they can be compared to their predictions and to other values earlier in the day. These values were also entered in a data log and posted on our shared blog. But what do the colors really mean? Is the water healthy?
What do the results mean?
For the nitrate test, levels from 1–10 ppm are safe for drinking, but levels over 3 ppm indicate pollution (usually from runoff containing fertilizers or animal waste) and can lead to excessive plant and algae growth. When levels reach 10–20 ppm, the aquatic diversity of the ecosystem will show decline. For phosphate, levels above about 0.1 ppm indicate pollution and can lead to excessive algae growth and eutrophication. Phosphate levels in healthy ecosystems are typically below 0.05 ppm. Although some of the effects of elevated nutrient levels in waterways emerge during students’ background research, the results of this test can serve as a catalyst to research common effects of excess nutrients, like eutrophication. We have shared Internet Resources that provide ample information for students to continue their research back in their classrooms.
An Added Demonstration
A demonstration of the impact of fertilizer on our water resources can be a great way to help students understand how runoff can be detrimental to the environment. This can be quickly demonstrated by collecting and testing pond water that has been run through fertilizer-infused potting soil. We simply asked the students to predict what would happen to the nutrient level of pond water if you ran it through fertilized potting soil. We recorded their predictions on the board.
Students watched as we placed a handful of potting soil in a coffee filter suspended over a beaker using a large funnel. We then poured a pond water sample into the funnel, and the effluent was collected in the beaker and tested in the same manner as before. Students were amazed at the extremely high nitrate and phosphate levels of the effluent water. This began a brief discussion about runoff and how quickly it can change the health of our waters and ecosystems.
Stewardship and Civic Action
Students left the field experience with a challenge: Is there a nutrient issue in the waters near your school—and what can you do to change or prevent that from happening? A strong element of this activity is the sharing of data and experiences across institutions. While measuring the quality of the water, teachers and professors emphasized that environmental issues present at each institution can eventually impact the quality of the Chesapeake Bay ecosystem. Understanding that we all belong to the same watershed, we believe, makes the sharing of data even more meaningful for all students. Along with the sharing of data on the blog, after students develop and refine explanations with their groups in class, they make and respond to claims regarding elements that may be causing excessive algae growth and the potential consequences if it is not addressed.
While each institution generated its own plan to help solve the environmental issue, proposed solutions were posted on the shared blog. University students planned to clear large areas of an invasive species, English ivy, that could eventually kill off tall trees that provided shade for the storm water ponds. They also planned to harvest some of the algae from the pond to use in vermicompost. With the help of templates in Microsoft Word, elementary students chose to design flyers to spread awareness of behaviors that can help solve the problem. University students were available to provide suggestions for revision and editing as students posted their flyers on the shared blog. These flyers were structured in a way that allowed the fourth-grade students to share what they had learned; thus, the flyers served as summative authentic assessments (Figure 4).
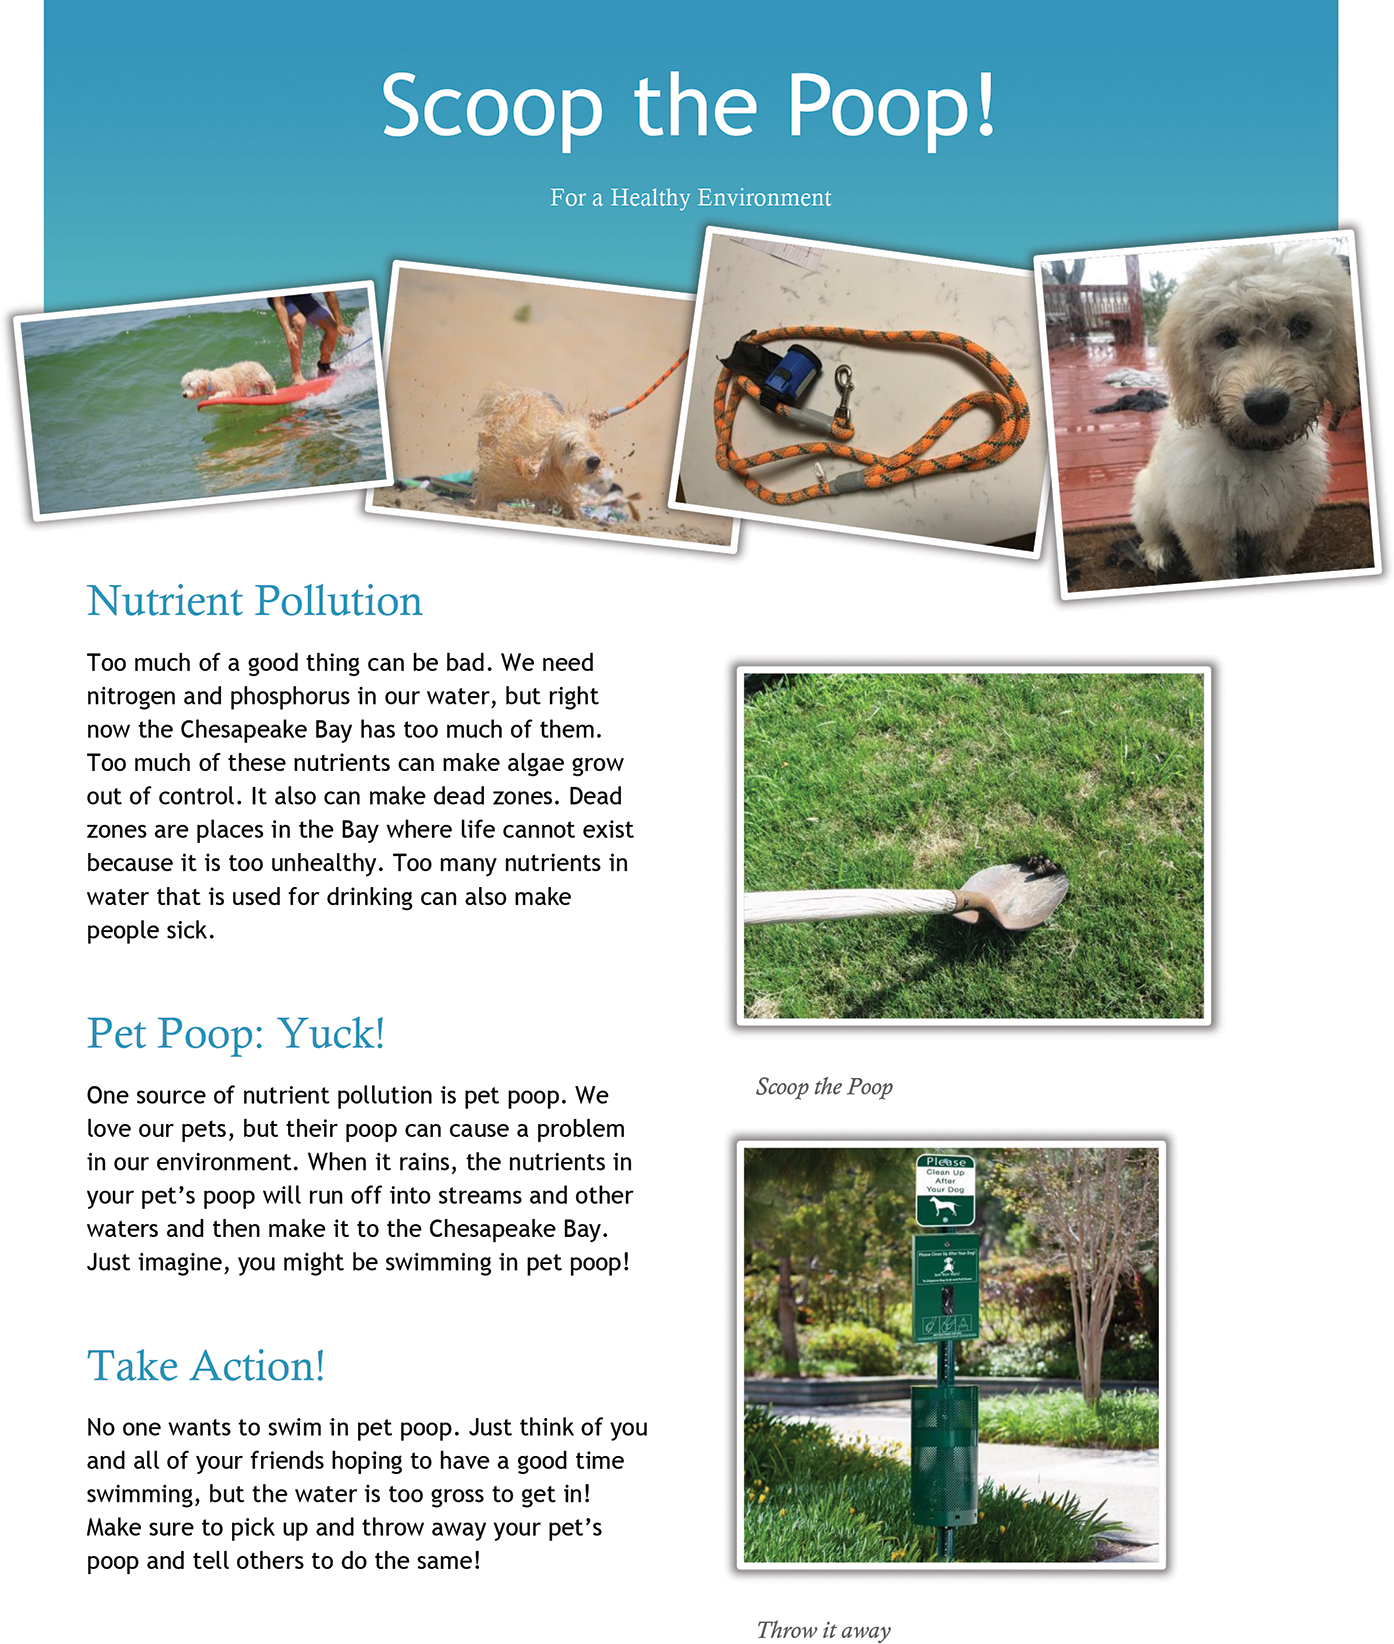
Student-created flyer.
The flyers began with a description of nutrient pollution, identified and described one possible source of the issue, and then provided a list of actions citizens can take to decrease the problem. Throughout the project, students used the blog to post pictures of themselves scooping their pet’s poop, clearing invasive species, monitoring water quality, composting grass clippings, and other environmentally conscious actions.
Developing this project into an annual endeavor allows us the opportunity to share previous findings with students throughout the years. This can help students understand the time it takes to make a difference and evaluate particular actions to see which might have made the largest positive impact. For example, students can revisit the same area that was cleared of invasive species a year prior and see if it has come back. Students can compare the amount of algae from past pictures aligned with related nutrient measures and related amount of direct sunlight on the local water features over the years to make more robust claims and conclusions.
Project Wrap-Up
For this project, we close the lesson by debriefing about the process students went through. How did it go for you? Did you feel like your actions to help the environment were worth it? What were some of your failures or successes for you during the process? As discussion continued, students divulged their hope and commitment to continue to observe, notice, and act to resolve problematic issues in their local watershed. To provide a means to do this, the elementary school has developed water quality backpacks available for checkout. These backpacks were prepared for student and family use and available for weekend checkout through the classroom teacher. Each backpack contained binoculars, a simple, nontoxic water quality test kit, a Secchi disk, a refractometer, and a water thermometer. Additionally, each backpack contained an observation journal, a Secchi disk how-to guide, and directions for the water quality kit and refractometer. The shared blog was always a place to post their findings and thoughts as well. The contents and related prices to create this backpack is illustrated in Figure 5.
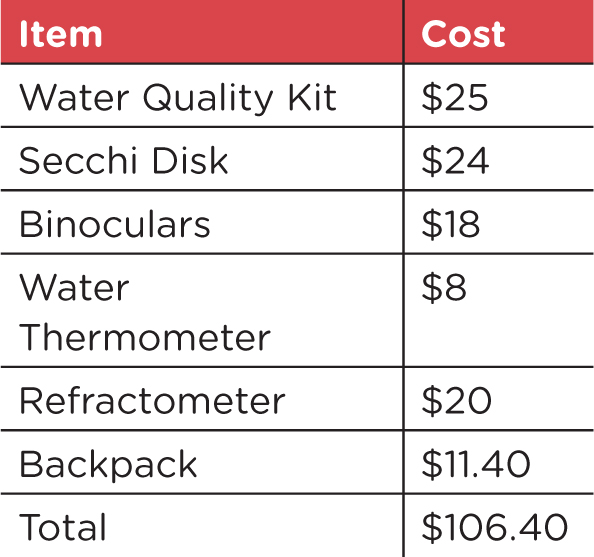
Bay backpacks materials and costs.
No wrap-up of a lesson is complete without the instructors’ reflection. An interdisciplinary group of university students majoring in biology, chemistry, environmental science, and/or preparing to be elementary, special education, or secondary teachers took part in this project either as a part of a course, or as volunteers. The chance for these university students to develop activities based on college-level knowledge while making it palatable for elementary students is a valuable skill in its own right, but our reflective discussion mainly revolved around the positive impact the mentorship had on both parties. To their surprise and delight, university students were treated like academic celebrities and reflections were filled with positive statements. A reflective journal from a university student stated, “The Downstream Collaborative Project was the highlight of my Freshman Year!” Elementary students, on the other hand, were afforded the opportunity to experience authentic science on a college campus with real students. Many were already talking about attending college as they left campus. One student asked, “How many years till I can come to college here?” and countless similar sentiments followed. Such positive feedback has made us think about ways to expand our efforts.
Conclusion
For many reading this article, it may seem that a partnership like the one described would be difficult to cultivate and retain. However, all across the country there are environmental organizations, museums, higher learning institutions, and governmental agencies who are often looking for meaningful partnerships that will benefit the environmental health of their communities. In fact, several organizations have contacted us willing to assist with our current project. Our partnership began with a phone call and a simple idea of a shared blog, but this simple idea developed into a project benefitting hundreds of students, teachers, teacher candidates, two institutions, and the health of the Chesapeake Bay Watershed.
William McConnell (wmcconnell@vwu.edu) is the Director of Teacher Education at Virginia Wesleyan University in Virginia Beach, Virginia. Maury Howard is an Associate Professor of Chemistry at Virginia Wesleyan University, and Katie Catania is an Assistant Principal at Holland Elementary School in Virginia Beach.
Earth & Space Science Environmental Science Life Science Elementary