
Never Too Young to be a Citizen Scientist!
Science and Children—October 2019 (Volume 57, Issue 3)
By Mary Hatton, Sara Grimbilas, Caroline Kane, and Tara Kenyon
Kindergarteners learn about plants and seasons through a yearlong project.
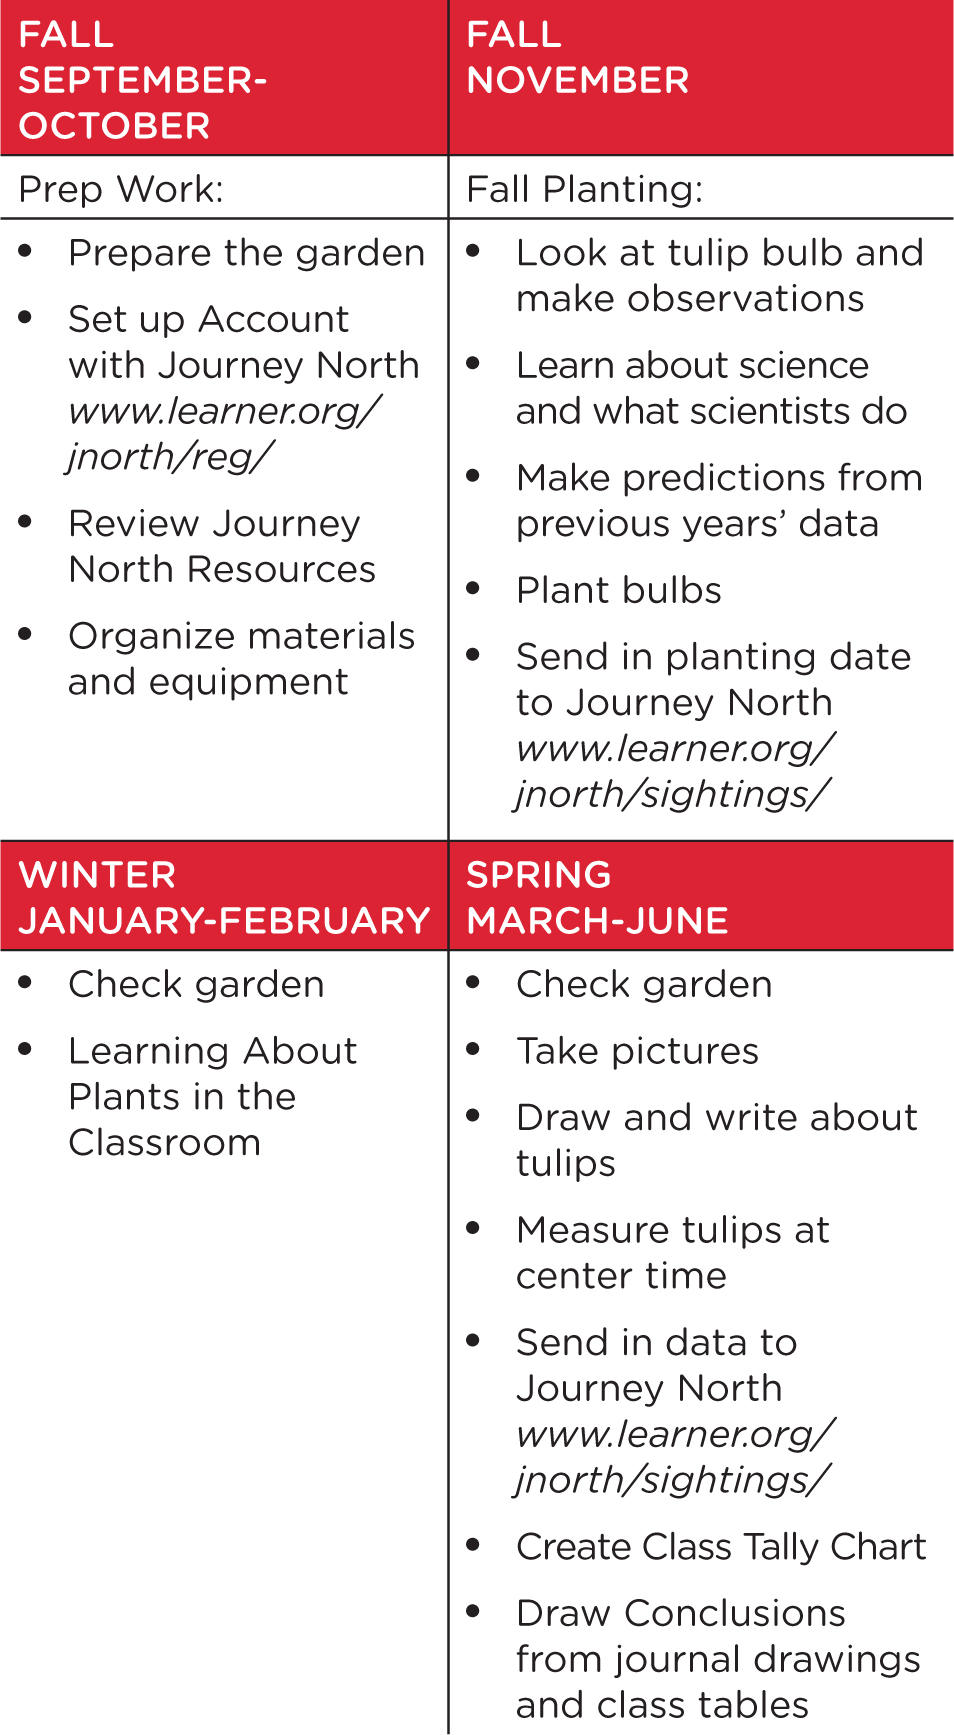
Will spring be early next year? This is a question we ponder each fall as we prepare for a yearlong citizen science project with kindergarteners. Citizen science projects naturally promote the development of science and engineering practices. These projects can be integrated at any grade level and aligned to meet other content areas as students participate in authentic inquiry. We participate in the “Tulip Test Garden” to meet goals for learning about plants, living things, weather, and seasonal changes. This project is inspired by Journey North, an organization that engages teachers and individuals in documenting migration patterns and seasonal changes (see Internet Resources). Journey North requires purchasing minimal materials and provides teachers with classroom resources, online support, real-time maps, data, and background information. Our students become engaged in making predictions, becoming scientists, and planting in the fall months. In the spring, students observe the tulips’ growth and life cycle in their garden and develop a deeper understanding about plants through classroom activities and literature. An overview is shown in Figure 1, p. 50.
Engaging at Planting Time
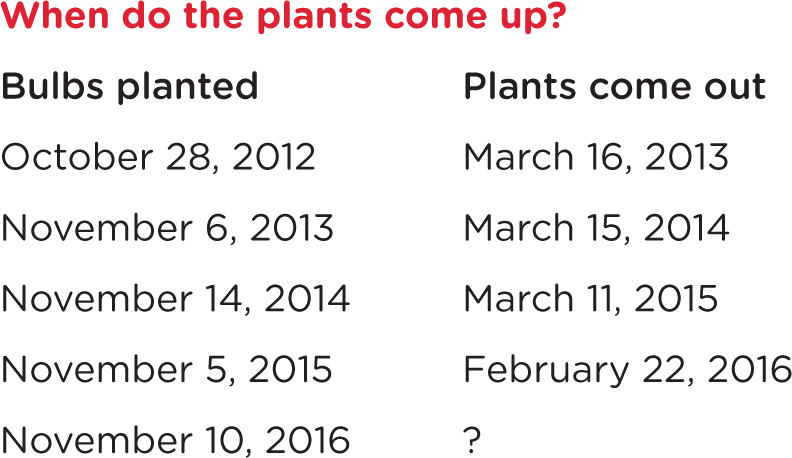
In the fall we talk with the students about how, “This year we are working on a project to help scientists learn when spring happens in our town.” Since this is our fifth year planting, we use data as evidence to predict when we think spring will arrive. We display previous years’ data (Figure 2) and ask the students, “What do you think ?” “We are planting the tulips near the same day as last year, and when did they come out?” “Did they come out at that time each year?” Last fall, students predicted that the tulip plants would emerge in March. Some of the students explained that the reason was, “Most of the time, they come out in March,” no matter when we plant them. Engaging students in a guided discussion about the months and looking at the dates, students can use evidence to infer and discuss reasons for their predictions.
As a class, we gather at the rug to observe a tulip bulb by looking at it and feeling it. The students describe the shape, size, color, and texture of the bulb and share their own descriptions: “It’s round.” “It’s brown.” “It’s smooth.” “It looks like an onion.” We mention the names for parts such as the outer leaf that acts as a coat to protect the bulb and the bumps at the bottom where roots will grow. We carefully observe differences between the bottom and top. “What is the shape at the top?” Students often reply, “The pointy part” or “triangle shape,” and that the shape of the bottom is “round” or “fat.”
This prepares the students for planting the bulb correctly. We cut one bulb and show the students the leaves inside and the embryonic stem and bud (baby plant). For safety, we handle the cut bulb with gloves and show the students. We also discuss handling living things properly with care and make sure students wash hands with soap and water after handling plants and soil.
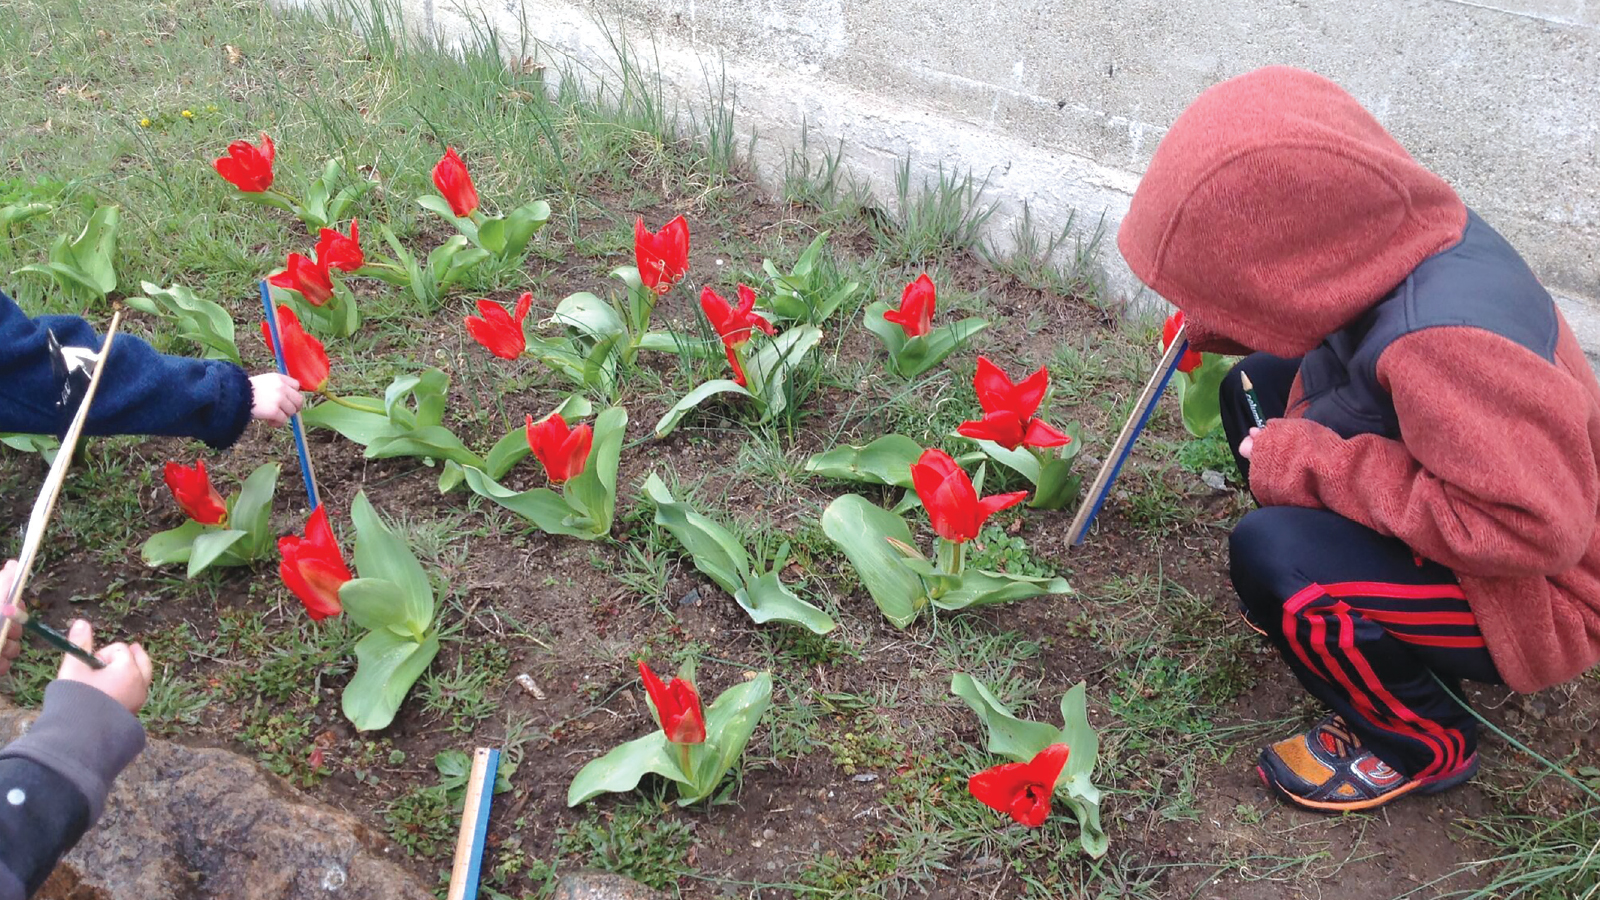
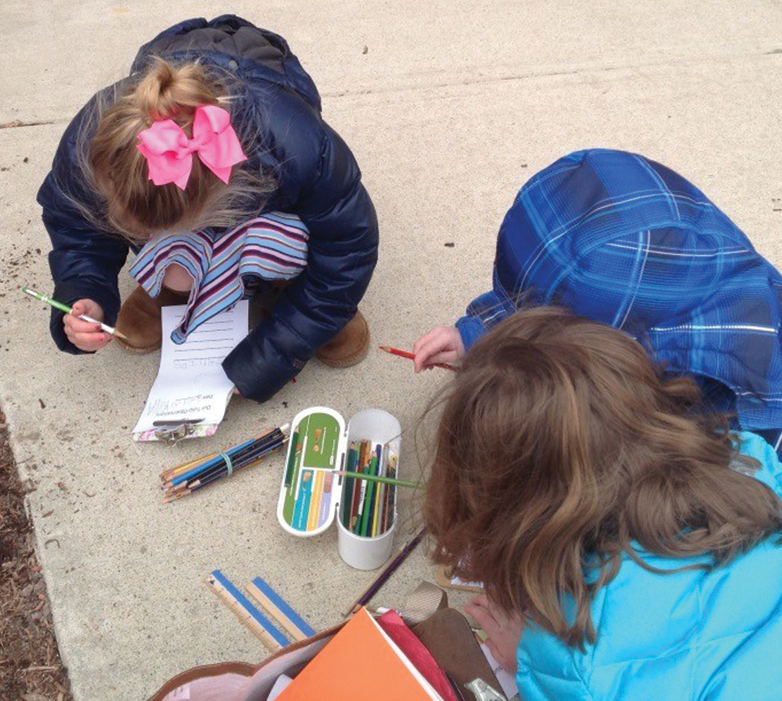
The teacher models and talks about planting the bulb like a scientist. We have to plant the bulbs the same way all across North America. After teachers model how to plant, with the “pointy” side up, we go out as a class with clipboards, a tulip observation book, and tool bag. We ask the students to show us how to hold the tulip bulb and place it in the hole. Annually we spend less than $50, which includes: 90–100 “Red Emperor” tulip bulbs—the variety Journey North requires (see Internet Resources). We work with our school principal and building and grounds personnel to prepare the gardens for the fall. Initial start-up costs for this project also included tools funded by the school’s parent organization, such as 12 trowels at $5 each. Depending on funding and space for a garden, we have also given pairs a bulb to share. The students draw and write about the bulb in their tulip observation book and take turns planting their bulbs. To avoid overcrowding and trampling in the garden, we have half the class at the garden at a time and alternate between planting and drawing/writing observations. The tulip observation book is kept in the classroom and used to document observations in spring.
On the Journey North website, teachers enter the planting date, and later report the date the tulip plants emerge from the ground and the date that the plants bloom. After this initial experience in October or November, teachers take time to develop a deeper understanding about what a scientist does. The students read What Is a scientist? by Barbara Lehn (2006). This nonfiction book presents the practices and skills of scientific inquiry. Lehn describes how scientists use senses, notice details, draw what they see, and write about what happens. These are all skills and practices that are carried out through this investigation. The students reflect how they were being scientists with the tulips.
Exploring in Spring
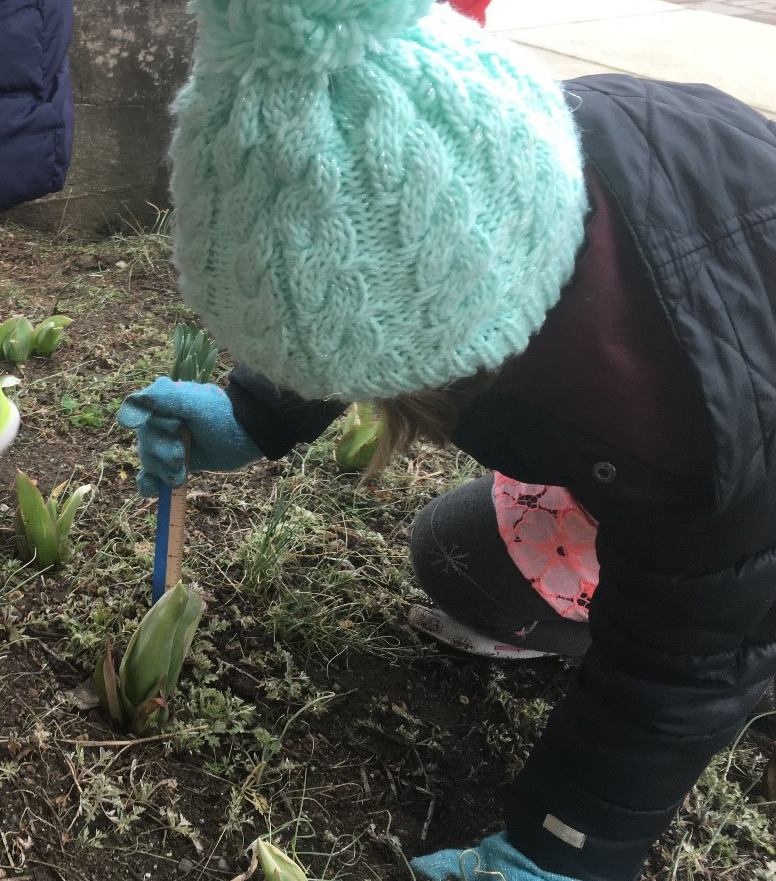
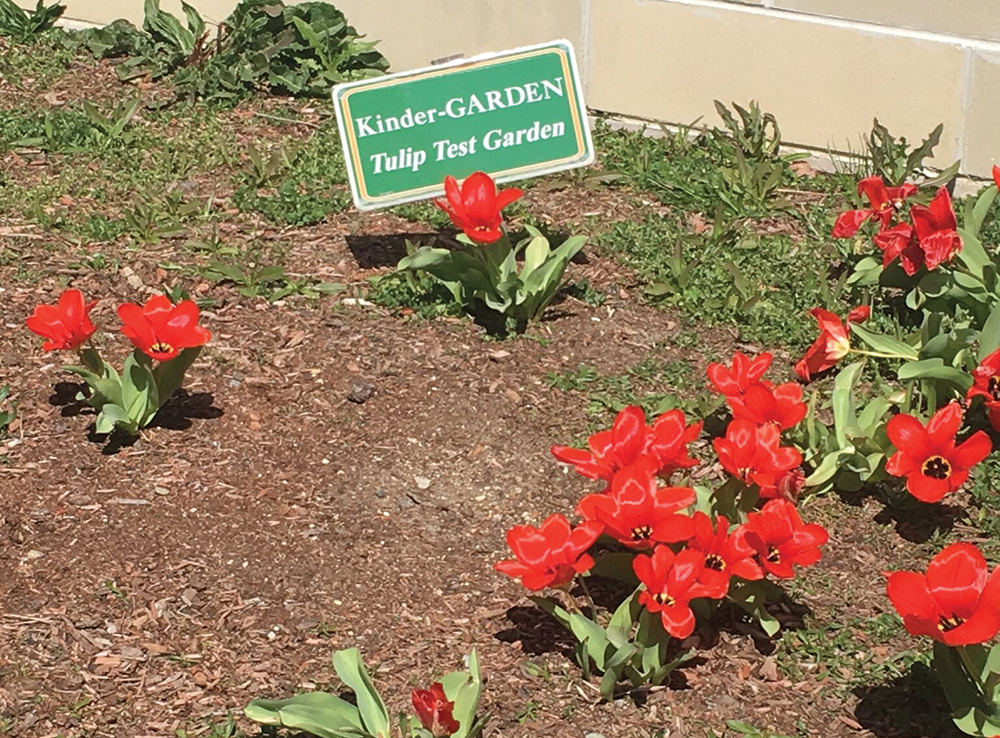
When spring rolls around, the tulips emerge and the students prepare to explore tulip plant growth by making weekly visits to the garden for three months and making observations in their tulip observation book. At the first spring visit, students learn how to make observations and revisit fall predictions We decide together whether spring is earlier or later than it was last year: “This year the first plants came up on February 24.” So we take another look at data with the students. They realized it is almost the same as last year but February, not March. “Does this mean spring is early or later this year?” The students are asked to think about the numbers while looking at a calendar and conclude, “Spring is early” this year. Then we discuss how we will make observations and learn how the plants grew. “How can we tell if the tulips are growing?” “How does your doctor check to tell how you are growing?” We discuss how the doctor measures “how tall” they’ve grown. We relate this to the plants by telling the students that we can measure the height of the tulip plants. The teacher models how to measure and read the ruler. The students practice holding the ruler on top of the ground right next to the stem to the tallest part of the plant and a partner helps read the measurement.
At the start of each weekly garden visit, each group gathers around the garden for some “tulip see and talk time.” We ask the students to use their sense of sight and ask, “What do you notice about the plants? Does it look the same as last week? What is different?” The students usually start off with their own observations such as, “Look at the color!” “They’re red!” “Look at how big they got!” “How come they are yellow?” or “There’s no flowers yet!”
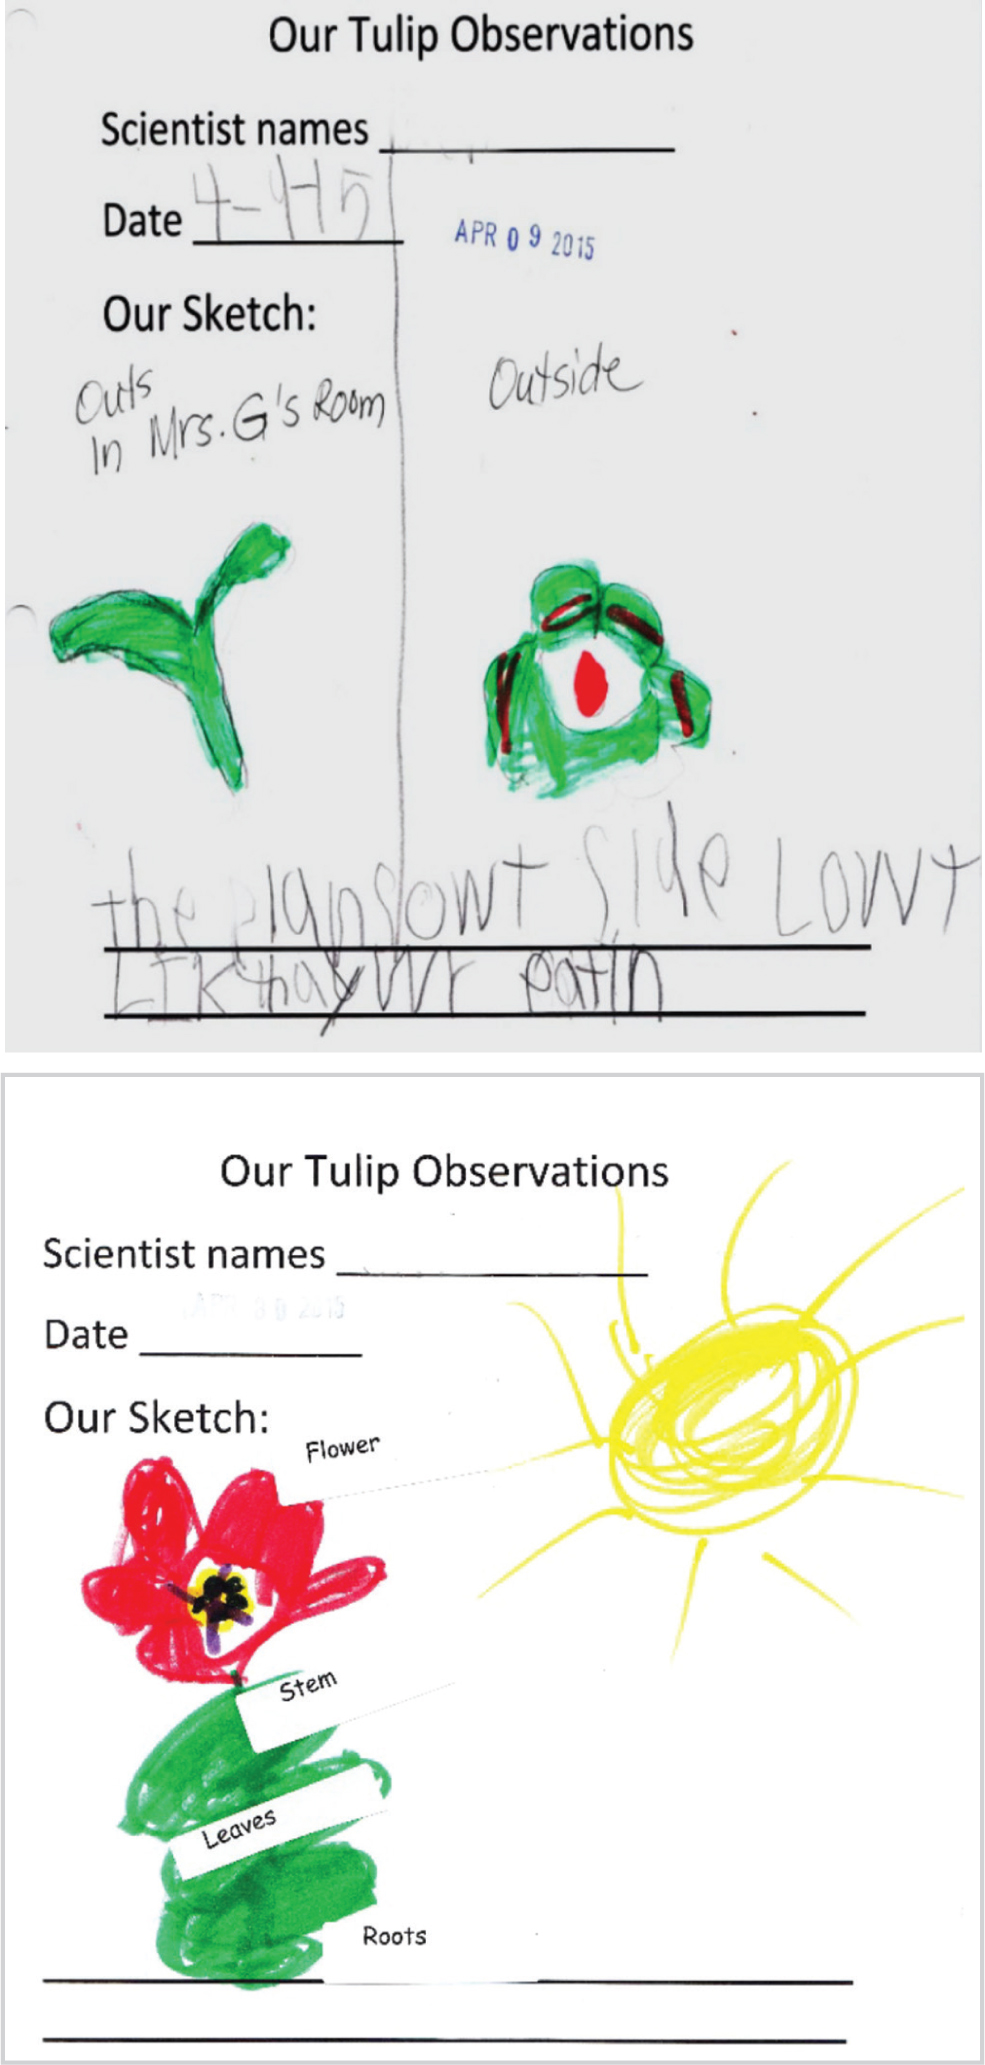
The students measure each week. They count plants and leaves, measure the height of the plant, draw and color the plant accurately, and write about the plant in their tulip observation book (Figure 3, p. 52). The teacher emphasizes and communicates to the students that this is how scientists write in their science books. The observation book can be organized to scaffold thinking and writing skills. For example, in the first month, some teachers will put in the inches for the students. We have found that sentence starters help the students think about writing complete sentences. Pictures can help, followed by choosing words, filling in the blanks and leaving space for independent writing.
As the weeks progress, the teacher can differentiate writing in the observation book and develop descriptive writing about the plants and the weather. To help the students develop a sense of documenting observations accurately, guiding questions are used to help focus the students and think about how to make observations and comparisons. We reinforce that scientists make accurate observations and draw what they see happening, not what they imagine will happen.
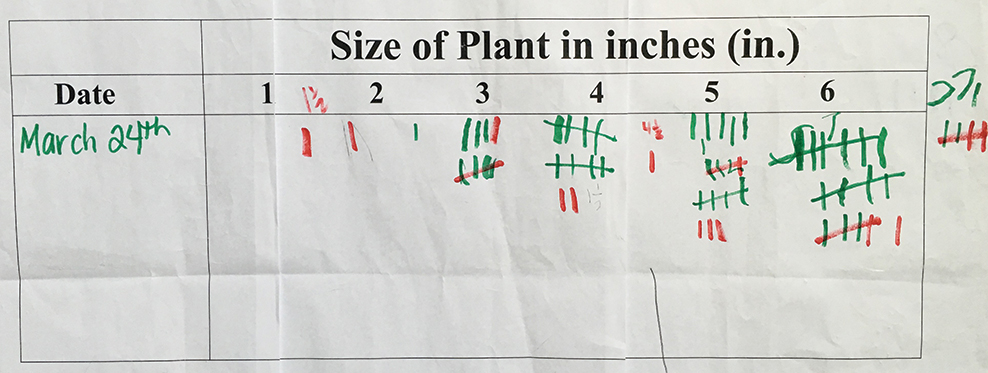
As the students become familiar with the routine, we introduce other tasks for students to complete, such as taking their own digital photos of the plants. These are shared on our web page and used in slide shows. We bring out a tally chart (Figure 4) and show the students how to fill in their measurements and compare measurable attributes such as the height of plants and number of leaves. The tally chart shows the frequency of measured plant height each week the students make observations. This allows us to discuss and draw conclusions about how the tulip plant is changing and provides overall data for discussions about overall length of the tulip life cycle, range in height of the tulip plant, and number of weeks it takes for the plants to bloom. Each week, the students become more independent, helping to give out rulers, measuring, and sharing data on their own. In addition, making time for discussion supports students in becoming more accountable for making scientific claims and using evidence to make sense of science phenomena.
Developing Explanations
In addition to observations, we support students’ learning about needs of plants and animals in other ways in the classroom. We have had students use “digital learning time” to do research from nonfiction sources and communicate a collage report about what plants and animals need to survive and plant parts. In addition, the literature listed in the Resources supports the field study, plant growth, and caring for plants. We engage the students in different classroom experiences that support the field study experience, such as planting and caring for seeds in the classroom. We engage students in these experiences close to the start of spring or during the spring as they collect data from the tulip plants.
After the first two to three weeks of observations, the students have enough data to notice changes in the plant’s growth and emergence of new plant parts. We support students as they develop explanations using evidence from their tulip observations during “talk and reflect” time, summarizing class tally charts, reading nonfiction books, and engaging in hands-on science centers to explore plant structure and function. These experiences are integrated with field work so the students can make deeper connections with their investigation.
Each week, we ask, “What happened? What did we like about today? What are some new predictions? “What do we think will happen next week when we come out?” Students predict, “They will have flowers.” “They will grow 12 inches.” “They will grow taller.” Students notice that their plant is taller each week and we define this with them, “This means the tulip plant is growing.” Once the teacher introduces a term, we use it during discussion with the students. When the students begin to ask and notice the different parts of the tulip plant that emerge, we read the books Plant Lifecycles (Ganeri 2005) and Seed to Sunflower (La Defoyere 2009), which describe the parts of a plant and identify stages in the plant lifecycle. You can read the whole story or stagger them as the students experience actual lifecycle changes. We also have science activities for the students to explore about the structure and function about plant parts (see NSTA Connection). The students use this information when they go out to the garden. A portable “word wall” of plant terms can be useful for the students to use as they write in their observation book. They are asked to label the parts of the plant they recognize and discuss science terms as part of the “talk and reflect” time when the teacher asks what parts they see this week.
As we gather more data, we compare and contrast the similarities and differences between attributes of different stages of the plant lifecycle using the tulip observation book. Examples of guiding questions we might ask are shared online (see NSTA Connection). Asking these types of questions, encourages the students to raise their own questions, and make inferences, explanations, and predictions. Students develop an understanding about science phenomena as scientists.
Elaborating About Lifecycles and Spring
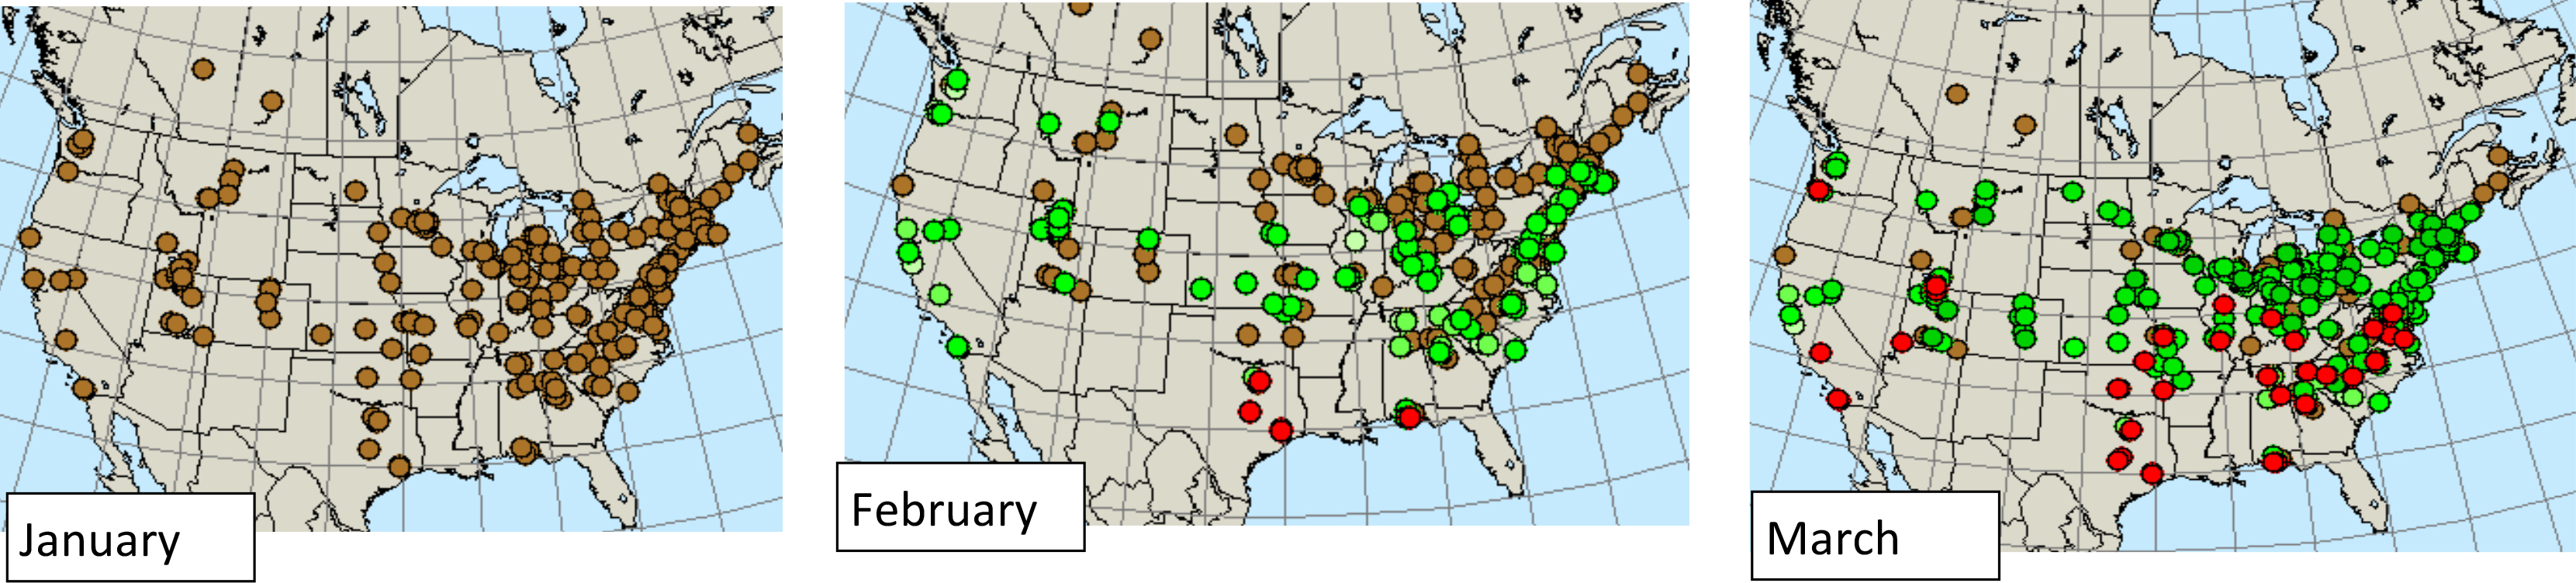
At the end of the investigation, students develop a summary about the life cycle of the tulip and spring in North America by analyzing data. We look at a calendar and count the number of months it took for the plant to grow and how many weeks for plants to bloom. We also count how long the plants live and take another look at tally charts to discuss the data. We use guiding questions through discussions to help the students develop inferences about the data. How tall was the tallest tulip plant? Are they all the same height? How tall were most of the plants? We also show the students maps of some monthly data from Journey North. These are color coded showing when and where bulbs were planted, emerged, and bloomed. Through a whole-class meeting, we look and compare how tulip life cycles in our town compare with other parts of North America (Figure 5, p. 54). We display these maps, identify what we see, and compare and contrast the data to find patterns about when spring occurs in our state and in other places in the United States. First we identify what the colored dots mean: Green means when the plants came up, red means they have flowers. We mark where we are located and students come up and point out where the green and red dots show up first. Students see the data and can infer that states with all the green are located in the southern parts of the United States, as “the lower regions have spring earlier than we do.” The students use evidence from their investigation to develop a conclusion about spring and analyze data to recognize that tulip evidence tells us that spring can happen at different times in different parts of North America. We often ask if students go to Florida in the winter and talk about how the climate is warmer there and relate this to the maps. “Let’s go back to our maps and check when the tulip plants emerge near Florida.” In some classes, students record a table of average data for each school day. This allows for additional analysis of patterns of temperature changes and discussion about how warmer weather brings water and warmth for plants to grow. The students use and analyze evidence from their firsthand experiences and consider what evidence tells us about tulip life cycles and spring both from their town and other places in North America.
Evaluating Learning
Students are formatively assessed throughout this project during weekly observations and individual discussions. These assessments revealed that kindergartners can independently identify the parts of the plant in their sketches and discussions, draw and label plant parts accurately without being prompted, draw and recognize different life cycle stages, and use plant vocabulary when asked about how the plant changes. Additionally, the scientific practices become a habit, such as measuring and recording plant height data. By the end of the first month in the spring, students begin the “talk time” discussion without being prompted.
In addition, we asked kindergarteners about being scientists. “When do you think you were scientists this year?” Some mentioned other science experiences and 38% mentioned when working with tulips. Some specifically mentioned parts of the investigation process such as, “writing what things look like in the tulip observation book,” and “measuring tulips.” When the students were asked about what they liked most about the investigation, they commented about the process of science, such as measuring the plants, coloring drawings, discussing tallies, and growing flowers. Two students commented about discovering when tulips grow and die. From the results of this experience, it became clear to us that students demonstrated they have a general understanding of the tulip lifecycle and positive attitudes toward being a scientist.
Our experiences demonstrate that citizen science engages students in authentic inquiry so that students become scientists while using the scientific and engineering practices and developing a deeper understanding for science concepts associated with plants and their life cycle. In this experience, students clearly understand that a bulb develops through stages before becoming a flowering plant. The long-term nature of this project allows teachers to model doing and thinking about science and for students to become self-sufficient using them. Citizen science supports the development of both content and practices supporting science literacy for next generation scientists—even as early as kindergarten.
NSTA Connection
Download project materials at www.nsta.org/SC1019.