
feature
Earthworm Distribution in the Schoolyard Ecosystem

CONTENT AREA Life science
GRADE LEVEL 6–8
BIG IDEA/UNIT Population Ecology
ESSENTIAL PRE-EXISTING KNOWLEDGE
Ecosystems are composed of both biotic and abiotic factors, which organisms require to survive. The abundance of these resources can impact the distribution and abundance of species.
TIME REQUIRED Two 55-minute class periods
COST Approximately $30
SAFETY
Chemical splash-proof safety goggles. For information regarding field trip safety, see NSTA Safety Advisory Board
Often students come into the classroom understanding the roles of plants and mammals in ecosystems. They understand that there are both biotic and abiotic resources that these organisms need to survive, which can in turn impact the distribution of these species. But what about invertebrates? Little thought is given to earthworms—ecosystem engineers that have changed the face of our North American forests with their introduction.
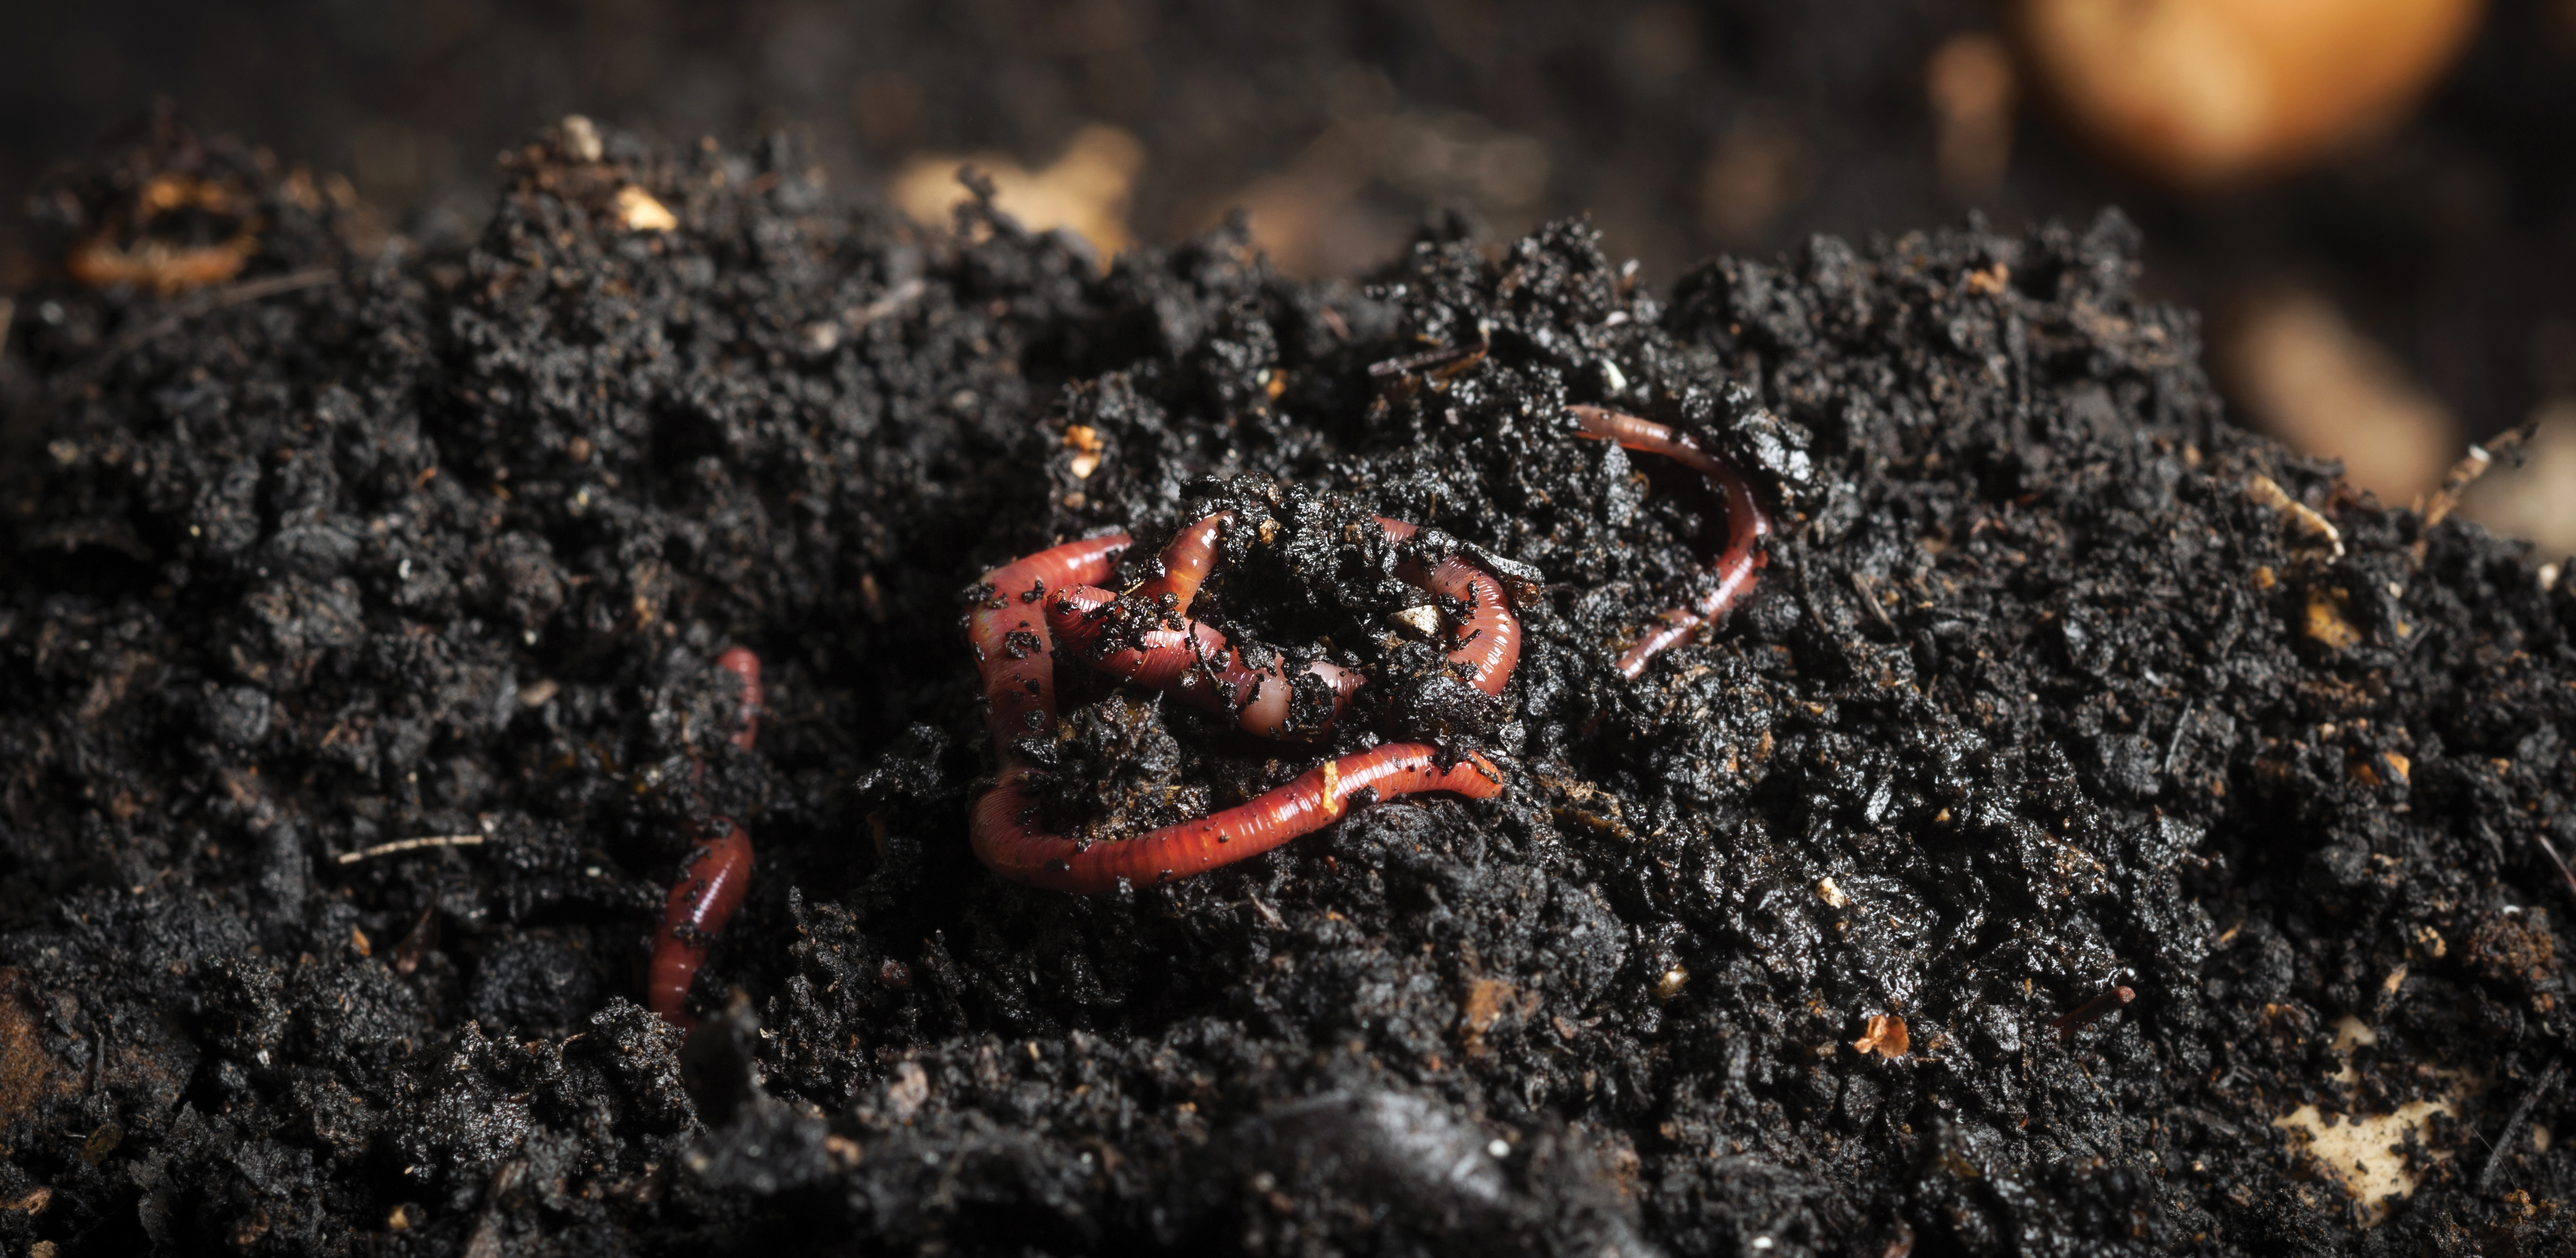
Scientists and anglers have long extracted earthworms from the soil. This has been done by simply digging up layers of sediment or even pouring soapy solutions over the soil. However, it is more common that earthworms are coaxed to the surface with a solution of dry mustard powder and water. The mustard acts as a mild irritant, drawing worms to the surface. The earthworms can then be rinsed with nonchlorinated water and added to bait buckets or set aside for sampling.
In this lesson, students will use the mustard extraction technique to collect earthworms and determine the impact that resource availability has on their abundance. Research questions are driven by students’ own inquiry, giving students ownership of the learning process.
Earthworm basics
Earthworm species play a significant role not only in soil formation and aeration, but also in nutrient cycling, climate regulation, pollution remediation, and primary production (Blouin et al. 2013). Yet, the hardwood forests of North America have changed dramatically with the introduction of earthworms by European settlers in the soils of crops coming from Europe (Hale 2013). Forests once had a thick coating of “duff,” a layer of decomposing plant and animal materials above the soil’s A-horizon, but earthworms have accelerated the rate of duff decomposition through consumption and mixing of soil layers. The once thick duff layer supported germination of a number of native plant species, but with its loss, ground-dwelling organisms such as the blue-spotted salamander and the ovenbird have lost valuable habitat (Hale 2013).
To get students started with this activity, we think it is important for them to recognize the role earthworms have in shaping our forests. This can be done by showing students the dramatic before and after photos of forests that have been impacted by earthworm invasion. A number of these images can be found online, including on the Great Lakes Worm Watch Forest Ecology website (see Resources).
We also start to touch on the resource requirements of earthworms at this point. Just like any other organism, earthworms require food, water, and oxygen to survive. Earthworms are considered decomposers, feeding on organic matter and microorganisms. Earthworms respire through their skin, requiring moist soil to facilitate the exchange of carbon dioxide and oxygen. If the skin of an earthworm were to dry out, they would perish, similar to those we see on the pavement following a rainstorm.
To reinforce our conversation, we like to show the 5-minute BBC documentary The Amazing World of Earthworms in the UK (see Resources). It does a wonderful job of not only highlighting the role of earthworms, but also displaying a scientist using the same collection methods we use in this activity.
Data collection
Following the video, we discuss the sampling methods demonstrated by scientists in the film. Explain to students that they will be using the same method, mustard extraction, to assess earthworm biomass at two locations with differing amounts of resources available. Resources might include: soil moisture, sunlight, soil type, vegetation cover, and so forth. Students are then each given a copy of the Earthworm Inquiry Handout (see Figure 1 for student sample; see also Online Supplementary Materials for blank version) and assigned a group of two to three students. You may choose to use pre-established lab groups or allow students to choose their own group. If you choose to take the route of pre-established lab groups, you may construct groups randomly, by ability, or by interest in particular investigative questions.
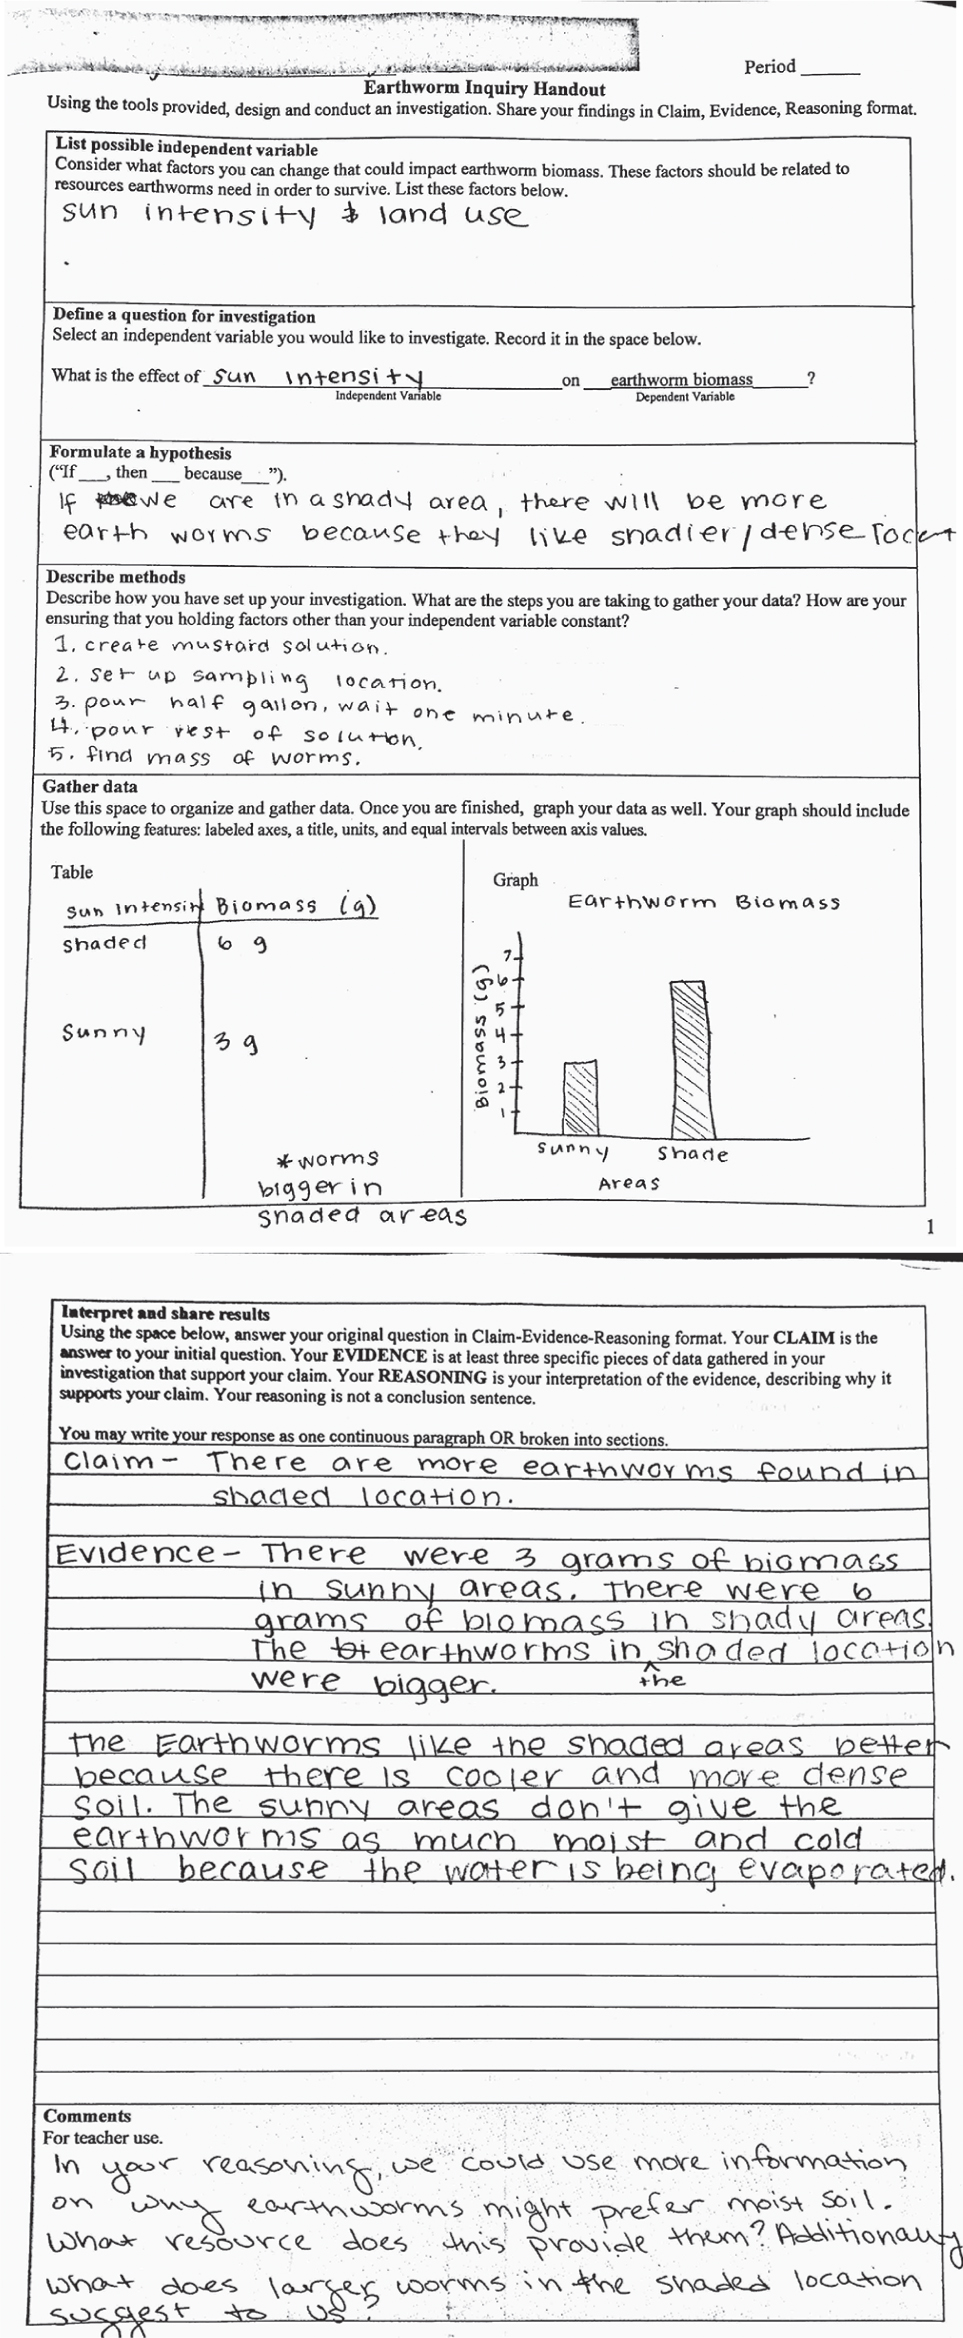
Earthworm Inquiry Handout
Groups should first work to list possible independent variables (resources) to investigate. From this list, groups should select one independent variable to explore further and use it to write their problem question. A common independent variable students choose to investigate is soil moisture, finding a location with dry soil and another with moist soil. If your group of students requires additional support and accommodations in developing questions, consider brainstorming independent variables as a class and assigning questions to groups. Additional ideas for accommodating diverse learners can be found in the Differentiation chart (see Figure 2). After writing their question, students should each create a hypothesis using the sentence starter provided (“If __, then __ because __”). Students may pull from prior knowledge or the video resource to generate their hypotheses.
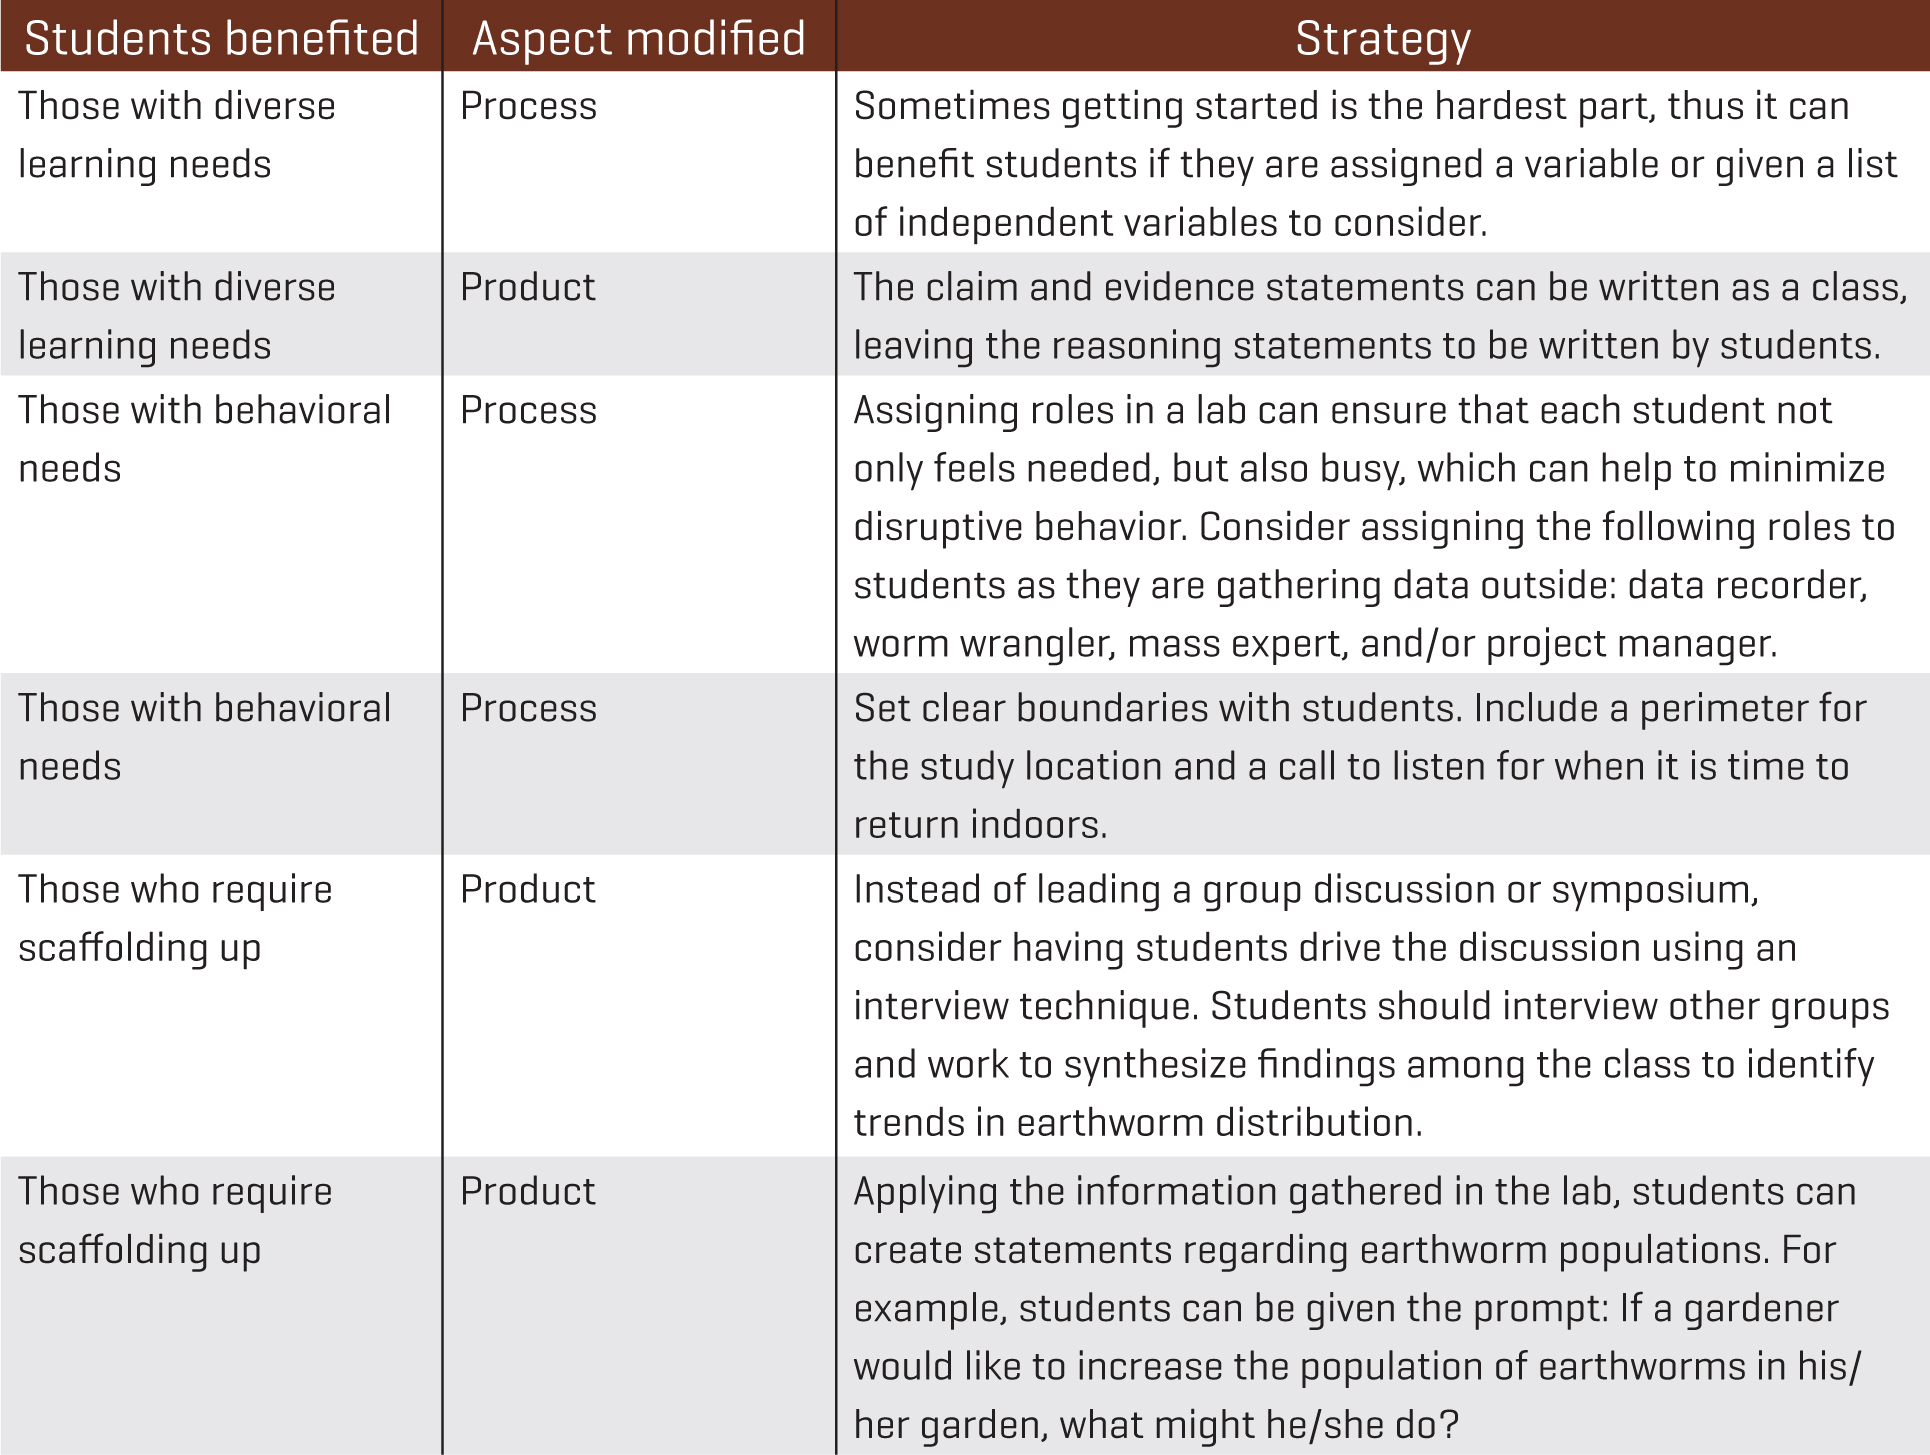
Differentiation chart
The next step requires students to propose a method for testing their question. This is a good time to reconvene and review the specific equipment required for the mustard extraction protocol. Each group will need two 1-gal. milk jugs (one for each test site) and 40 g of dry mustard powder for each container. Buckets with premarked volumes from the hardware store also work well in place of milk jugs. Mustard powder is readily available for purchase online, and there are a number of bulk spice suppliers with reasonably priced 5-lb. bags. Groups will also require one quadrat to mark their study site; these can be handmade from wire using a coat hanger to make a 12” × 12” square (30.5 × 30.5 cm). Teachers often make these quadrats ahead of time. However, if you would like students to make them, have them wear safety goggles as they work. There are also 12”-diameter PVC rings that are effective. Groups should consider how to incorporate these supplies into their procedure.
After students have outlined their methods, they may begin to prepare for fieldwork by making the mustard solution. To ensure a safe learning environment, as students weigh and mix the mustard with the water, they should wear eye protection. All water used in this investigation should be nonchlorinated to avoid potentially endangering earthworms, as chlorinated water can be toxic to worms. To prepare nonchlorinated water, leave water out for one or two days to allow chlorine to evaporate. As students work with the mustard powder, they should be reminded that it is a mild skin irritant, so contact with it should be limited. They should also avoid inhalation of the mustard powder by putting the mustard into the container first and then adding the water to the container afterward. Students can shake the milk jug to mix the solution. If using a bucket, consider mixing the solution using a paint stir stick or a ruler. You may also want to warn students not to taste the mixture.
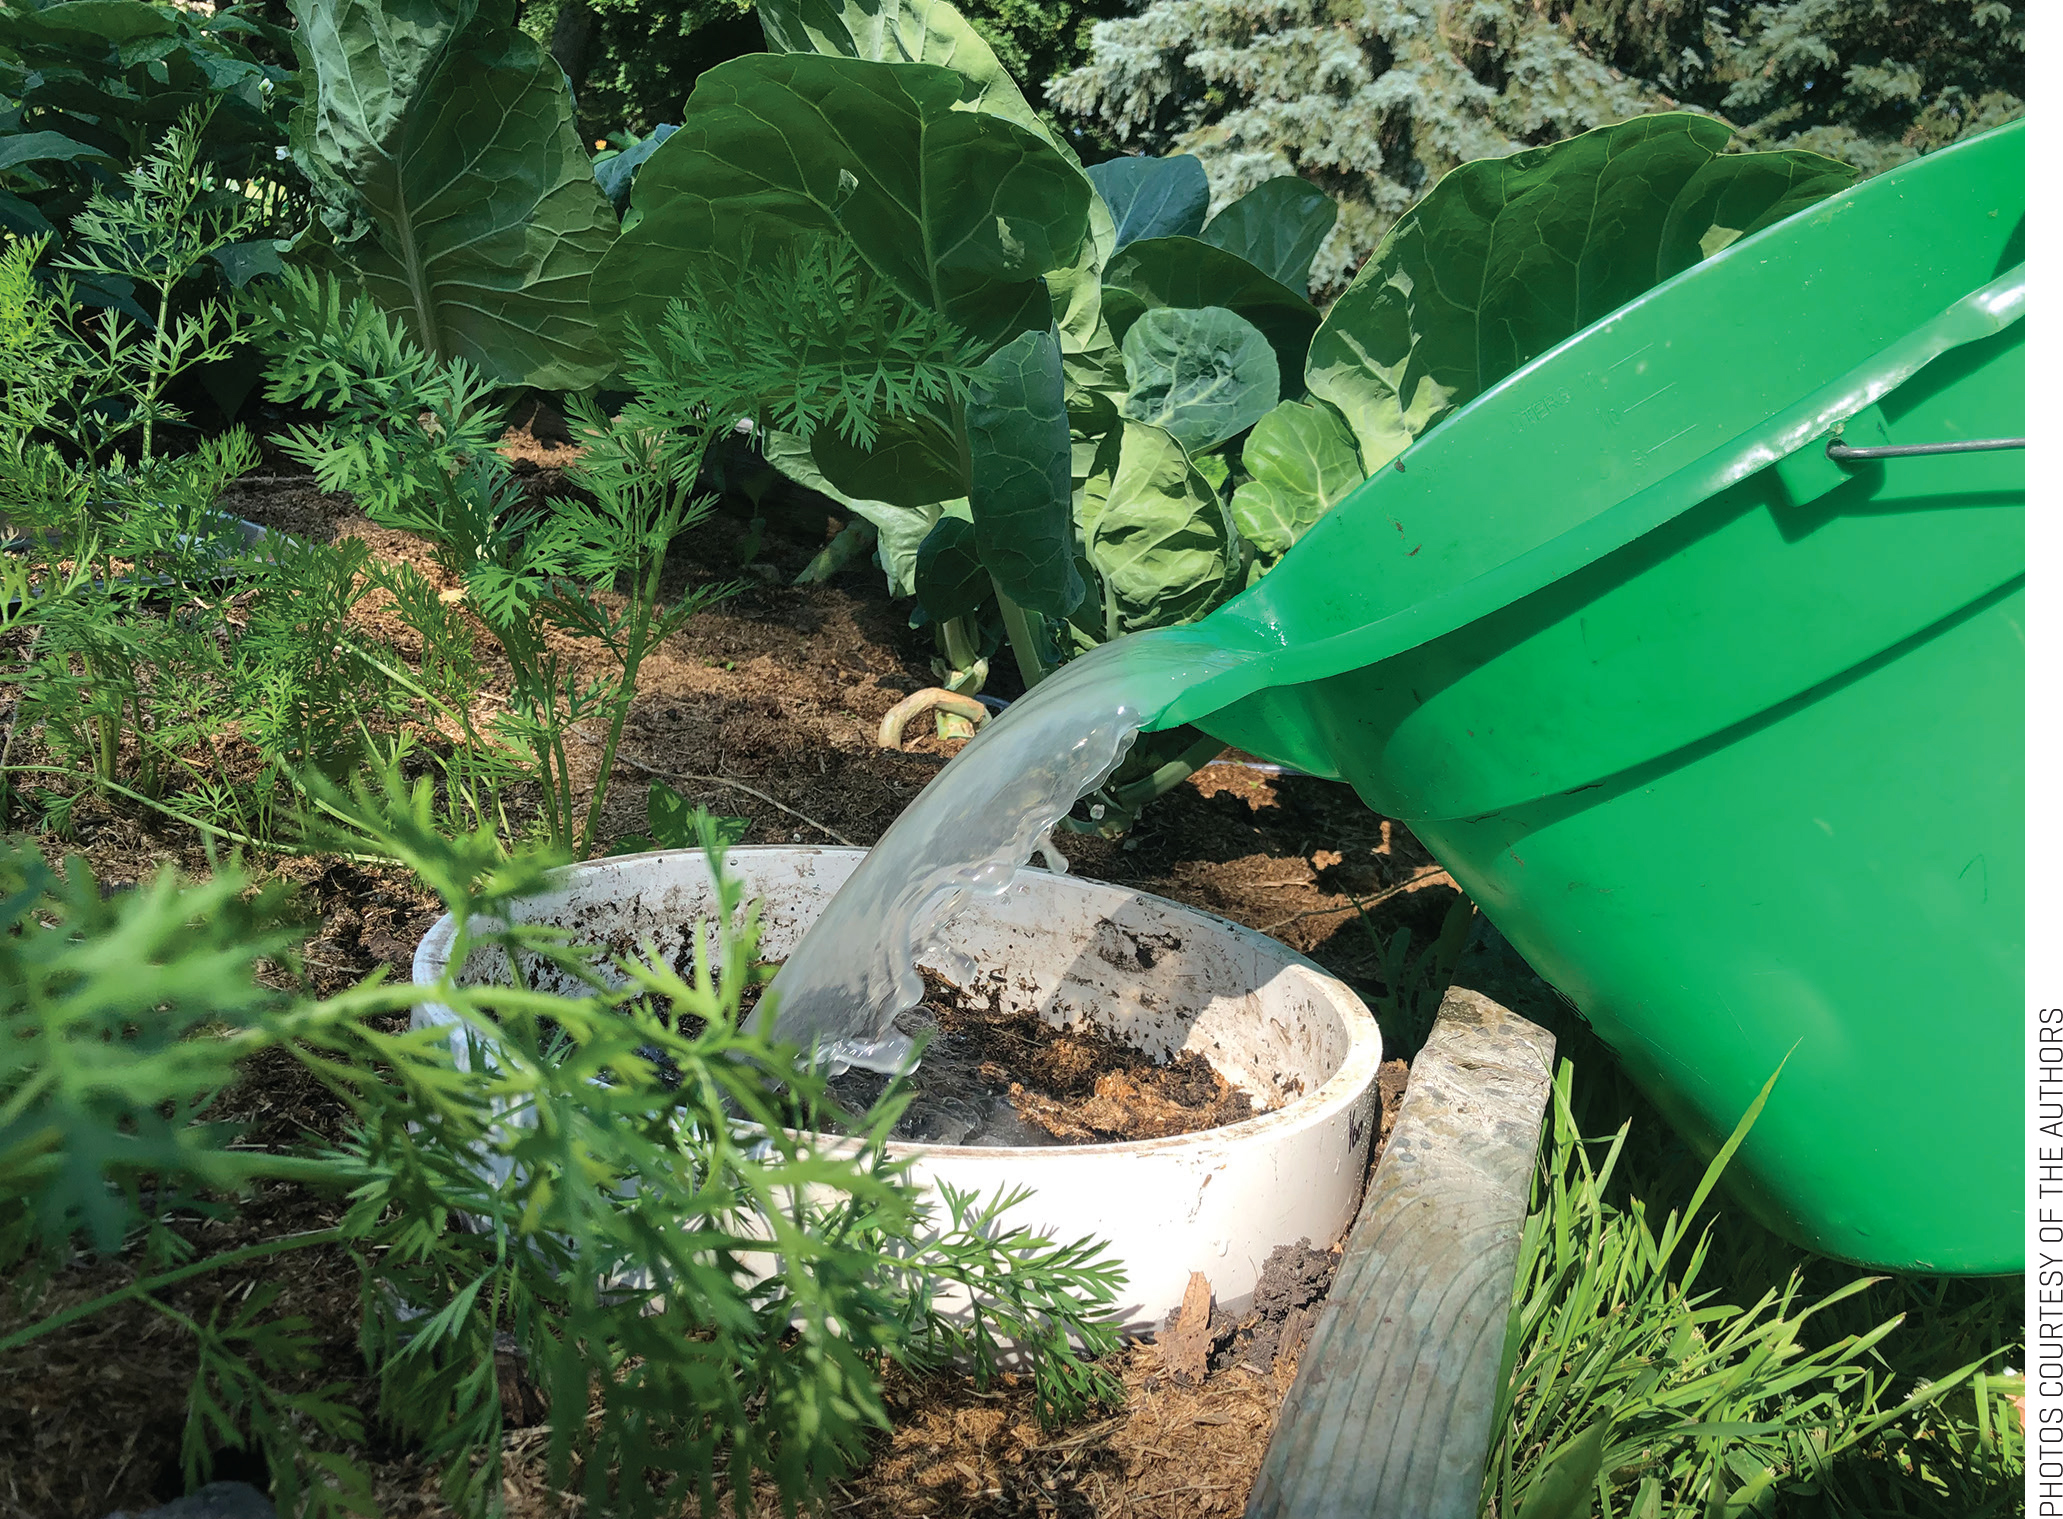
Mustard solution is poured into a sampling quadrat.
Once groups are prepared, you may head out to your testing location. As stated in NSTA’s field trip safety document, please ensure that weather conditions are safe and free of potential storms before proceeding outdoors (NSTA Safety Advisory Board 2015). Additionally, avoid locations that might contain ticks, snakes, poison ivy, or other hazards. Areas with known earthworm populations, such as a school garden, can be a great place to start the investigation. We find that it is best to model the mustard extraction procedure with students in the field to be sure everyone has a firm grasp of the methodology before spreading out. Students circle around as we set up our quadrat in a mostly flat location to avoid runoff. All participants and observers need to wear goggles in the event that the mustard solution splashes. Results are best when the solution is poured in two half-gallon increments to equate to 1 gallon per study location. Earthworms may start coming to the surface immediately, but this process can take a few minutes.
As worms emerge, they should be rinsed in clear, nonchlorinated water. This will remove any remaining mustard and allow them to stay moist while their mass is taken. This is also a great opportunity to remind students that we have set up the quadrat to define our sampling area; if earthworms emerge outside of this area, they will not be considered part of our study. After all of the mustard solution has been poured on the quadrat and earthworms do not appear to be emerging anymore, a biomass should be collected using a battery-operated scale or triple beam balance. Explain to students that the biomass is the total mass of organisms—in this case, earthworms. The earthworms, by nature, are going to be looking to return to the soil. To contain them, it can be helpful use a weigh boat or dish of some type that is clean and contains no soap residual. This container will need to be zeroed on the scale to provide an accurate reading of the organic matter. In an effort to reduce the stress on the worms, students should ensure that worms stay moist throughout this process and work efficiently. If you are finding that the process of collecting the biomass is taking longer than expected, consider wrapping worms in a paper towel moistened with nonchlorinated water. After measurements are taken, worms should be released in the general vicinity in which they were found, avoiding the soil that was dampened by the mustard solution. You will find that they burrow themselves back in the ground quickly.
After you have modeled finding the biomass of the worm sample, students may spread out to collect their own data. You may choose to leave your measurement tool, either a battery-operated scale or triple beam balance, in a central location for students to access. Data should be recorded as a table (see the Earthworm Inquiry Handout in Figure 1). To keep students on track, give groups a time frame to work within as they collect their data. Groups should be able to complete data collection for two study sites in 20 minutes. Before returning inside, remind students that they need to be sure that we are bringing all of our items back inside, without removing artifacts from the local ecosystem (NSTA Safety Advisory Board 2015).
Data analysis
Once groups complete sampling in two locations, they should begin making sense of their data. We like to have students complete data analysis independently and then reconvene as a group to compare their thoughts afterward. This can ensure each student is fully engaged in the process and comes to group work with prepared ideas to share.
Students should first prepare a graph of their data. We like to remind students that their data is categorical in nature, thus a bar graph is the best option. Each student should have a neatly drawn bar graph with a title and appropriately labeled axes.
After students have completed their graph, students will find space to complete a Claim-Evidence-Reasoning (CER) statement. If this is your students’ first CER statement, it can be helpful to read the directions found on the handout as a group. This can reinforce what is expected for each part of the statement. We also like to remind students that their evidence can be both quantitative and qualitative in nature. In addition to including biomass numbers for each location, students can also include qualitative observations. For example, students may suggest that at one location the majority of the biomass was in the form of a few larger worms, and at the other location the biomass consisted of many smaller worms.
Group analysis
After students have reviewed their data and completed their CER, they should reunite with their group. Students should first read their CER statements to their group members. Groups should give feedback on the format of the CER, identifying whether a clear claim, data-driven evidence, and effective reasoning were given. We encourage students to revise their work, based on feedback from their peers, as needed before moving on.
Once each group member has gotten feedback on their work, students should work together to create a short presentation describing their investigation and findings to share with the class. Depending on the technology available to your students, you may choose whether you would like this presentation done using a slideshow, hand-drawn poster, or orally. If completed orally, the graph can be drawn on a piece of printer paper for the class to see and interpret. A rubric is available in the Online Supplemental Materials to guide students’ work in this section. Each presentation should include: the initial question, a hypothesis, a graph depicting the data, and an explanation of the data. If time permits, an additional research component can be included to further students’ application of their data. Students may choose to research published findings on the resource they investigated. For example, if a group were interested in the relationship between soil type and earthworm biomass, they could choose to research types of soils that best support earthworm populations.
Symposium
When groups are prepared, they should present their work to the class. The amount of time required to prepare a presentation depends on how familiar your students are with presenting data to their peers. We find that 20 minutes generally suffices in groups familiar with presentations. Presentations should be roughly three to five minutes in length. To engage audience members, you can have each group pose their initial question and ask for hypotheses from others. This strategy often helps redirect their thoughts back to resource availability as they predict the outcome of each other’s investigations.
To fully address the Disciplinary Core Idea associated with this lesson, we need to make sure that students are making a clear connection between the resource they have chosen and earthworm biomass in their presentations. They should discuss the cause-and-effect relationship between resource availability and abundance of earthworms. For example, a group may say that in areas with moist soil, we see more earthworms than in locations with dry soil because they require a moist environment to respire. Any claim made by students should be supported with their graph.
After students have presented, remind them that each group has only a limited data set; however, when we combine our data we can draw broader conclusions on the impact of resource availability based on the trends we see. It can be helpful to post the graph each group has made at the front of the room. Often, we notice that biomass is greatest in moist, cool locations with more detritus. Here students can make the connection between the availability of resources and earthworm abundance, and more earthworms are found in locations with greater resources.
After synthesizing findings as a group, we frequently use the Point of Most Significance (POMS) framework, which asks students to synthesize findings into one or two concise sentences. In this investigation students synthesize what we have discussed regarding resource availability and generate one to two sentences that summarize our overall findings. A typical student response is “When looking at data across the class, we find greater earthworm biomass in locations with more resources available. We found greater biomass in shaded locations with moist soil and decomposing matter.”
Assessment
Individually, students are given feedback on their Earthworm Inquiry Handout. This feedback can be given with a formative or summative grade attached, but you can also choose to only provide written feedback if students are new to some of these skills. As we review student work, special attention is given to graphing and the CER. Students should have a completed graph with a title and appropriately labeled axes. The CER should reflect the initial question they posed on the front of the handout. In the reasoning, students should include information on resource requirements. An example of student work and feedback can be found in Figure 1.
You can also consider giving students feedback on their symposium presentation as a group. An optional rubric for this presentation can be found in the supplemental materials. When giving students feedback, we pay close attention to the rationale behind what they studied and why they thought this factor may be important. We also look for students to describe the link between a resource and limiting factors in earthworm distribution.
Citizen science connection
If you are interested in taking this activity further, a similar method is used in a number of citizen science projects across the country, including the Great Lakes Worm Watch (see Resources). These studies focus on various aspects of forest ecology—most notably, interspecific relationships and nutrient cycling. The methods used in this activity can easily be modified to contribute to one of these citizen science projects. Often, these projects require students to identify earthworm species, which can vary by region. If you choose to pursue this option, students may require a dichotomous key, which is provided by many of the citizen science projects. In terms of this investigation, you could consider shifting the dependent variable from worm biomass to earthworm biodiversity as a metric to align more closely with a project of your choosing.
Conclusion
Students are often most excited about a lesson when they are able to take ownership over the process. Conducting inquiry-based learning on school grounds allows students not only to have that ownership, but also to learn about an ecosystem they interact with on a daily basis. Through this activity, students are able to consider the impact resource availability has on organisms while also practicing their skills in asking quantifiable questions and executing an investigation from start to finish.
ACKNOWLEDGMENTS
This lesson was created with support in part by a National Science Foundation CAREER award #1651361. We also thank Kat LaBine for supplying materials in the development of the lab protocol.
Lauren Reuss (lreuss@bsmschool.org) is a science teacher at Benilde-Saint Margaret’s School in Saint Louis Park, Minnesota. Gaston Small is an associate professor in the Department of Biology at the University of Saint Thomas in Saint Paul, Minnesota.
Biology Labs Life Science Middle School