
Feature
Planting 3D Instruction in Your Classroom
A Garden-Based NGSS Unit
CONTENT AREA Ecology/Botany
GRADE LEVEL 8
BIG IDEA/UNIT “Why does the world need so many different plants?”
ESSENTIAL PRE-EXISTING KNOWLEDGE
Students should be familiar with the electromagnetic spectrum, scientific practices, and basic microscopy.
TIME REQUIRED
7-8 weeks, can be modified based on number of investigations performed
COST $60
SAFETY Gloves, safety goggles, lab coats, sunscreen, EpiPens for students with severe allergies (see more safety considerations in Online Supplementary Materials)
School gardens are currently sprouting up in both urban and rural districts across the United States. These school gardens have been used to spark conversations about important issues, such as food insecurity, health, and ecological sustainability, and they have been shown to have a positive impact on student interest in life science and well-being (Fisher-Maltese, Fisher, and Ray 2018). Yet for many teachers and school districts, gardens are viewed as an informal learning environment and are not fully incorporated into the core science curriculum. There is much enthusiasm for getting a garden started, but the challenge becomes how to include the garden in a meaningful way to support student learning about science (see information on growing a school garden in Online Supplementary Materials). We followed an instructional framework called Next Generation Science Storylines (NGSS storylines; Reiser 2017) to develop a gardening unit that moves toward 3D instruction (Krajcik 2015) for middle school about system biology. NGSS storylines allow teachers to weave together multiple investigations into a larger, more coherent narrative. Each NGSS storyline unit begins with students experiencing an anchor phenomenon. Students’ questions about the phenomenon drive the investigations (investigations we developed based on questions we predicted the phenomenon would elicit from students). Students engage in scientific practices to develop and/or use disciplinary core ideas and crosscutting concepts (NGSS Lead States 2013).
In our unit, we utilized the school garden as an anchoring phenomenon for student-driven investigations (see Figure 1). Our overall focus in this unit was to address how plants are essential for ecosystem vitality through the lens of the student-generated driving question, “Why does the world need so many different plants?” We designed this unit for eighth-grade students at a midwestern school district.
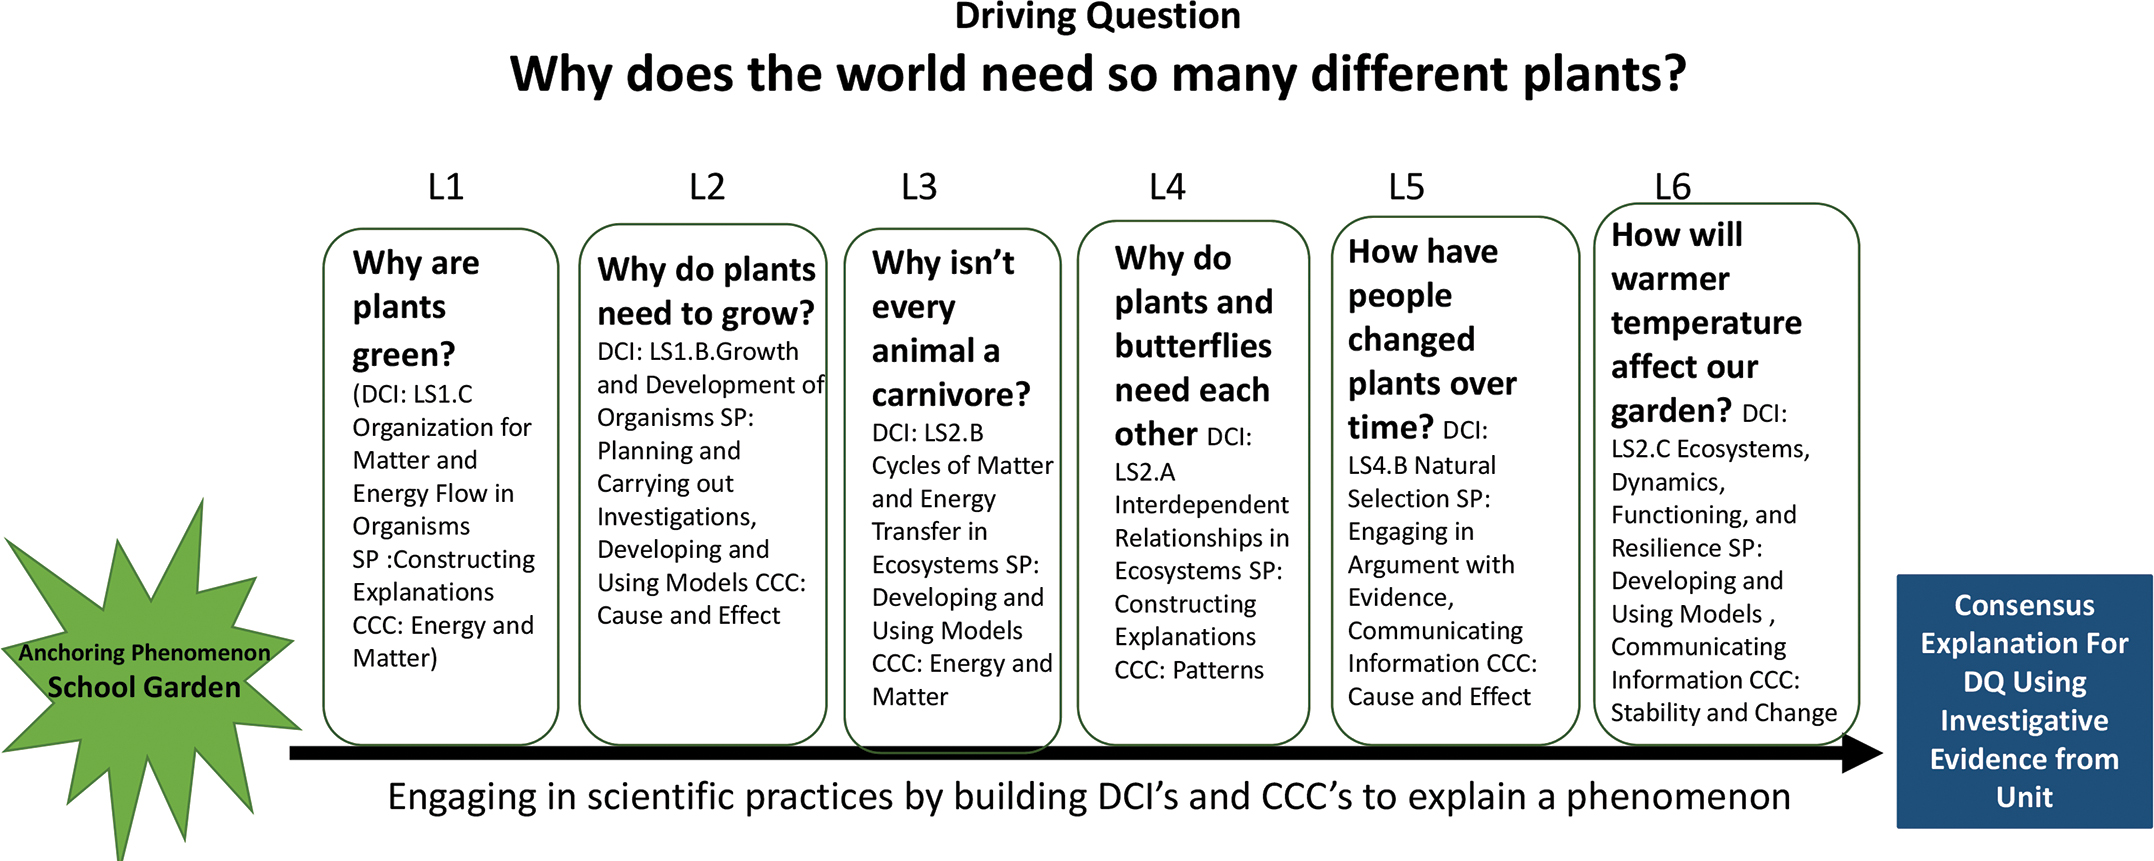
School garden unit investigation
Exploring the phenomenon of a school garden
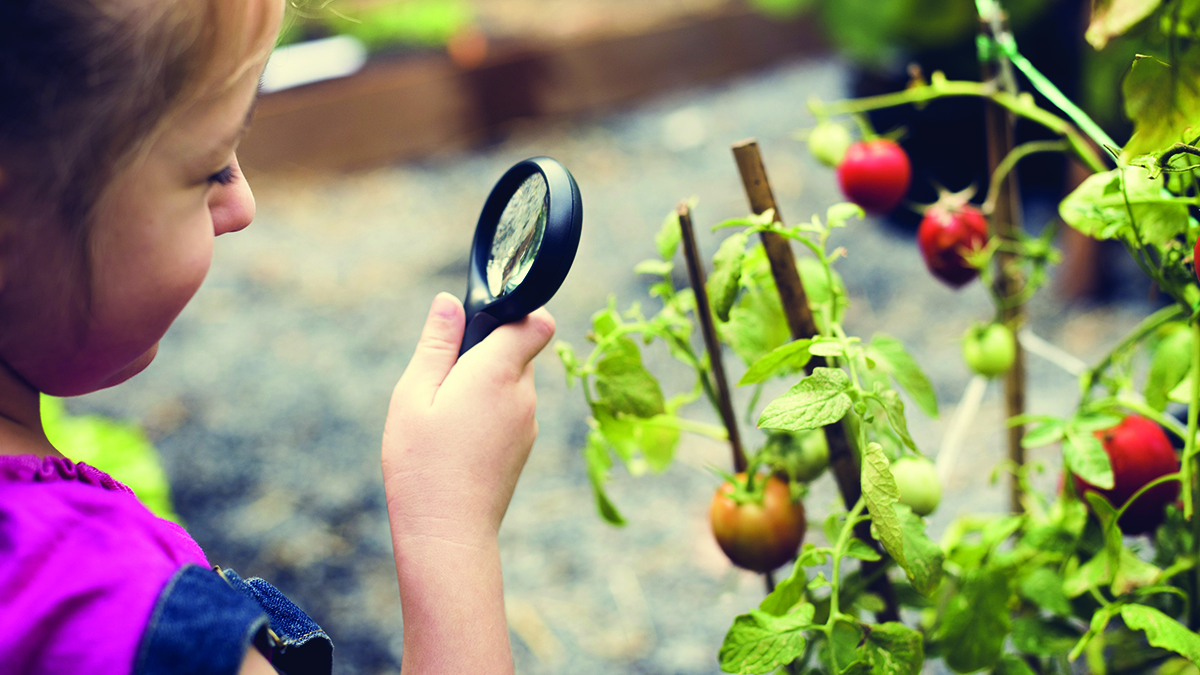
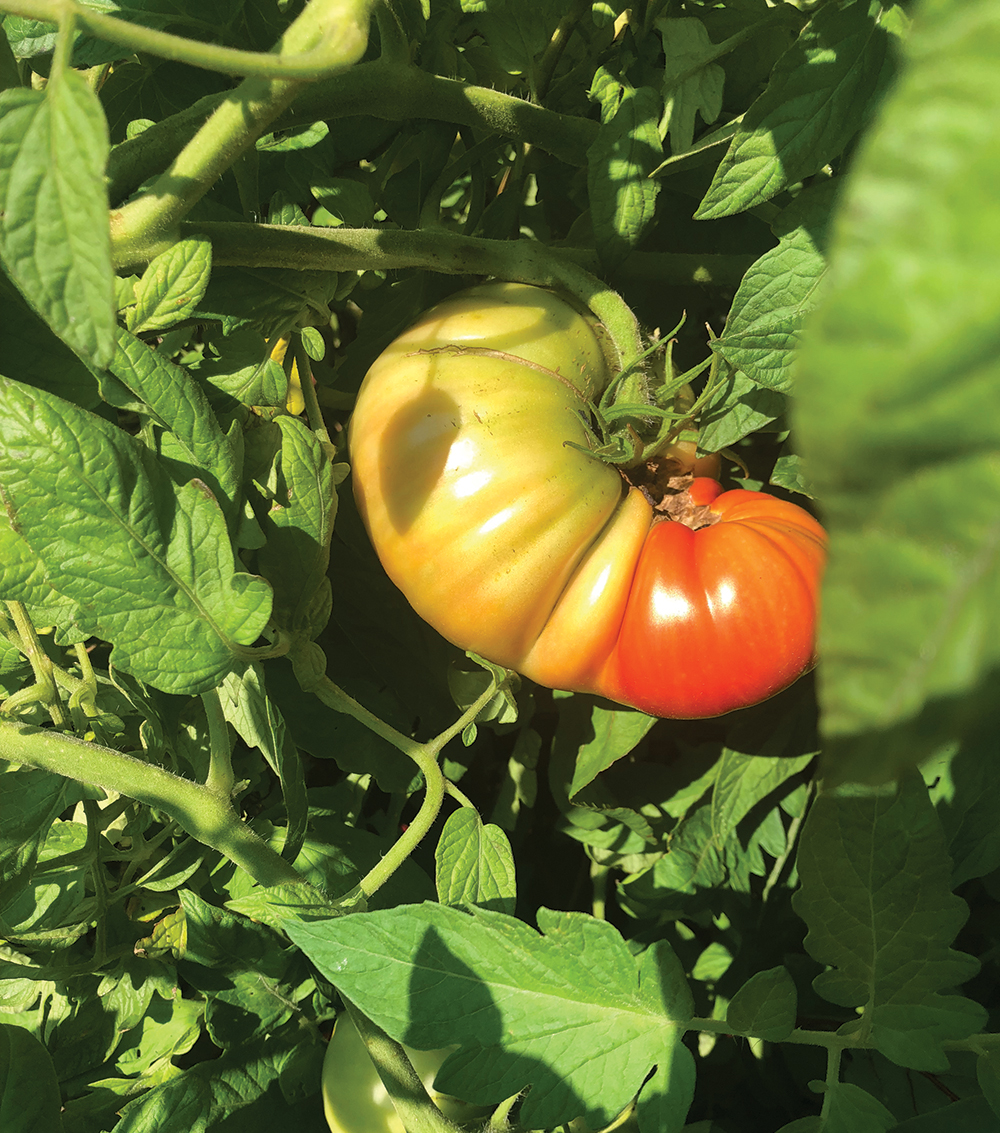
The opening lesson of this unit began with students interacting with a school garden. Our garden contained a mixture of local midwestern plants such as sunflowers (Helianthus annus) and milkweed (Asclepias syriaca); new-world crop plants such as tomatoes (Solanum lycopersicum) and peppers (Capsicum species); and old-world domesticated crops such as lettuce (Lactuca sativa), carrots (Daucus carota), beets (Beta vulgaris), and cucumbers (Cucumis sativus). Before we left our classroom, we discussed a few ground rules for our time in the garden. We encouraged students to look at different plants and animals but never touch them, and we informed them about local harmful insects, such as honey bees (Apis mellifera) and eastern yellow jackets (Vespula maculifrons). Additionally, we made accommodations for sun-sensitive students (letting them use sunscreen), for students with allergies (bringing EpiPens, avoiding honey bee and/or ragweed habitat), and for students with physical disabilities (having a section of the garden closer to the wheelchair-accessible sidewalk and bringing specific plants such as milkweed pods and vegetable produce directly to them for a closer observation). A walk to the garden provides an opportunity to set up the mystique of the phenomenon. We allowed students to make observations freely for about 15 minutes. Students noticed sunflowers bending toward the sunlight, tomatoes and peppers changing from green to red, swallowtail caterpillars (Protographium marcellus) feeding on carrot leaves, and a large 8 cm tall praying mantis (Mantis religiosa) hiding on a leaf. While making observations, students were encouraged to write one or two questions on sticky notes about what was happening in the garden. We allowed students who needed additional time to work on their questions when we returned to the classroom.
Tomato plant (photo courtesy of the author).
Student-generated questions
After spending time in the garden and generating questions, the students returned to the classroom and placed questions on a Driving Question Board at the front of the room. For more information about how to develop and use a Driving Question Board, see Touitou et al. (2018); also see Resources. These student-generated questions allowed us to gauge student interest and influenced the direction of the unit. Our students generated a wide variety of questions, reflecting their diverse interests, experiences, and prior knowledge of science ideas. Most questions fell into one of two categories: experimental questions and abstract/big picture questions.
Experimental questions are questions that are straightforward enough to be tested, yet broad enough to be meaningful to the class. Examples of testable experimental questions are “How much water do the different plants need?” and “How often do deer or other animals ever get into the garden?” Examples of abstract/big picture questions are “What are the benefits of having a garden at school?” and “What are the benefits of the plants you can’t eat?” Although these abstract questions could not be directly tested, they served as inspiration for a unifying driving question for this unit.

Monarch butterfly (photo courtesy of the author).
Once the students had the opportunity to read and reflect on the questions generated by their peers, they began brainstorming a unifying driving question that synthesized different aspects of their individual questions. During the brainstorming session and throughout the unit as a whole, our students worked in predetermined small groups of four to six individuals of varying skill levels to better facilitate discourse and differentiation, and each student was encouraged to contribute their unique talents to the group. The driving question our students came up with was, “Why does the world need so many different plants?” With this driving question in place, students began planning and implementing investigations to address specific experimental questions that fell under the umbrella of their broader driving question. Although we had a general blueprint of which topics we needed to address, we used student input to customize the framing and direction of each investigation to meet their needs. The scientific practices and disciplinary core ideas in each student-driven investigation were designed to build on each other and be referenced in later investigations to form a coherent unit (see Figure 1). Rather than using traditional paper-and-pencil assessments, we used the artifacts the students produced during each investigation, such as their written explanations and models, as formative and cumulative assessments. We describe two of these student-driven investigations next in detail, along with four additional investigations.
“Why are plants green?”
This investigation began by examining student questions about the color of plants in the garden; we used a guiding question, “Why are plants green?” Prior to this unit, we asked students about photosynthesis to gain insight on their pre-existing knowledge. Although most students had heard of photosynthesis and a few said, “That’s how plants make air for us to breathe,” none of our students described photosynthesis as a process for transforming solar energy into chemical energy (sugars). Students worked in their small groups to gather their initial thoughts about why plants might be green. Next, students discussed their ideas as a class and developed an initial consensus explanation (Reiser, Berland, and Kenyon 2012) followed by students gathering evidence through investigations. These initial explanations served as a preliminary assessment of student conceptual understanding (Assessment 1; see the Evidence-Based Preliminary Explanation Worksheet). After each investigation in this unit, we had students incorporate additional evidence into their explanations, with each revision serving as a formative assessment, providing students with feedback on their ability to form cohesive explanations as well as their understanding of the science content.
The first investigation addressed the differences between photosynthetic cells (plants and Euglena) and nonphotosynthetic cells. This activity was geared toward introducing students to chloroplasts as a defining feature of plants and other photoautotrophs. Students were divided into pairs based on our seating chart and given several different microscope slides to examine. Immediately before this investigation, we reminded our students about the importance of microscope etiquette and safety. These slides included photosynthetic organisms such as Euglena (a photosynthetic protist) and plant leaves as well as nonphotosynthetic organisms such as mammalian cells and Paramecium (a nonphotosynthetic protist). We did not use stained slides so that students could observe the natural colors of organelles. As our students were working in pairs, we assisted those who needed help with focusing their microscopes. If you have a limited number of microscopes or your students are not proficient in microscopy, you can focus one slide at each microscope as a station and have your students move from station to station. Our students first focused the slides at 400× magnification and then drew and described their observations in an evidence notebook; the observations that students recorded in this notebook throughout this unit were used as evidence to help them support their revised explanations. One piece of evidence our students found useful in this investigation was that the photosynthetic cells contained green organelles (chloroplasts) that are not found in the nonphotosynthetic cells. The next day, we introduced our students to the scientific name of those green organelles (chloroplasts) and encouraged them to speculate on their function and why they are not found in all the cells they observed. They wrote down their hypotheses in their laboratory notebooks so that they could refer back to them later.
In the next investigation, which focused on the physiological role of chloroplasts, students observed and drew a variegated leaf from a coleus plant (Plectranthus scutellarioides); we made sure they noticed the patterns in the leaf’s color and understood that the green regions corresponded to chloroplasts. Before letting the students work with ethanol and potassium iodide, we explained the safety hazards associated with both chemicals (ethanol is flammable; potassium iodide is hazardous if swallowed) and had students wear a lab coat, gloves, and chemical splash safety goggles. It is possible to perform this investigation as a teacher-led demonstration to further minimize safety risks (see Online Supplementary Materials for safety considerations). After the students drew the leaf, they placed the leaf in a bath of 90% ethanol for 1 minute to remove both the green and red pigmentation. After 1 minute of decolorization, the students disposed of the ethanol/pigment residue and rinsed the decolorized leaf with tap water. Next, they transferred the decolorized leaf to a separate container and added 5 ml of potassium iodide to the leaf. We explained to the students that when potassium iodide binds to starch, it creates a purple residue. After having the leaf soak in potassium iodide for 1 minute, the students poured the excess potassium iodide into a chemical waste container and transferred the stained leaf to a dry paper towel. Our students then sketched the potassium iodide stained leaf and compared it to their initial drawings. Our students saw a correlation between the green areas of the unstained leaf (the chloroplast-rich areas) and the purple areas of the stained leaf (the starch-rich areas). This sparked additional discussion about the nature of chloroplasts and how they might benefit a plant. Some students hypothesized that the chloroplasts were consuming the starch that was stored in the leaves. To shift the conversation toward the canonical understanding of chloroplasts, we encouraged other students to offer counterevidence. One of the most powerful pieces of counterevidence was the observation that “potatoes are full of starch but they are completely white.” This counterevidence helped to redirect student thinking toward viewing chloroplasts as the source of the starch in plants. After our postlab discussion, we had them read an additional handout that confirmed that chloroplasts convert solar energy (sunlight) into chemical energy (sugar) while absorbing carbon dioxide and releasing oxygen as a by-product.
The final investigation examined the relationship between the color (or wavelength) of light a plant is exposed to and the efficiency of photosynthesis. Prior to this investigation, students should be familiar with the electromagnetic spectrum and understand that each color represents a different wavelength of light. Before class, we set up three LED lights of different colors (blue, green, and red). We then placed a beaker of cold water 5 cm from each light as a heat sink. The cold water absorbs excess heat from the LED lights, protecting the elodea sprig from unnecessary heat stress (see Figure 2). At the beginning of class, we filled a 10 ml test tube with 7 ml of a 0.5% baking soda solution (our carbon source) and an elodea (Elodea canadensis) sprig and placed the tube about 25 cm from each heat sink. Baking soda can be a skin irritant so wear gloves when handling the solution. Soon after the elodea sprig was placed in the test tube (1 to 2 minutes), its leaves began producing visible bubbles of oxygen. It is important that students begin counting bubbles sooner rather than later, as the elodea sprig will gradually use up its carbon source over the course of the class period. If the students fail to see bubbles at the red and blue conditions, feel free to add more baking soda to each test tube to replenish the carbon source. Because oxygen is a by-product of photosynthesis, these oxygen bubbles can be used as an indicator of the rate of photosynthesis at each experimental condition. Our students counted the number of bubbles that emerged from the elodea leaves over a 7- to 8-minute period and recorded their results in a data table. The students were then able to determine which wavelengths of light were most/least efficient for photosynthesis based on the number of oxygen bubbles produced at each experimental condition.
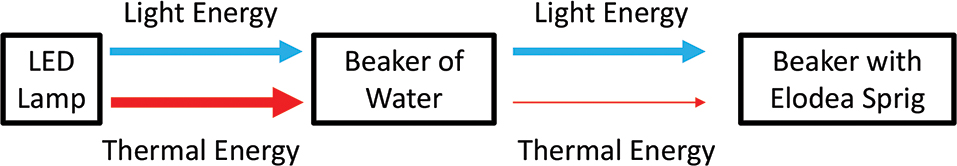
Diagram of photosynthesis experimental layout.
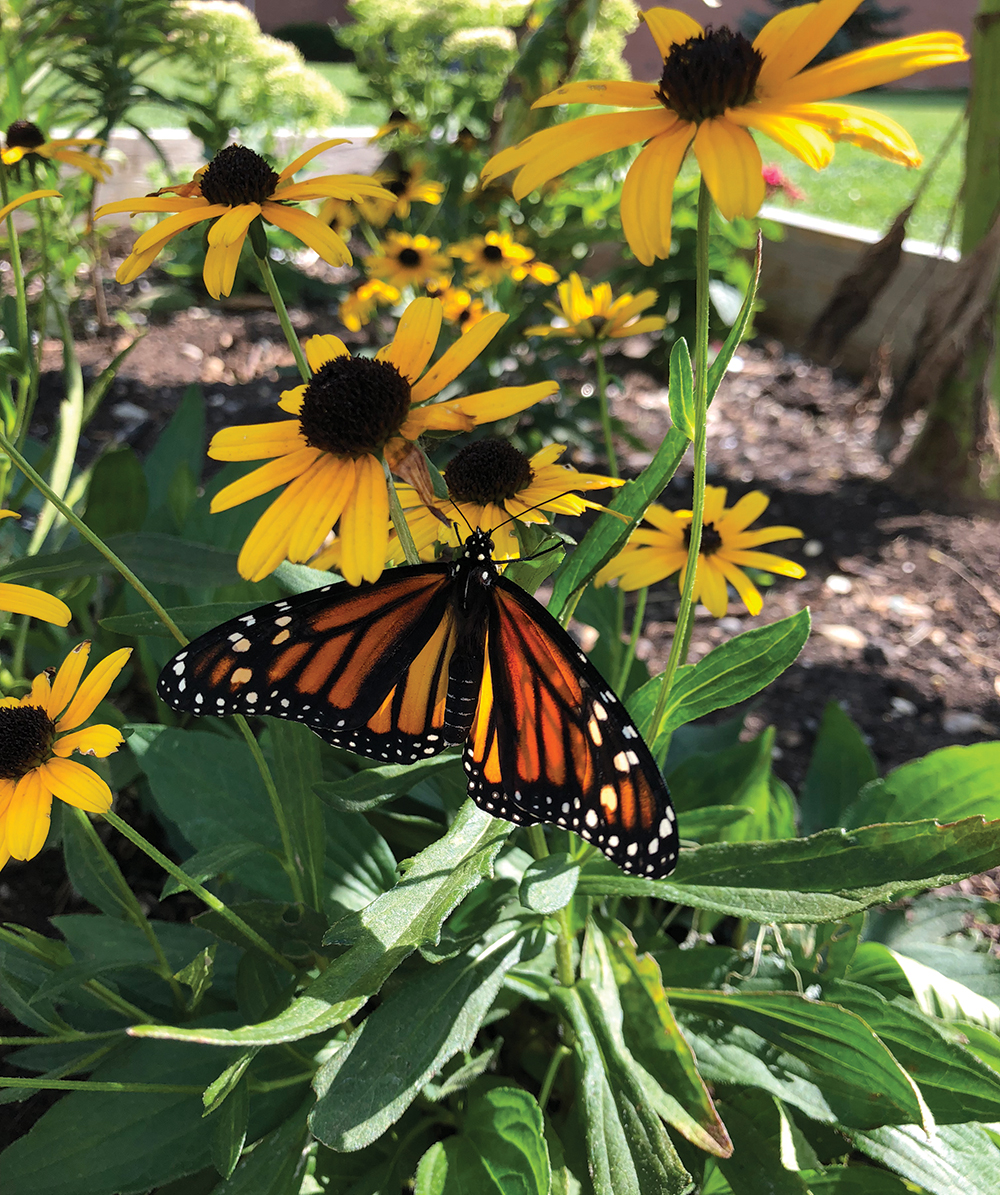
Monarch butterfly (photo courtesy of the author).
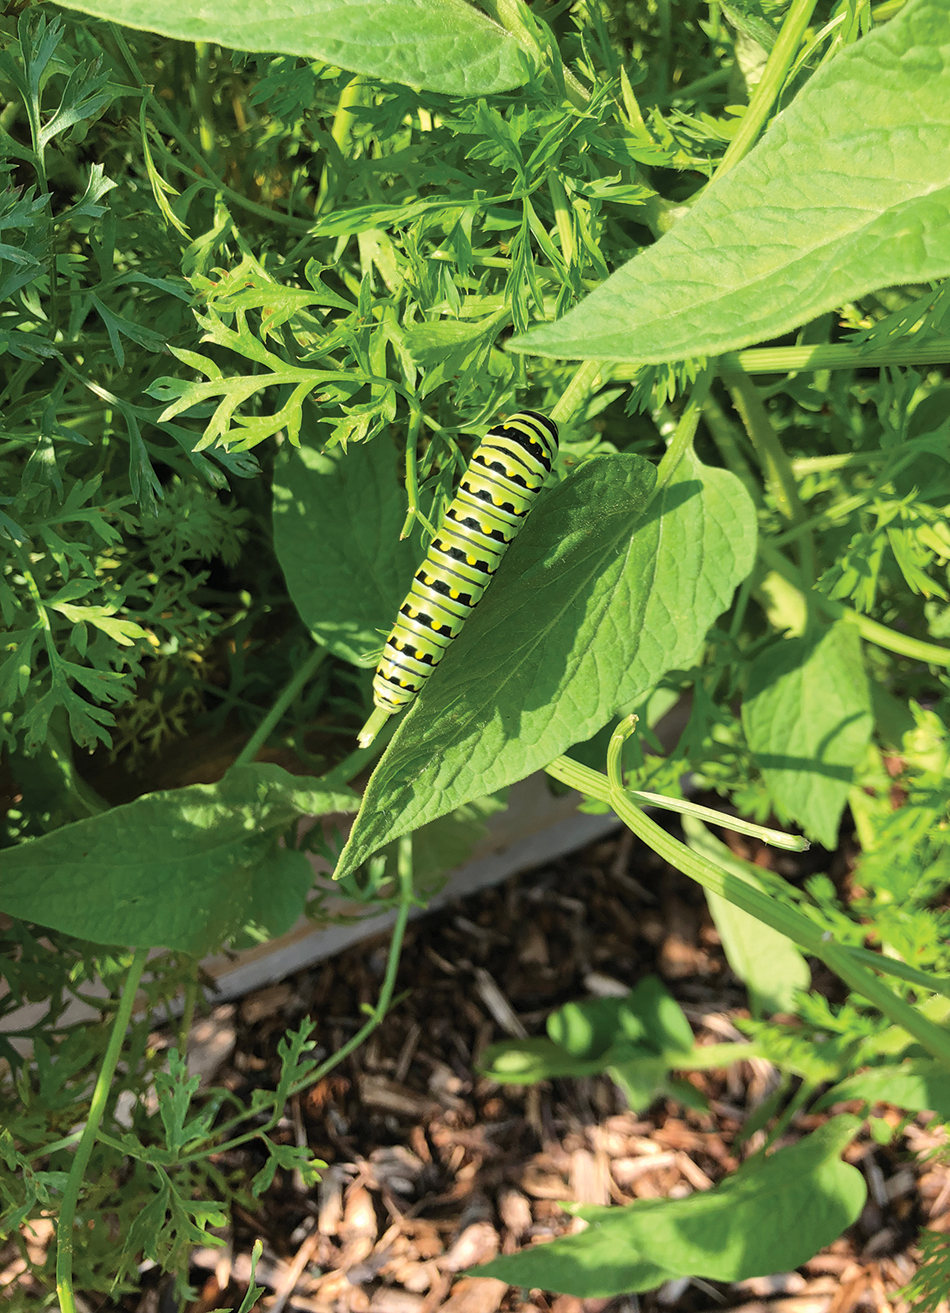
Caterpillar (photo courtesy of the author).
| Population Chart for Isle Royale, Michigan, Taiga Biome (2,000 Population, 200 square miles, sample student answers in red) | ||||||||||||||||||||||||||||||||||||||||||||||||||||||||||||||||||||||||||||||||||||||||||||||||||||||
|---|---|---|---|---|---|---|---|---|---|---|---|---|---|---|---|---|---|---|---|---|---|---|---|---|---|---|---|---|---|---|---|---|---|---|---|---|---|---|---|---|---|---|---|---|---|---|---|---|---|---|---|---|---|---|---|---|---|---|---|---|---|---|---|---|---|---|---|---|---|---|---|---|---|---|---|---|---|---|---|---|---|---|---|---|---|---|---|---|---|---|---|---|---|---|---|---|---|---|---|---|---|---|
|
| Population Chart for Isle Royale | ||||||||||||||||||||||||
|---|---|---|---|---|---|---|---|---|---|---|---|---|---|---|---|---|---|---|---|---|---|---|---|---|
|
After the students gathered evidence from these investigations, they engaged in the scientific practice of creating an evidence-based explanation to address the guiding question, “Why are plants green?” (Reiser, Berland, and Kenyon 2012). First, the students drafted individual explanations based on the evidence they collected in their notebooks. These individual explanations served as a summative assessment for our students. Then after reminding our students of our accountable talk strategies, we had them work in their groups to synthesize their individual explanations into a group-consensus explanation. For these sorts of group discussions, we often have assigned roles (which rotate from week to week) such as “notetaker,” “group ambassador,” and “consensus builder.” The group discussions naturally flowed into a whole-class discussion, where each group’s designated ambassador shared their group’s ideas to the class. For example, one group of students shared that based on their observations from the coleus leaf experiment, they were able to claim that “the green organelles in plants allow them to produce sugar.” Ultimately, our class reached a consensus explanation that “plants are green because they contain chlorophyll. The chlorophyll absorbs energy from blue and red light and that energy is used in the process of photosynthesis.” This intersects with an element of the crosscutting concept Energy and Matter—the transfer of energy can be tracked as energy flows through a designed or natural system.
Evidence-Based Explanation Worksheet
Scientific question (the question we are trying to answer): Why are plants green?
Claim (a statement that addresses the question; should be testable): Plants are green because green looks good to plant-eating animals. The green color lets these animals know that these plants are safe to eat.
Evidence (observations that support your claim; state at least two): Many poisonous plants are red or other bright colors. Animals often use bright colors to show that they are poisonous. Poison dart frogs are brightly colored, which tells other animals to stay away from them.
Reasoning (statement connecting your evidence and claim): Many animals have come to view red, orange, and yellow as “danger colors.” Plants also use these danger colors to let animals know that they are not safe to eat. However, some plants want to be eaten so that they can spread their seeds. These green plants look tastier (and safer) to plant eating animals. These green plants get eaten and spread their seeds farther than plants that have “danger colors.”
Evidence-based explanation (several sentences that tie your claim, evidence, and reasoning together): In nature, bright colors are often seen as “danger colors.” Many poisonous animals use bright colors to show predators that they are not safe to eat. Poison dart frogs use red, blue, and yellow to show predators that they are not safe to eat. Plants also use these same colors to show that they are poisonous. Those red berries in the woods use their red color to show that they are not safe to eat. But not every plant is unsafe to eat. Some plants want to be eaten so that they can spread their seeds to other places. These plants use the color green to show that they are safe to eat. These green plants look tasty to animals, get eaten, and spread their seeds farther than plants that have “danger colors.”
Revised evidence-based explanation: Today we are using the evidence we have been collecting from our various experiments to answer our scientific question: “Why are plants green?” We will use our evidence to write a comprehensive evidence-based explanation that includes: Claim, Evidence, and Reasoning. You will begin by listing any relevant evidence from our experiments, readings, and classroom discussions. Make sure you state the source of the evidence (where it comes from). List at least five pieces of evidence.
Evidence: 1.When we looked at plant cells under the microscope, we saw green organelles that were not found in the animal or paramecium cells we looked at. We later learned that these green organelles are called chloroplasts and have a green pigment (chlorophyll) and are only found in plant cells and in Euglena. Source: microscope lab. 2.In the staining lab, we used ethanol to remove the green color from the plant leaves and stained the plants with a purple stain. This purple stain turns sugars purple. As the purple part of the leaf was the same as the green part of the leaf, we think the green part of the leaf makes sugar. Source: staining lab. 3.In class we talked about how the green organelles (chloroplasts) help a plant do photosynthesis. In photosynthesis, a plant takes carbon and water to make sugar and oxygen. This oxygen allows us to breathe and this sugar allows plants to grow and makes plants tasty for animals. Source: class discussion. 4.During the colored light lab, we put different plants up to different colors of light to see how many bubbles they made. These oxygen bubbles were made by photosynthesis. The more bubbles, the more photosynthesis. The red and blue lights made a lot of bubbles. The green light didn’t make many bubbles. Source: colored light lab. 5.After the colored light lab, we talked about what makes us see color. We learned that colors are made when light is reflected. Red things (like apples) reflect red light, green things reflect green light. Plants reflect green light. Source: class discussion.
After listing your evidence, state your revised claim.
Claim: Plants are green to allow them to do photosynthesis better.
Use your evidence and reasoning to support your claim by writing an evidence-based explanation. Be sure you use at least three pieces of evidence in your explanation. Be as scientifically accurate as possible.
Evidence-based explanation: Plants are green to allow them to do photosynthesis better. Photosynthesis is the process of using light energy to turn carbon and water into sugar and oxygen. We need photosynthesis to provide energy for them to grow and food for us to eat and air for us to breathe. In the microscope experiment, we saw that both plants and Euglena (two things that do photosynthesis) have green organelles called chloroplasts filled with a green pigment called chlorophyll. We learned that this green organelle is where plants do photosynthesis in the staining experiment. We stained the leaf purple to see where the sugar was. As the sugar was in the same spot as the green of the leaf, the green area (where the chloroplasts are) is where plants turn sun energy into food energy (sugar). Both experiments tell us that the green part of a plant is where plants do photosynthesis, but they do not tell us how being green helps chloroplasts do photosynthesis. In our last experiment (with the colored lights), we learned why being green helps plants do photosynthesis better. When plants were under red or blue light, they were able to absorb more light energy, helping them do photosynthesis better and produce more oxygen bubbles. However, when plants were under green light, they did not absorb the light energy and did not produce very many oxygen bubbles. Plants need to absorb as much light energy as possible to grow and so we have enough food to eat. Plants have adapted to absorb both red light and blue light because they are at opposite sides of the light spectrum. Because plants absorb the red and blue light (the ends of the light spectrum), they must reflect green light (middle wavelengths). Because plants have adapted to use both red and blue light but reflect green light to do photosynthesis better, they appear to be green to us.
“Why isn’t every animal a carnivore?”
Many of our students asked questions related to organism interaction and food webs, such as “What do praying mantises eat?” and “Why do caterpillars eat certain plants?” Taking the disciplinary core idea of cycles of matter and energy transfer in ecosystems (MS-LS2-B) into account as well as common student misconceptions, we came up with a guiding question of “Why isn’t every animal a carnivore?” to examine how energy is lost at each trophic level of a food web. At the beginning of this investigation, we asked the students to think about how energy moves through an ecosystem. After giving students a few minutes to gather their initial thoughts and share their ideas within their small groups, they were tasked with creating a preliminary model of the food web surrounding the classroom garden to serve as a formative assessment (Kenyon, Schwarz, and Hug 2008). We told students to draw arrows to show the flow of energy within the ecosystem (see Figure 3). We used student initial models and subsequent revisions to assess their understanding of the disciplinary core idea (Assessment 2).
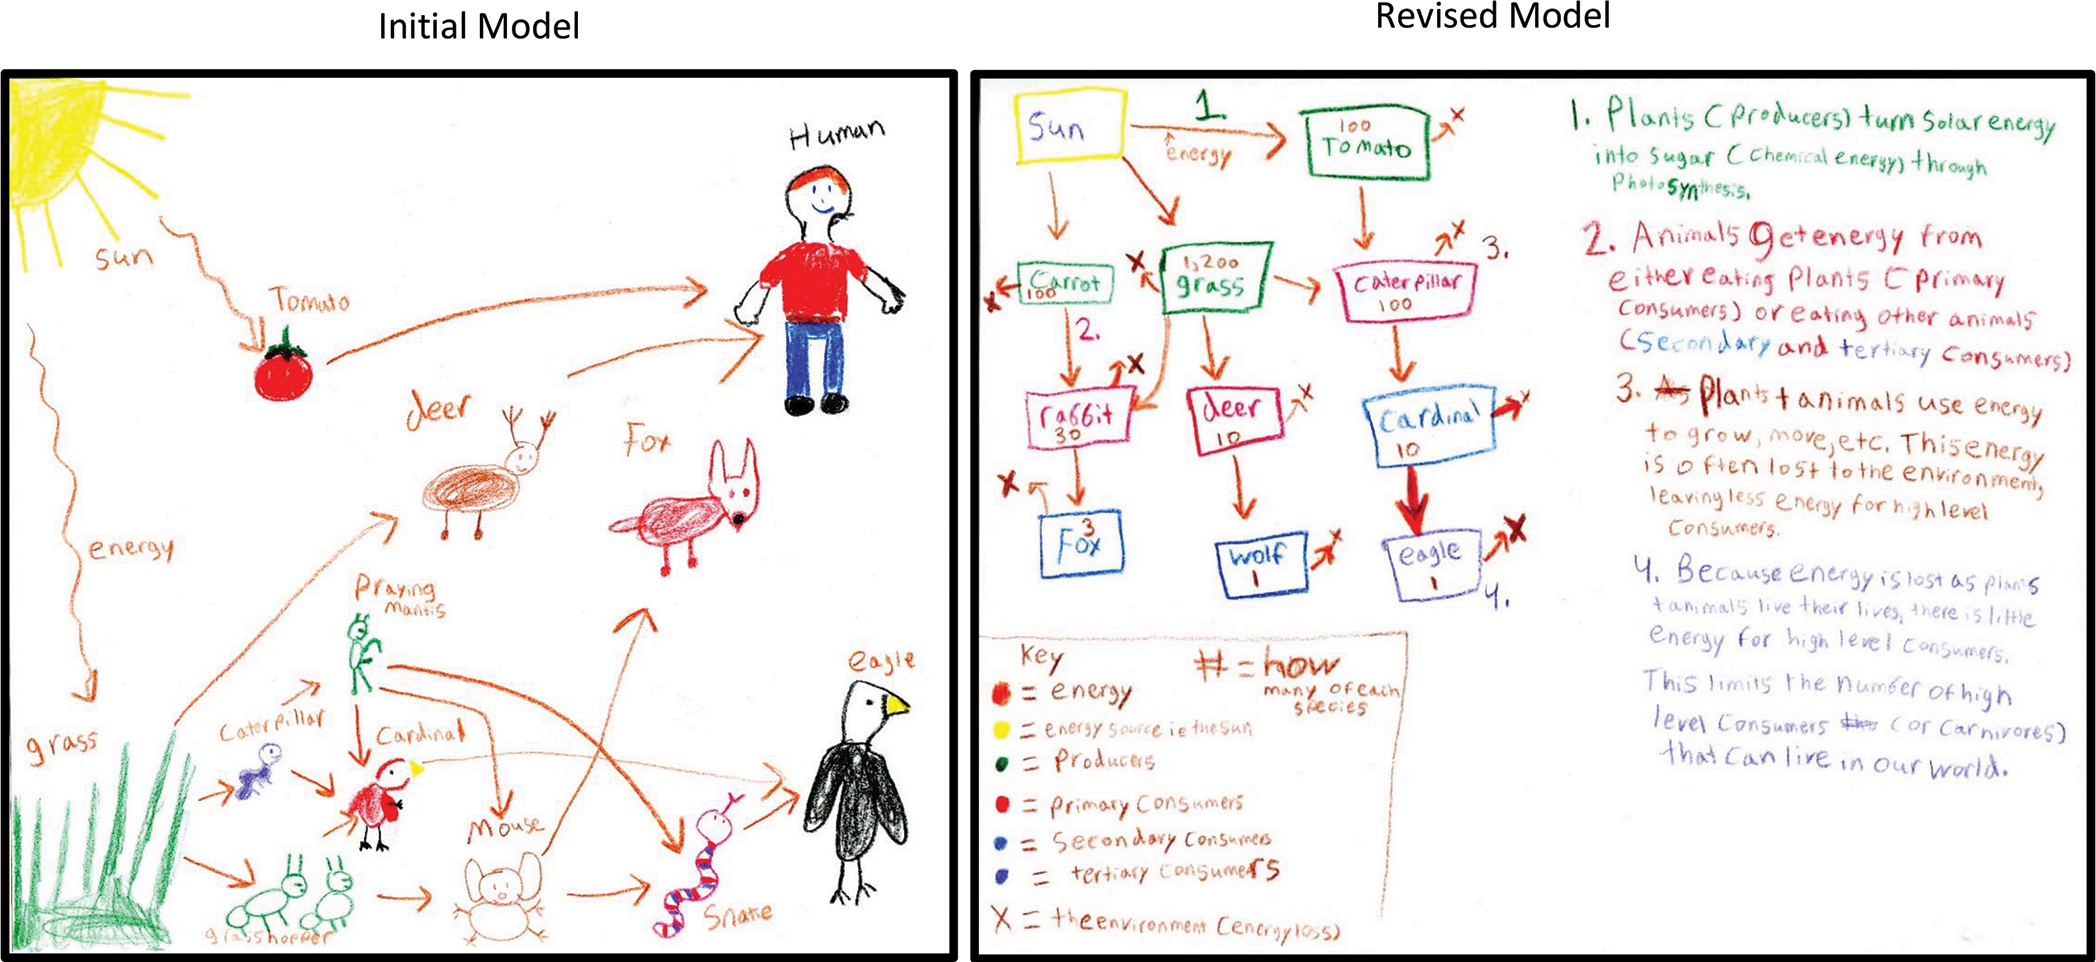
Student food web models (initial and revised).
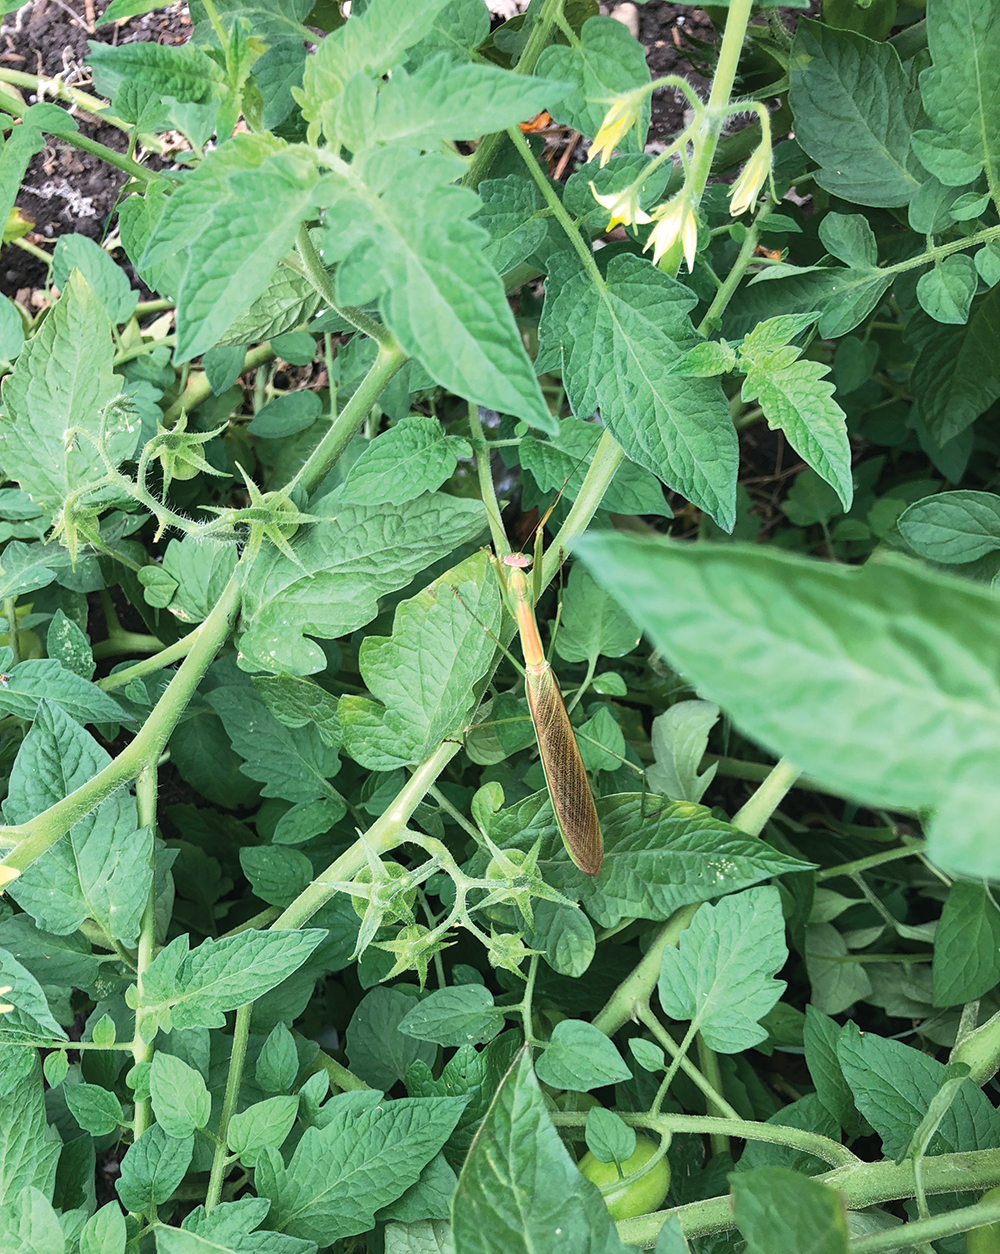
Praying mantis (photo courtesy of the author).
After finishing their initial models, the students returned to the garden to gather evidence. We reviewed garden safety and etiquette, once again making accommodations for students with insect allergies, ragweed allergies, and sun sensitivity. The students recorded in individual notebooks which species were present in and around the garden. We encouraged students to use common names for organisms they were familiar with and to give additional descriptions for those they were less familiar with. For example, one student saw what turned out to be a house finch in the garden and wrote “black and white striped bird with reddish belly and reddish head.” After the students surveyed the garden environment, we had the students write down the common names for the species they observed on a large whiteboard. Students who saw organisms they were unfamiliar with shared their observation descriptions with their group members and then with the class to see if other students had identified a similar organism. Once all of the organisms were on the whiteboard, each group was tasked with labeling the organisms as a carnivore, an omnivore, or a herbivore. Each group ambassador shared their ideas with the class, and we engaged in a broader discussion about what constitutes an omnivore and how each species might fit within a food web. The students quickly realized that there are significantly fewer carnivores than herbivores in the garden (with upper level carnivores being almost exclusively birds of prey).
In the next part of the investigation, students worked in small groups to engage in the practice of data analysis by examining data tables of species abundance from various ecosystems (Assessment 3; see Population Chart for Isle Royale, Michigan; see also Online Supplementary Materials for follow-up questions for the Population Chart). These data tables were created by us and were loosely based off Fish and Wildlife data. Our data tables listed the species, its population size, and its body mass as well as whether it is a primary, secondary, or tertiary consumer. The students then engaged in the practice of mathematical reasoning by calculating which percentage (by biomass) of each ecosystem is made up of primary, secondary, or tertiary consumers. We provided our students with a basic equation (Species biomass = population size of organism * average body mass of an organism) to help them calculate the relative abundance of primary, secondary, and tertiary consumers in an ecosystem. Our students recognized that there was a significant drop in the abundance of each organism (as determined by species biomass) as they moved up the food chain. We then had students discuss why there were fewer carnivores than herbivores in each ecosystem and where the energy was being lost. Working in their small groups, the students revised their initial models to incorporate their new understanding about how energy travels through food webs (Figure 3). These revised models, serving as summative assessments, focused less on artistic representations of individual organisms and more on their mechanistic understanding of food webs (see model rubrics in Online Supplementary Materials). The class demonstrated their understanding of the disciplinary core ideas of cycles of matter and energy transfer in ecosystems (MS-LS2-3) by emphasizing that an accurate model of a food web must demonstrate the loss of energy at each level of the food chain and that this loss of energy limits the number of carnivores and tertiary consumers. Examining the loss of energy at each stage in the food web connects the disciplinary core idea of cycles of matter and energy transfer in ecosystems (MS-LS2-3) with the crosscutting concept of energy and matter and can serve as a foundation for a cross-disciplinary discussion on entropy during high school.
Wrap-up
Our unit continued with four additional investigations that are briefly referenced in Figure 1 (see also summary of garden unit in Online Supplementary Materials). Between each investigation, we discussed how knowledge gained from previous investigations applied to our most recent investigation as well as the driving question. These discussions helped us weave otherwise disparate activities into a cohesive unit. Once our final investigation was finished, we had our students write up the evidence we had collected throughout the unit on a whiteboard. Next the students worked in small groups to answer the driving question, “Why does the world need so many different plants?” while including evidence from all six investigations. For example, some students used evidence from our first investigation (“Why are plants green?”) to argue that “Animals need plants because plants use photosynthesis to produce oxygen and sugar that they need to survive.” During a whole-class discussion, we encouraged students to connect their claims not only to evidence that we collected during our investigations, but also to the disciplinary core ideas we had addressed throughout our unit.
This unit integrated school gardens, NGSS storylines, and 3D instruction to create a rich and meaningful experience for students. Each investigation was designed to build not only content knowledge but also student proficiency with a scientific practice. By using a 3D framework for every investigation in our unit, we not only provided students with the opportunity to engage in meaningful scientific content through scientific practices, but also gave them the tools that will let them apply their knowledge gained from our garden-based unit to other domains of science.
Jonathan Bowers is a PhD student in the Department of Teacher Education at Michigan State University in East Lansing. Lisa Kenyon (lisa.kenyon@wright.edu) is an associate professor in the Department of Biological Sciences at Wright State University in Dayton, Ohio.
Labs Physical Science Middle School