
feature
Illuminating the Universe
Exploring a Digital Cosmos
Science Scope—July/August 2020 (Volume 43, Issue 9)
By Elizabeth Schibuk, Erika Wright, and Mary E. Dussault

Young people show a high degree of interest and curiosity in learning about the universe, irrespective of cultural background and gender. But how do we translate that intrinsic curiosity about space science into increased science affinity, STEM identity, and STEM career interest, particularly among girls and those from underserved communities? That is exactly what those of us at the Science Education Department at the Center for Astrophysics | Harvard & Smithsonian aimed to better understand through our Youth Astronomy Network. The Youth Astronomy Network (YouthAstroNet) is a national, online community of youth, educators, and scientists that aims to help youth gain confidence and identity as someone who can do science through personal participation in authentic inquiry.
YouthAstroNet builds on more than 15 years of successful research and innovation in technical and educational curriculum development engaging educators and their students in using robotic telescopes (Gould, Dussault, and Sadler 2006). YouthAstroNet uses web-based and cyber learning tools to make available all the core resources we have found to be most effective for increasing interest in and disposition for STEM careers (Ward et al. 2011).
YouthAstroNet: Astronomical images as digital data
In the online YouthAstroNet Activity Portal, youth in grades 5–8 have the opportunity to engage in authentic inquiry through a number of activities. Students request images with remotely controlled, online robotic telescopes; complete image processing challenges to enhance and make measurements of astronomical images; and ask questions directly of astronomy experts and scientists at the Center for Astrophysics. Students also use the MicroObservatory Robotic Telescope Network (see Figure 1) to request their own personalized images of astronomical objects collected through the use of a digital detector called a charge-coupled device, or CCD. Students then enhance and edit their digital images utilizing JS9-4L, a professional-grade image processing application adapted for novice users. Through JS9-4L students can personalize their experience with astronomy, bringing out the details of celestial objects, adding false color, creating true color images of space, or using the analysis tools to pursue projects of their own interest.
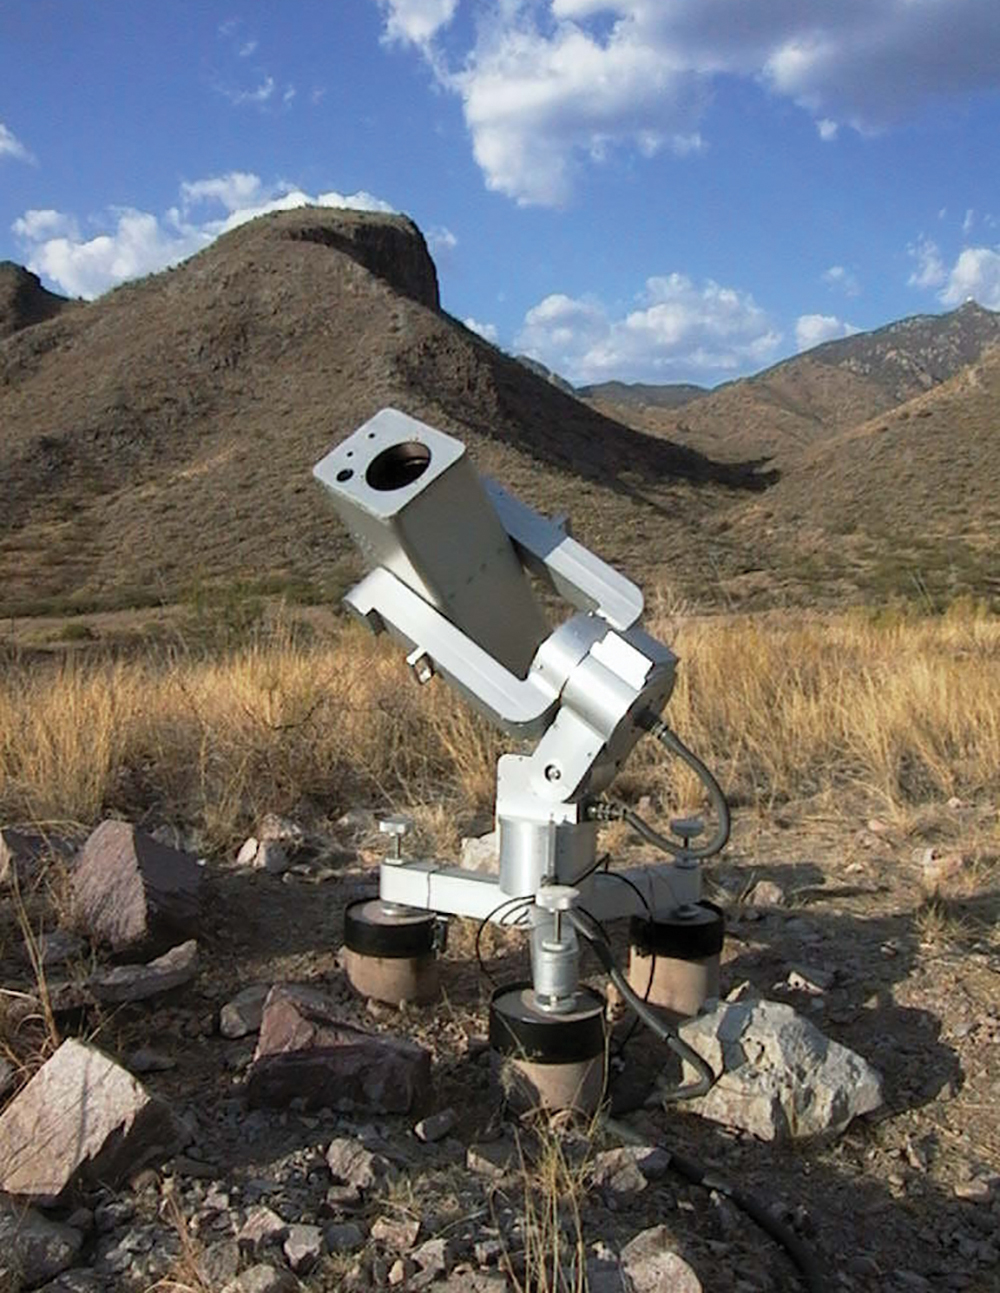
One of several MicroObservatory robotic telescopes used by YouthAstroNet participants. Location: Fred Lawrence Whipple Observatory, Arizona.
Students engage with these tools in many of the same ways that professional astronomers engage with telescopes and image processing software—opening up the black box and exposing students to how real science is done.
Personalizing to your classroom
In addition to the three essential elements of the YouthAstroNet program design—using telescopes, processing images, and including these products in a final capstone project—we had a critical goal of making it flexible enough that educators could customize and personalize it for their classrooms, while providing supports for a number of investigations. Depending on classroom goals and curriculum needs, educators have used YouthAstroNet to introduce and study a wide variety of subjects. They have studied moon phases and the size and scale of the universe, they have used astronomy as a platform to investigate light and color and the electromagnetic spectrum, they have focused on the telescopes themselves utilizing our design engineering challenges, and more. Students can also pursue independent research projects from monitoring sun spots to measuring the brightness of variable stars to investigating the color variability of a comet. Consider the following case study of how one teacher took the activities, resources, and online platform of YouthAstroNet to help her students explore information transfer through the lens of imaging space.
Case Study: Using YouthAstroNet in an eighth-grade classroom project
Framing
At Conservatory Lab Charter School, our eighth-grade science curriculum begins with a three-month space science unit. The essential question for the unit asks students to consider: How have humans imaged and imagined space throughout history? In the culminating project, students use YouthAstroNet to create an astrophotography exhibit. Students produce both images and written content for their exhibit, which requires them to synthesize their knowledge of how modern information technologies have changed our ability to image and, in turn, to imagine space.
Project launch
We launch the project with a Gallery Walk featuring images, illustrations, and diagrams of space that span from ancient civilizations to contemporary digital images. The photographs (gathered from a variety of web and print sources) are grouped by similar themes and time periods and assembled at five viewing stations across the classroom. As students circulate in the gallery, they record their observations and wonderings in a structured note-catcher (see final project packet, p. 2, in Online Supplemental Resources). The Gallery Walk builds curiosity about what it has meant to try and visualize our universe over time.
Information transfer
Next, I tell students that we are going to use a simulation to model the transfer of visual information, personalizing YouthAstroNet’s “From Pixel to Picture” activity (see Figure 2). Students work through a series of steps (described next) to simulate the process by which visual information gets encoded in pixels, transmitted via binary code, and then reassembled as visual information to produce a computerized image of a space object.
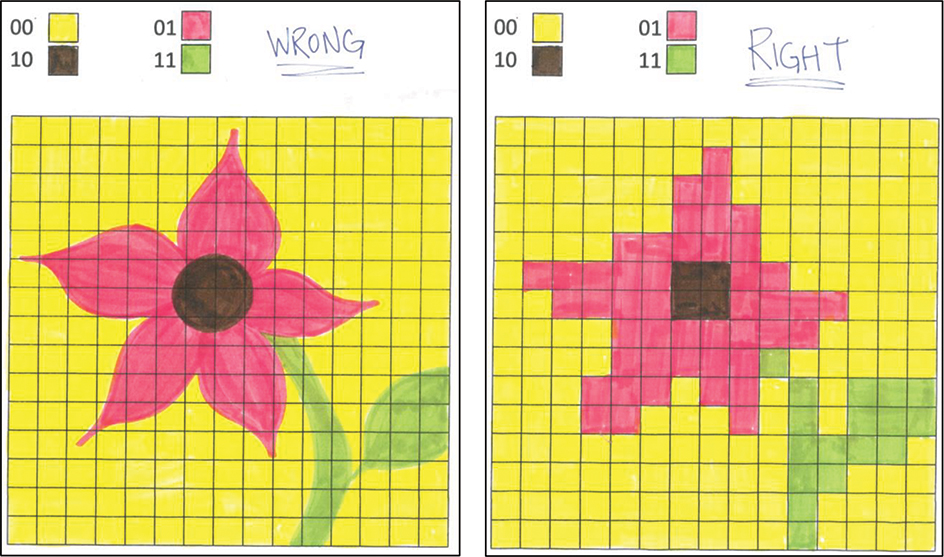
Student handout for the pixelation and digital imaging simulation task.
To begin the simulation, each student receives a 15 × 15–square grid and is tasked with creating a pixelated drawing using exactly four colors. I’ve found many students struggle with the concept of an image made of pixels, so I provide a model of correctly and incorrectly completed illustrations for them to analyze. As they study the two models, students are asked to work collaboratively to respond to the following questions: 1.Study the images and notive how they are different. Knowing that the image on the right is the one that was done correctly, what do you think the “rules” are for creating a pixelated image? 2.Each of the images contains 225 pixels. Based on this information, how would you define the term pixel in a digital image?
After students work with a table partner to formulate their initial responses, we collaboratively deduce the “rules” for creating pixelated images and to define a pixel. Students are able to infer that (a) in a pixelated image each pixel can only contain one color; (b) in the context of the template and code provided, the students must use precisely four colors, no more or less; and (c) pixels cannot be left blank unless white is explicitly chosen as one of the four colors. We build a working explanation of a pixel as the smallest unit of a computerized image.
After students have created their images and worked through these initial questions, they move onto the encoding phase of the simulation. On a separate sheet with the same grid, I ask students to recreate their image in a color-by-numbers format. Instead of coloring each pixel, they label it with one of four codes (00, 01, 10, or 11), each assigned to a specific color. I then collect and copy students’ “transmission” sheets and redistribute them among their peers; each student is asked to “translate” their peer’s code on a third grid, called the “image decoding sheet.” The purpose of this activity is to simulate transforming visual data into binary code so that it can be transmitted across devices. The activity serves as an anchor and reference point throughout the remainder of the project when we discuss how light leaving the space objects we are photographing gets encoded, transmitted, and reassembled into the images we see on our computer screens.
The important learning in this simulation comes in the analysis questions, which ask students to construct an explanation of what we were modelling in the serial drawing, coding, and decoding tasks, and to make connections to the astrophotography work we will be doing later on in the project. The analysis questions that follow this simulation task are designed to build students’ understanding of the performance expectation MS-PS4-3: “Integrate qualitative scientific and technical information to support the claim that digitized signals are a more reliable way to encode and transmit information than analog signals.” Students are asked:
- In this task, we carried out a simulation. Describe, as best you can, what you think we were modeling in our simulation and how it connects to the theme of astrophotography.
- How could you adapt this activity to create a more detailed picture?
- Space telescopes, such as Hubble, need to send digital images back to computers on Earth. Thinking about the activity you just did, how do space telescopes use binary code (strings of “1s” and “0s”) to send images to computers on Earth?
Students work collaboratively in class to answer the questions and to try to make meaning of the task and situate its purpose in the context of a project on astrophotography. I look for students to make explicit connections between how they matched specific colors with specific codes, and the transmission of those codes to a classmate, and the encoding, transmission, and decoding that allows us to capture and transmit digital images from space telescopes. In question 2, I look for students to be able to explain that to create a more detailed photograph, as we will need for astrophotography, we should be able to increase the number of pixels as well as the number of codes available to capture more distinct colors.
Capturing images
Students are now ready to engage with the YouthAstroNet platform. I introduce students to the telescopes, and we discuss how the information technology concepts we have been learning about provide a map for understanding the work we are doing in YouthAstroNet. We use visuals (see project handouts) to map out the transfer of information in different forms (light and data) as it travels from space object to our computer screens. With this framework set, students are ready to log in to the YouthAstroNet platform and begin requesting images. As students log into the program to request images, I ask them what they notice about how the request page is formatted. Students see that the space objects they can request are organized in a way that mirrors the organization of our Universe, from Solar System objects, to stars and nebulae within the Milky Way, to other galaxies. Calling attention to this structure helps to reinforce their understanding of DCI ESS1.A “Earth and its solar system are part of the Milky Way galaxy, which is one of many galaxies in the universe.”
Students begin by requesting an image of the moon. For our first photograph, I used screenshots and slides to talk them through the steps (see Figure 3). As students complete the request, we discuss the meaning of the different selection options available (field of view, exposure time, and filter selection). Students learn how they can adjust the telescope settings to best photograph the specific space object they are choosing to focus on, building toward the cross-cutting concept that in both the natural world and technology alike, structure matches function. Understanding the filter option is key to understanding how professional astronomers determine the colors being emitted by objects in space. Selecting an appropriate field of view for different space objects requires students to consider the relative scale of different space objects, as well as their relative distance from Earth (and perceived size from Earth), which provides an opportunity for students to grapple with the crosscutting concept of size, scale, and proportion in the natural world.
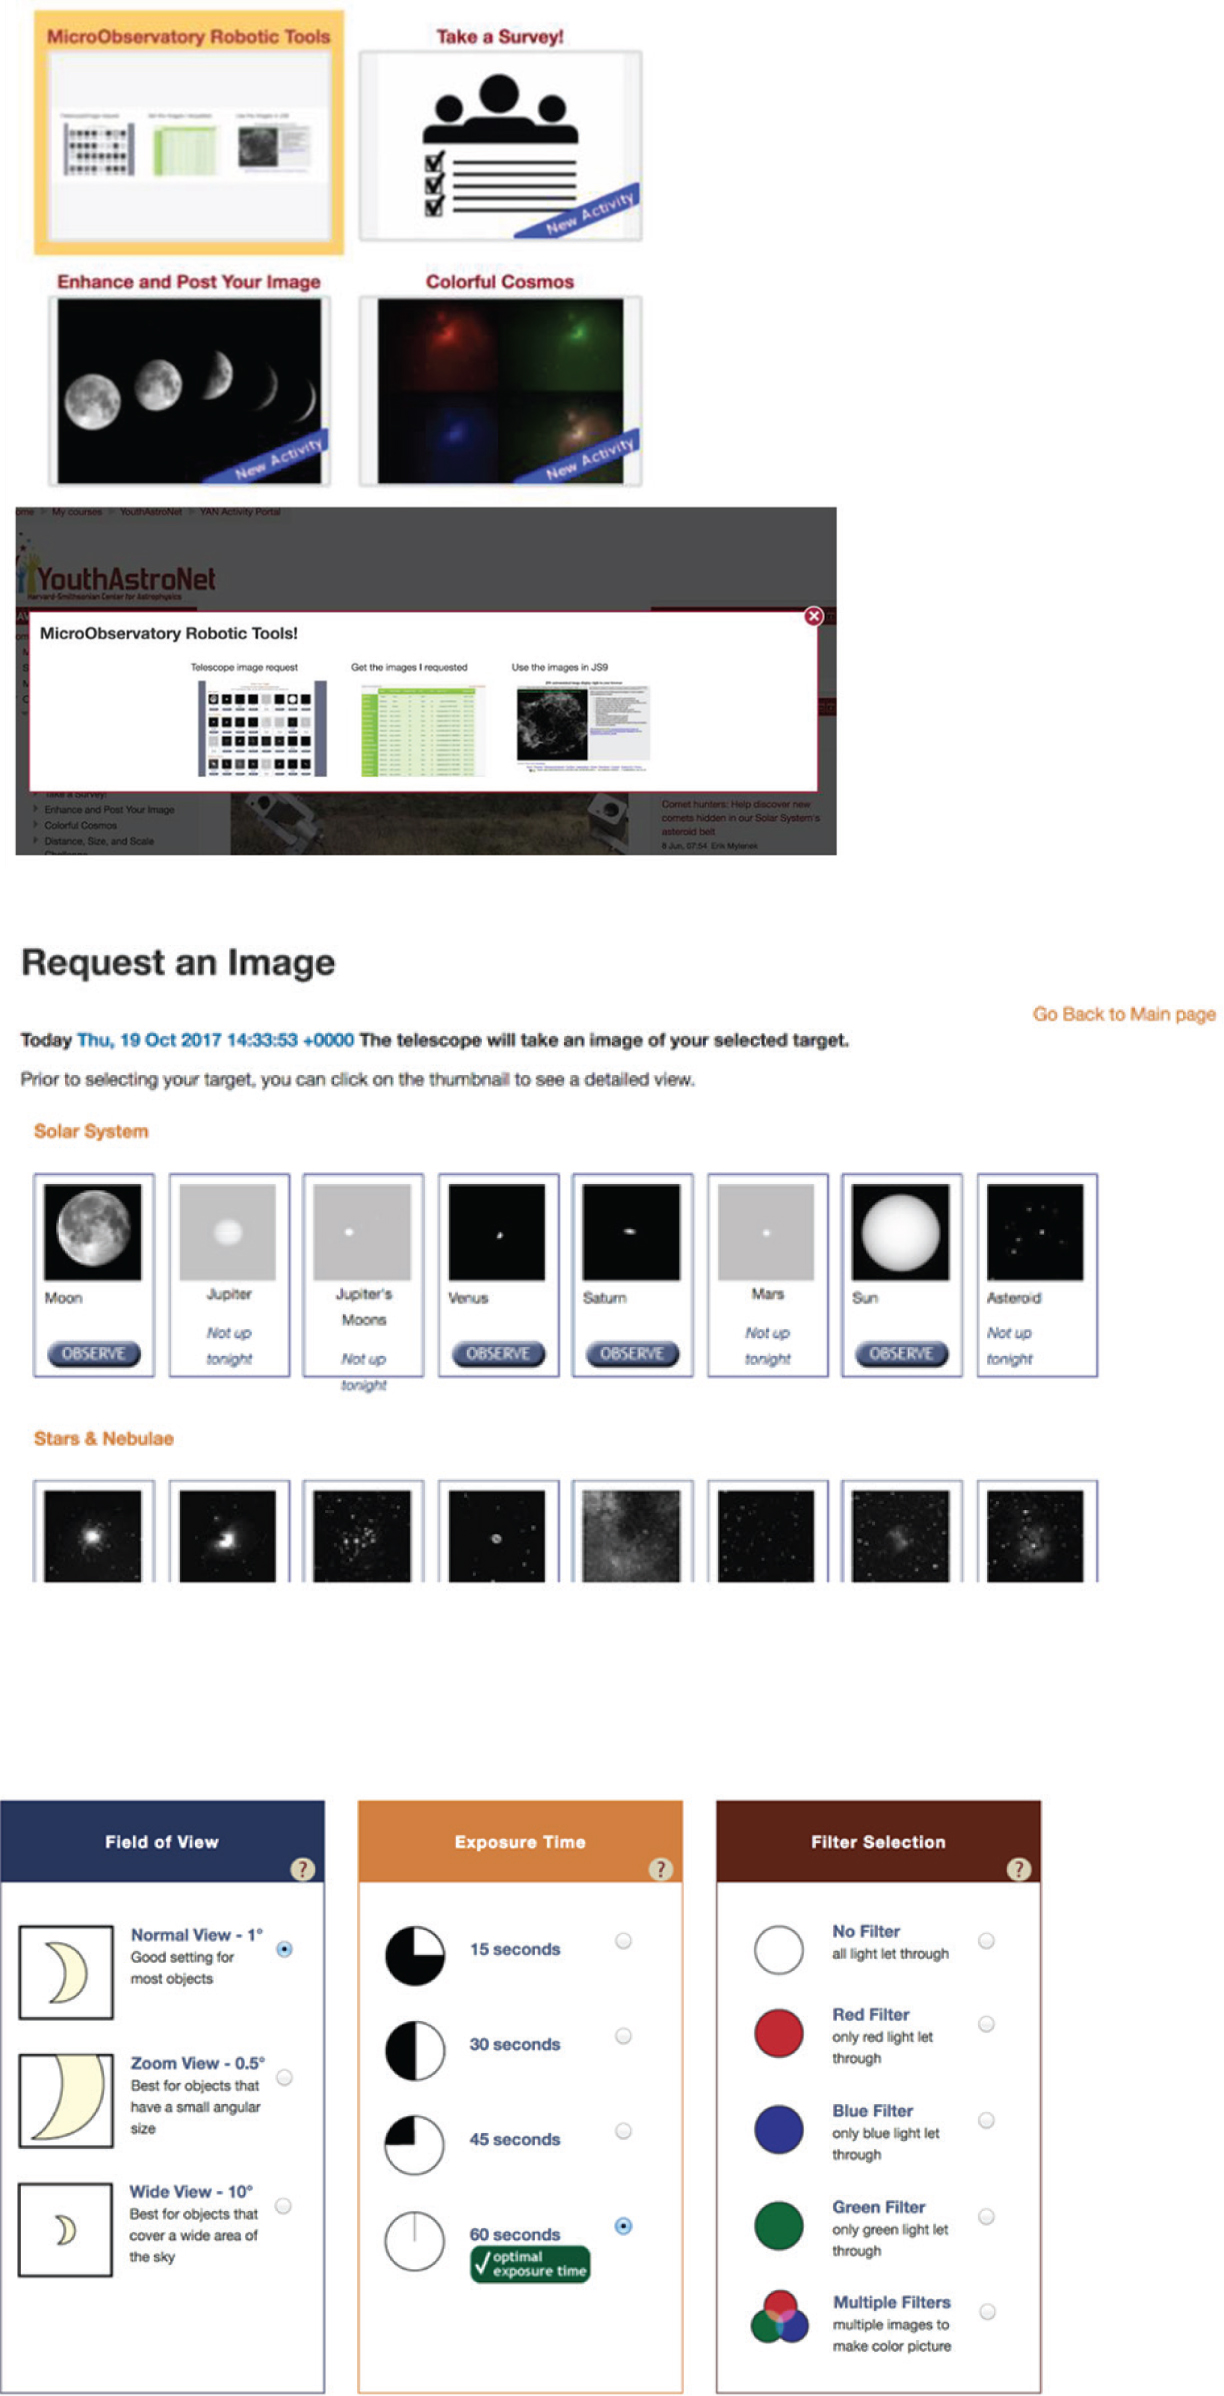
Overview of steps for accessing the MicroObservatory and requesting images.
Processing images
The next day, students are eager to log in and see their images. They are often less enthusiastic about the aesthetic quality of the image they see. I remind students that what they have in front of them is not an artist’s or even a photographer’s image, but merely a collection of pixel values coding for quantity of light. I tell them that the next step in their work as astrophotographers is to learn how to render a collection of coded pixels into compelling and purposeful images—to go from raw data to processed data. Students watch and take notes on two instructional videos available from the YouthAstroNet team that use screencasts to teach students the techniques they need for navigating the processing software. The first film students watch is “How to Process a FITS Image” and then, later on, “YouthAstroNet RGB | Quick Walkthrough.” Students at this point work at their own pace to watch the videos, record key ideas, and then apply what they learn to create their own black-and-white image and false color image of the Moon (see Figure 4). I communicate to students that after watching each film they will need to replicate the steps shown to process the images they received into more captivating and detailed images. I frame for students that there is no “answer key” for their video notes, that they need to reflect on what information and steps to write down and how that will give them the reminders they need to replicate these steps. Much of what students are doing during image processing at first feels like editing regular photos in any image editor. Specific reflection questions embedded throughout the project and in the final writing tasks, however, ask students to make connections between adjusting settings in JS9-4L and core content of digital information transfer, color theory, and scale and organization of the universe (see Figure 5; see also questions in final project packet, p. 26, in Online Supplemental Materials). Below is one example of a prompting question for students’ final writing task:
In this project you learned some of the vocabulary that scientists and engineers use to describe communication systems and the transfer of different types of information (encode, decode, transmit, source, receiver, etc.). Using this content vocabulary, write a paragraph to explain how information is transferred from a space object all the way to your computer. Describe the different ways that information is stored or transmitted at various points in the communication process (example: light, color, binary code, radio waves).
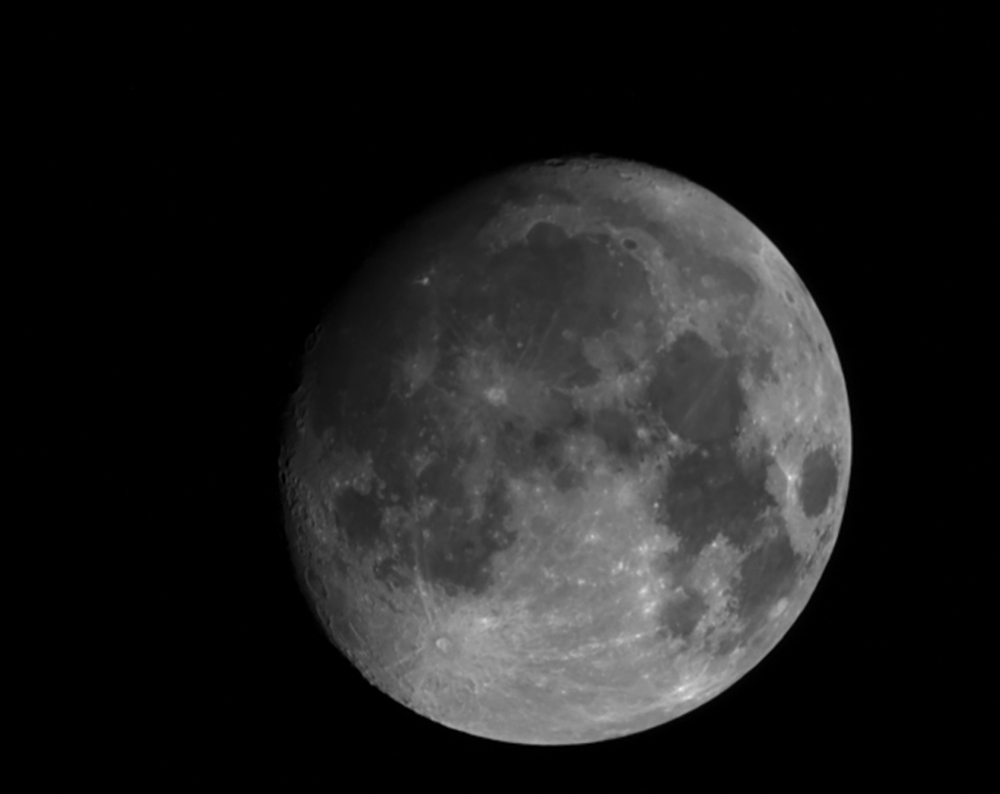
Sample student work: This is an example of a processed black and white image of the moon that a student created using the tools in JS9.
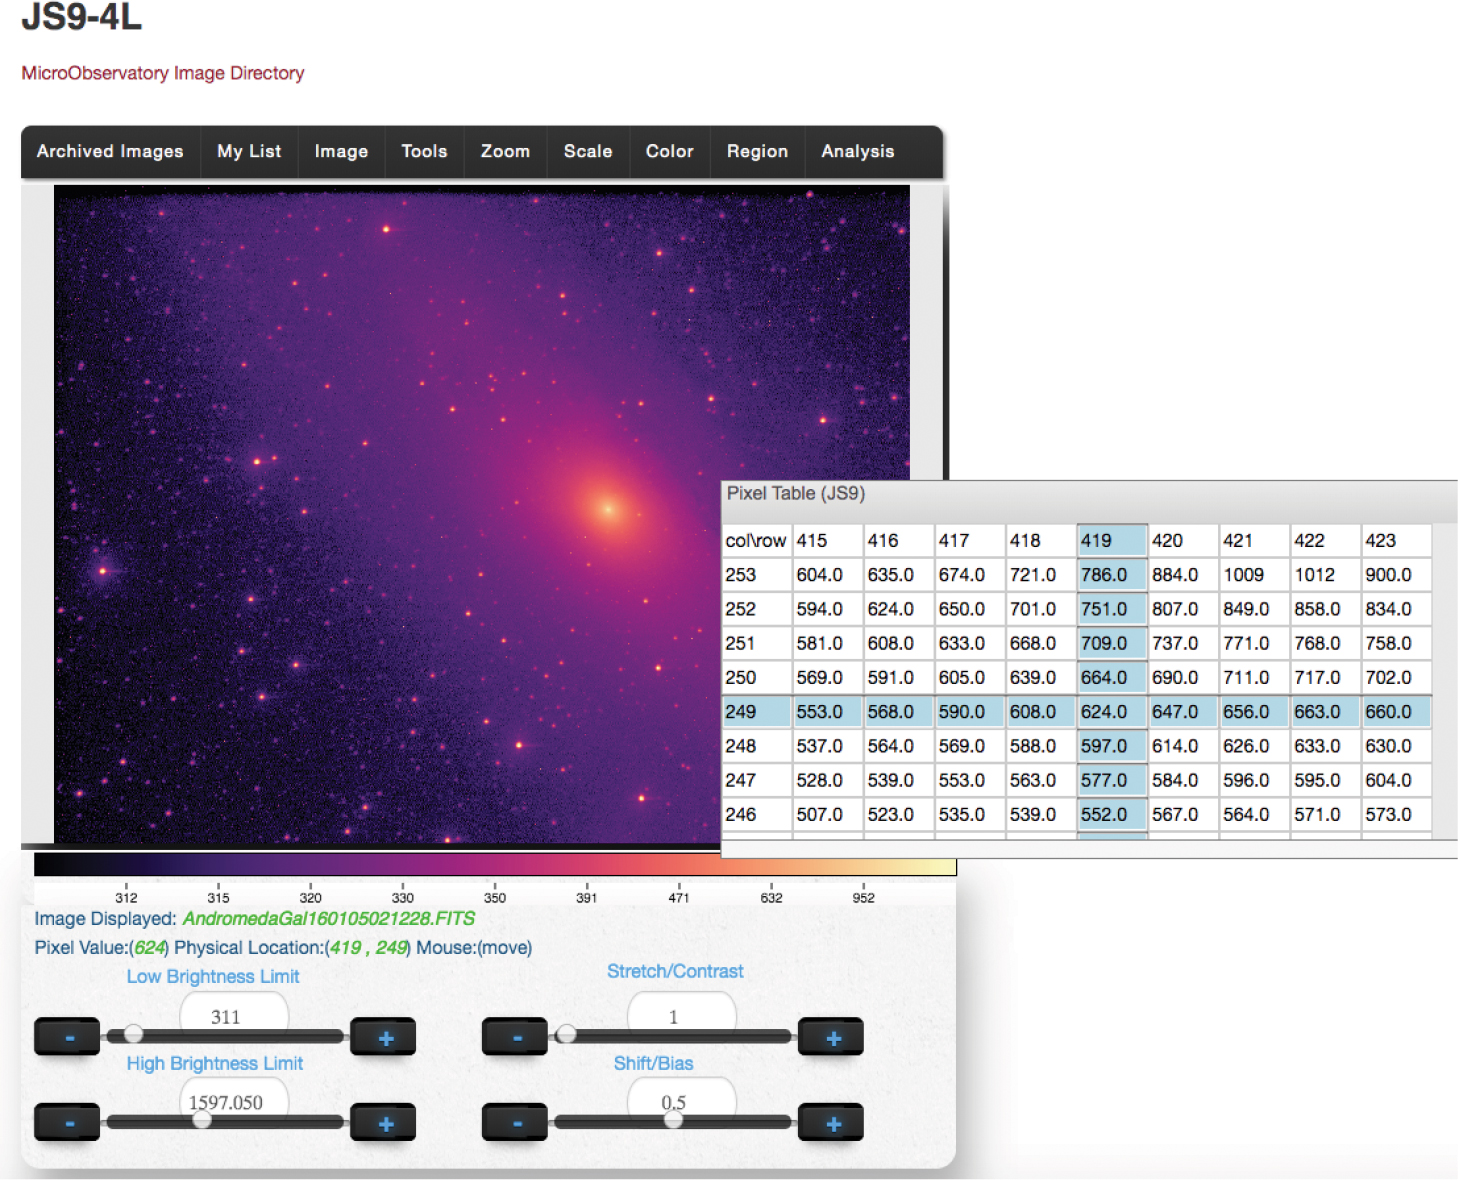
The JS9-4L image processing tool allows students to see the raw data behind their visualized image.
Students continue to request and process images of space objects, in color and in black and white. Each image they request is taken by the telescopes that night and delivered to their YouthAstroNet account the following day. In requesting and processing each image, they review their understanding of the types of objects in our Solar System and their relation to each other. They later reflect on their work with these images as a way to discuss how modern technology allows us to image space objects that would otherwise be far beyond our view. Students request and process images in the following sequence:
- Moon Solar
- System object beyond Earth-Sun-Moon system
- Star & Nebula
- Galaxy: No Filter
- Galaxy: Multiple Filters
The final galaxy photo they create is a “true” color image, which they create by taking three images of a galaxy: one with a red filter, one with a blue filter, and one with a green filter. Because the telescope detectors only record the images in relative brightness values (typically visualized in shades of gray), the students must colorize each of the images individually using the JS9-4L image processor. The image taken through the red filter is colored in shades of red, the blue filtered image colored blue, and the green filtered image colored green. The three images can then be superimposed to create a “true” color rendering of the galaxy—one that is representative of the colors of light the galaxy emits. For this process to have meaning, students need additional understanding of color theory. The color theory lesson has students engage with the PhET color vision simulator available freely through the University of Colorado Boulder. Through guided exploration they learn that all visible colors can be created from composites of red, green, and blue light and that color images on a computer screen are thus just collections of pixels, each emitting different quantities of red, green, and blue light. As students move back and forth between their learning in the PhET simulation and creating their own RGB image, they uncover how the red, green, and blue filters in the telescope transmit or absorb different colors of light, creating the three color images necessary to create a composite true color image (DCI- PS4.B).
With this knowledge, students then return to the YouthAstroNet instructional video library, where they watch the tutorial on how to construct a true color image in the JS9-4L software.
Project write-up and board creation
In the final phase of the project, students work in teams to prepare project boards for our culminating astrophotography exhibit. Students are given a series of structured prompts to help them synthesize and reflect on their learning about astrophotography, waves, and information technology (see Figure 6). The prompts are organized into the following areas:
PART 1:
A. Background Information
The background section has the largest volume of writing, as students are asked to summarize their learning about digital imaging and astrophotography, information transfer, and the software tools they used on the computer.
PART 2:
In each of the following subsections, students chose one or two of their final photographs to include from each level of organization in the universe. They are asked to provide captions and thoughtful organization of materials on a page to reflect their knowledge of what each space object they have photographed is, and it’s relation in space to the other images photographed.
B. Earth–Moon–Sun System
C. Solar System
D. Milky Way Galaxy
E. Outer Space
PART 3:
F. Conclusion
To wrap up their project board, students are given a choice of two reflection prompts to think more deeply about the significance of our work in this project, and situate it within larger themes of our year in science. The two conclusion prompts are:
Guiding Quote:
At the beginning of the year we read a quote that would guide our year in eighth-grade science: “Numbers have an important story to tell. They rely on you to give them a clear and convincing voice.” Reflecting on this assignment and the other work you’ve done in eighth-grade science, discuss how we have used numbers and data to communicate important concepts about space.
Essential Question:
The essential question for our unit asks: “How have humans imaged and imagined space throughout history?” Reflecting on this assignment, the models and illustrations you’ve done in class, and what you know about modern telescopes, discuss how scientists use images and models to communicate important concepts about space.
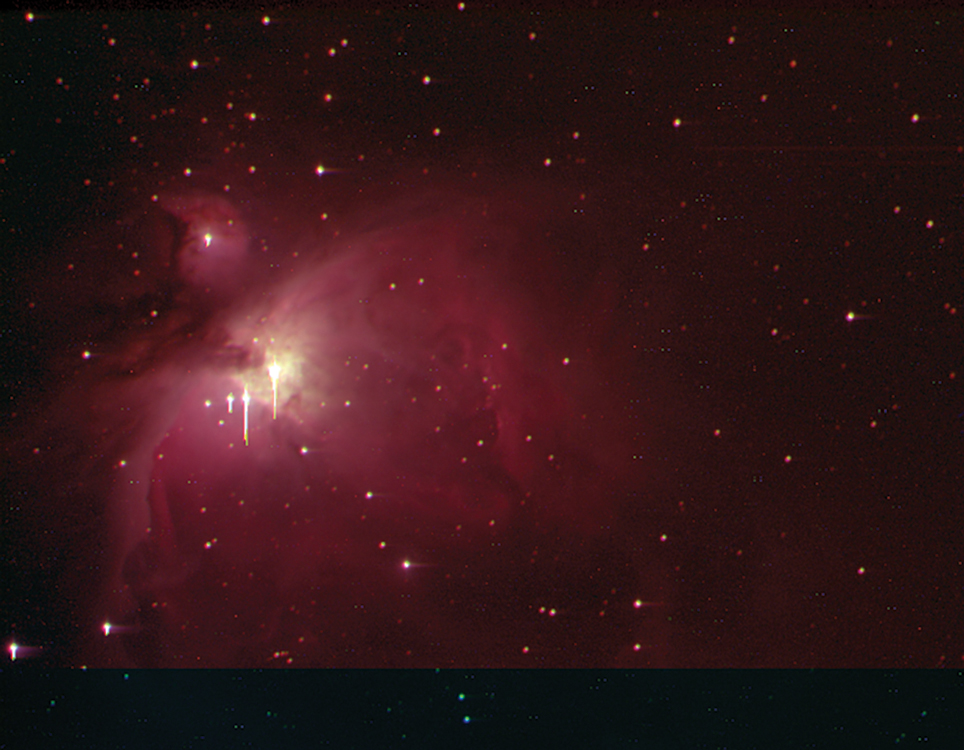
Sample student work: Example of a processed true color image of the Orion Nebula that a student created using the tools in JS9, combining individual image files taken with green, red, and blue filters.
Students compile their writing as well as their favorite images into a Google document, which they share with me. I monitor students’ writing in their Google Doc, and conference with teams that are struggling to make progress or whose work indicates misunderstandings. To ensure quality of content, I don’t give groups their project board until I have reviewed and assessed their written work (see the final project rubric in Online Supplemental Materials), given feedback, and flagged groups that need to make revisions before publishing their content to their poster.
We wrap up our astrophotography project, and our space science unit, with a celebration of student work. We invite families and other classes at the school to come to our poster-session style event in which students demonstrate their final project boards (see Figure 7).
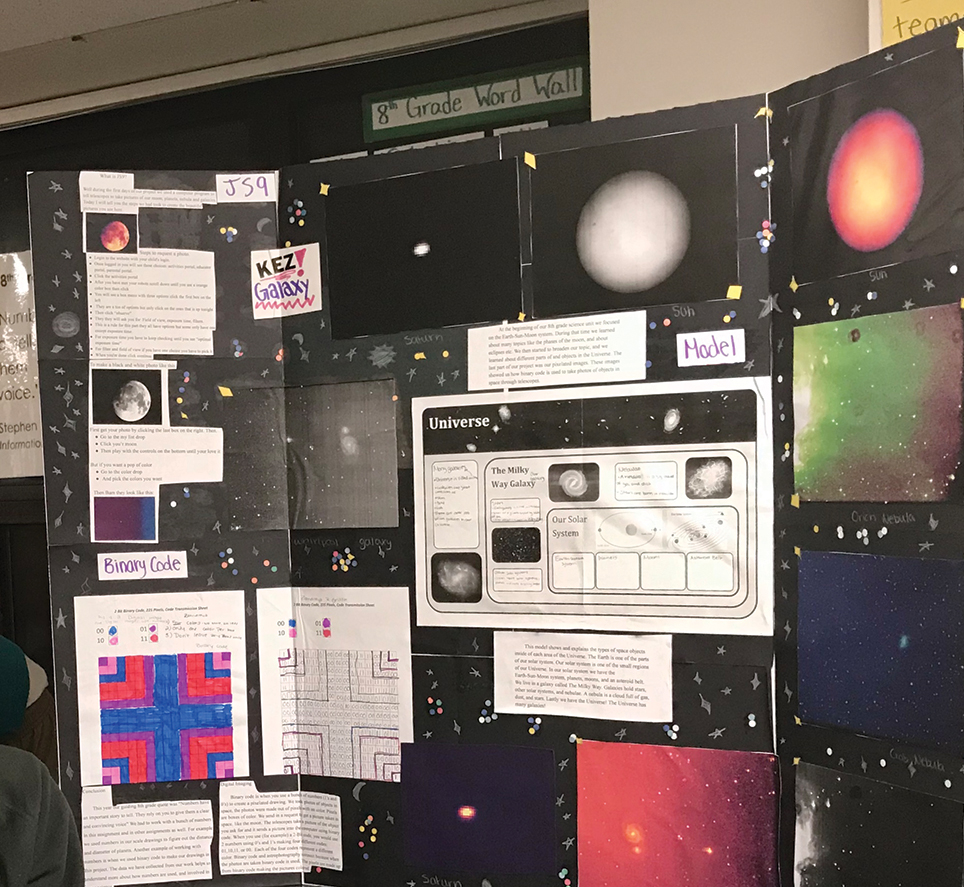
Project board from student showcase.
Promoting student STEM identity
Just as in the classroom case study provided, YouthAstroNet programs across the country culminate in celebrations of student work. These capstone projects showcase student learning and confidence in astronomy content knowledge, and also showcase the student as someone who can do science. Our team of education researchers at the Center for Astrophysics conducted an analysis of student pre–post surveys to determine program factors that promote science affinity, STEM identity, and STEM career interest. We found that gains in these outcome measures were significantly correlated with the degree to which youth participants reported experiencing the core elements of YouthAstroNet, specifically: requesting robotic telescope images, using image processing software to enhance and make measurements of images, asking questions, and connecting science to everyday life (Dussault et al. 2018).
Finally and most important, youth participants have self-reported a high degree of enjoyment in participating in YouthAstroNet activities, and we know that programs work best when you can get students invested in them.
Acknowledgments
The authors thank the YouthAstroNet project team and all the teachers, students, and scientists who participate in and contribute to the YouthAstroNet community. The development of the YouthAstroNet program was supported by the National Science Foundation’s Innovative Technology Experiences for Students and Teachers program under Award No. 1433345 and 1433431. Additional support is provided by the National Aeronautics and Space Administration under Award Number NNX16AC65A. Any opinions, findings, and conclusions or recommendations expressed in this material are those of the authors and do not necessarily reflect the views of the NSF or NASA.
Elizabeth Schibuk (schibuk@gmail.com) is a middle school science teacher at the Conservatory Lab Charter School in Dorchester, Massachusetts. Erika Wright is an education specialist and Mary E. Dussault is a science education program manager, both in the Science Education Department at the Center for Astrophysics | Harvard & Smithsonian in Cambridge, Massachusetts.
Earth & Space Science Technology Middle School