
Classic Lessons 2.0
Simulating a Wave to Understand Science and Technology
Science Scope—July/August 2020 (Volume 43, Issue 9)
By Molly Rockefeller and Jerrid W. Kruse
As science grows in complexity, the utility of computation thinking (CT) helps scientists deal with more complex and larger data sets. Therefore, the inclusion of CT within science teaching may be useful. The following activity combines a Next Generation Science Standards (NGSS Lead States 2013) standard with a Computer Science Teaching Association (CSTA) standard to help students see interconnections among STEM fields. Within the CSTA standards, students are expected to use CT to solve problems. CT is a tool that will “allow scientists and engineers to collect and analyze large data sets, search for distinctive patterns, and identify relationships and significant features in ways that were previously impossible” (NRC 2012, p. 64). Throughout the lesson students are utilizing CT to solve problems and identify relationships/patterns to better grasp concepts of waves.
Day 1: Slinky Demonstration
To begin, we demonstrate a transverse wave to the class with the help of one student. We use a Slinky and stand a few feet away from one another to stretch the Slinky out in a straight line. The student who is helping with the demonstration simply holds one end of the Slinky still, while we move our end about 12 inches up from the starting point and then immediately back down, lower than the starting point. We repeat this movement so students see wave pattern. We ask students, “What did you observe?” Possible student answers are “we saw it create a wave,” “it made a repeated pattern,” “it was curved,” etc.
We pose the question, “How could we change the wave?” to our students and demonstrate their ideas to peak their interest. Students typically say to change the height, speed, or direction, and/or to push the Slinky in to make it go back and forth. After seeing the ideas play out, we ask students to speculate about how energy and wave behavior are related. Students then answer this question on paper to best navigate their ideas: “How do you think increasing the energy of a wave will affect the wave? Draw a picture to support your answer.” Often students answer by saying that increasing the energy of the wave will create larger amplitude. Later in the lesson, we will go back to this formative assessment to make changes to their ideas based on their observations.
Day 1: Utilizing prompting questions
To start the next portion of the lesson, we use the prompting question, “How did the Slinky help us demonstrate a wave today?” Students often respond with “helps us visualize it,” “we could see what changed,” “easy to manipulate,” etc. We use one student’s ideas to guide the discussion further and say, “We used the Slinky to visualize a wave, but how could we measure changes in the wave? Talk to your partner about that question.” To get more students involved in the discussion, we have them talk with their partners. During the small-group discussion, we walk around the class to keep students on task and listen in on their conversations.
After about two minutes of small-group discussion, we bring students back as a class to share our ideas. In most cases, students say to use a ruler, put a Slinky on the floor and mark the floor where the height of the wave is, etc. The discussion guides students to the notion of precision and a need for a simulation. We ask, “How would being able to pause the wave while it’s moving in our demonstration help us be more precise?” When students recognize the value of “pausing the wave,” we prompt them further by saying, “Using a video or simulation would give us the ability to pause the wave, which will better our observations.”
Before getting into the simulation, we take an opportunity to have students reflect on the nature of science (NOS) by asking questions such as:
- In the real world we can’t hit pause and stop our Slinky in the middle of the air; what factors in the real world make investigating difficult for scientists?
- Why would a scientist want to use a simulation instead of physically doing the activity?
- What type of simulations would a scientist use?
- How would a scientist ensure their simulation is accurate?
- Why would a scientist want to be critical of the simulation they are using?
While the NGSS include science and engineering practices for students to engage with, the NOS asks students to go deeper by understanding why scientists might engage in such practices. NOS leads students to make connections with how they are acting like scientists. This helps students gain a perception of how scientists work in the real world and encourages students to see themselves in this role. It is important to note that for students to overcome misconceptions of how scientists work and the NOS, teachers need to explicitly ask students questions that help them compare what they are doing to what a scientist does. These questions help students make the connection between classroom activities and the work of actual scientists (Khishfe and Abd-El-Khalick 2002).
Day 1: Simulation
For the next portion of the lesson, we utilize an online simulation to have students better visualize and manipulate waves. To get students on the simulation quickly, we post the link to “wave on a string” (link in Resources) on our Google Classroom to ease the transition (or write the link on the board for students to see). We give students five minutes to investigate how changing the simulation variable (amplitude, frequency, tension) changed the appearance of the wave. We walk around the room to ensure students are on task, and we help students who are having difficulties using or accessing the simulation.
After students have explored the simulation, we begin a class discussion with the goal of using student’s observations and words to define amplitude and frequency. Following is an example dialog we teachers (T) had with students (S) when debriefing the simulation:
T: What happened when you only changed the amplitude setting in the simulation? S: The height changed, extended on both ends going up and down, etc.
T: If we increase amplitude, what happens? S: The wave gets taller.
T: (drawing an s-wave on the board): How could we label and define amplitude on our wave? S: The amplitude is how tall the wave is. S: We could draw a line from the bottom of the wave to the top of the wave. S: We could draw a line from the rest position to the top of the wave.
T: We could draw the amplitude from the top to bottom or from middle to top. It is more common to draw from the rest position to the top or bottom. Why could either approach work? S: The longer option is just double the shorter line so if one goes up the other one will to.
T: What happened when you only changed the frequency setting in the simulation? S: Got faster, got slower, more of them, fewer, etc.
T: How could we describe to someone else what frequency means? S: Frequency is how fast the waves move S: Frequency is how many waves per a particular time.
T: If the frequency goes up, how will the number of waves crossing a certain point be affected? S: Well, the number of waves crossing that point will go up if frequency goes up because the speed is faster.
T: So that’s how we’ll define frequency.
After these defining conversations, we work to have students explore relationships among variables through computational thinking strategies. Students will be writing down what they learned as a reflection in their science notebooks. In our classroom, students have a notebook dedicated to science.
Day 2: Computational thinking to explore relationships
We start the second day of the lesson on the simulation. Once students are there, we tell students to set their simulation to “No End” and to “Oscillate.” This setting makes it so the wave has no end, which is shown in the simulation with the wave entering a portrait, which gives the perception of it continuing on. Setting the wave to oscillate means that it is continuously producing waves at a constant speed, which gives students a better way to visualize patterns. Please refer to the screenshot image (Figure 1). We give students the challenge to make their wavelength equal 2 cm and write down what amplitude and frequency it’s set at to create that wavelength (Figure 2). Then we ask them to make the wavelength equal to 4 cm. This challenge approach promotes computational thinking as students are completing a “what if …” scenario and changing conditions in the simulation to find and observe new outcomes (Sneider et al. 2014). Students are making thoughtful decisions as opposed to using trial and error to solve a problem. During student’s work time (10 minutes), we walk around the room to help scaffold students and answer questions. For example, we might ask, “When we talked earlier as a class about frequency, what did we notice? How might using our definition of frequency help you create a specific wavelength?”
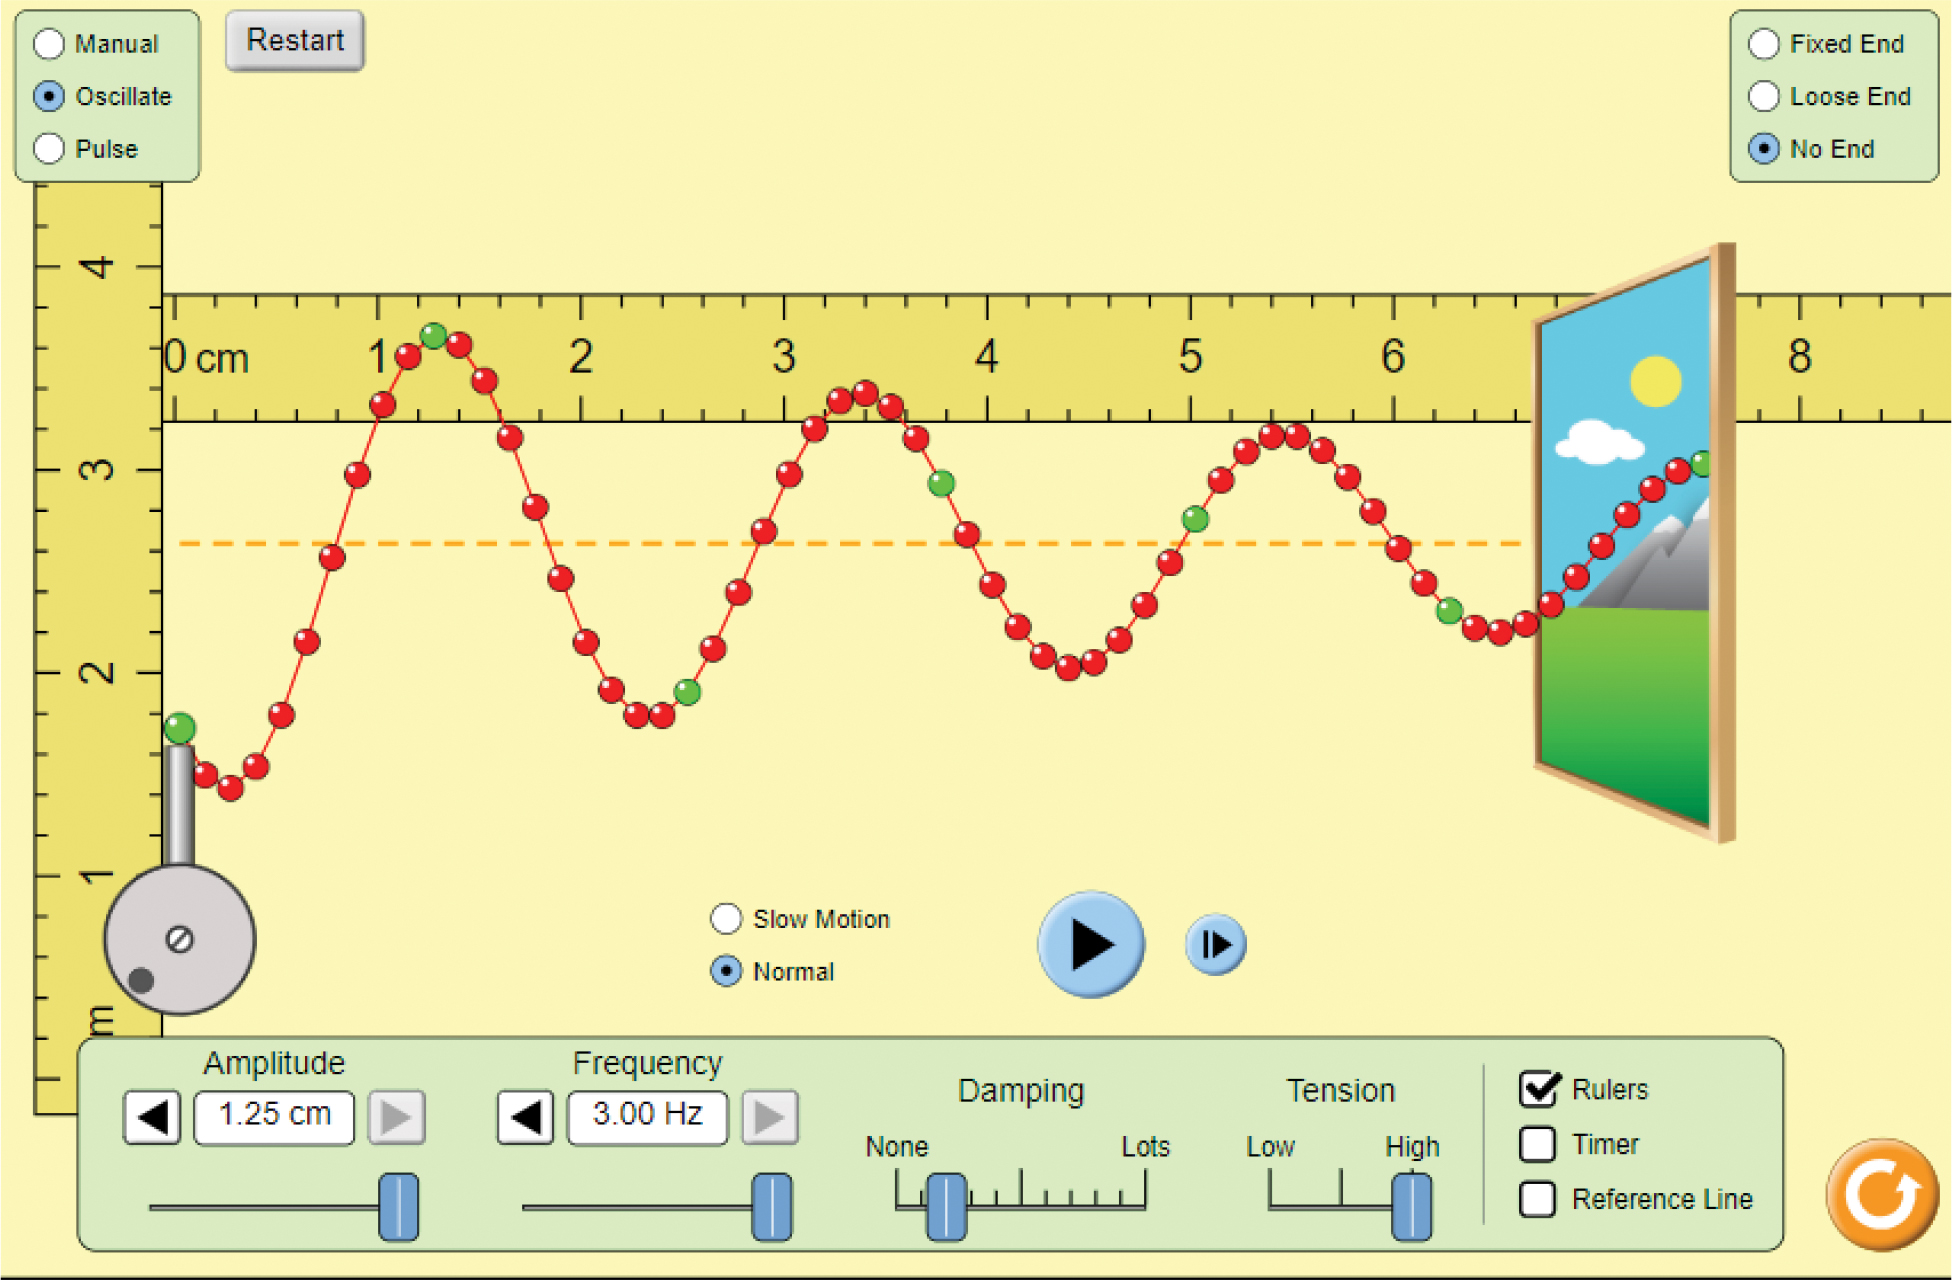
Screenshot showing how students can manipulate the simulation.
Student challenge to promote computational thinking.
Directions: Once you are at the website for the simulation click “No End” and “Oscillate” in order to answer the following questions.
1. Create a 2 cm wavelength. What is your amplitude and frequency?
2. Create a 4 cm wavelength. What is your amplitude and frequency?
3. How did your amplitude and/ or frequency change while changing your wavelength?
4. What is the relationship between amplitude and frequency?
Answers:
1. Amplitude: various possible answers Frequency: 3 Hz
2. Amplitude: various possible answers Frequency: 1.5 Hz
3. Amplitude did not have to change, whereas the frequency did.
4. There is no direct relationship between amplitude and frequency, they do not impact one another.
After students use the simulation to engage with the challenges, we target the relationship between frequency, amplitude, and wavelength by asking, “We notice many of you are coming up with 3 Hz frequency, yet have different amplitudes to make a wavelength of 2 cm. What can we interpret from this evidence in regard to the relationship between frequency and wavelength?” Students typically struggle with this question so we ask, “What happened to the wavelength when you changed the amplitude?” Students quickly note that it stayed the same. Then we ask, “Why could we have lots of different amplitudes to meet the challenge?” Students reiterate that amplitude did not affect wavelength, but frequency did. At this point we ask, “If amplitude doesn’t affect wavelength, but frequency does, what can we say about the relationship between frequency and amplitude?” Students now recognize that the amplitude and frequency are not related, “which is why we all had different amplitudes.” This leads us to the question, “What causes the amplitude to change?” However, to investigate this aspect, we return to the Slinky.
Day 2: Back to the demonstration
With the Slinky back out, we say, “Using the simulation, we easily saw how increasing the amplitude made a taller wave. What would we have to do to make a really tall wave with the Slinky?” Naturally, students animatedly say “move your arm really big up and down” or “go up high and then down low.” After demonstrating, we say, “That was tiring, how could we create a wave that doesn’t take as much effort?” Student’s usually say “make the wave shorter,” “don’t move your arm as much,” etc. We follow these comments with “Ok, so how does amplitude relate to the energy I have to use to make the wave?” Instead of having students answer this question in a discussion, we have them go back to their speculations from the beginning of class and write their new answer underneath the old. We utilize this form as an assessment to better gage student’s understanding of waves.
Day 2: Reflecting on CT
To target our computer science standards, we ask students the following questions.
T: How did the computer simulation help us understand waves better than the Slinky?
S: The simulation was more accurate and we were able to change specific wave characteristics.
T: Why was understanding what affected wave patterns easier with the computer simulation than the Slinky?
S: We were able to precisely measure the wave’s amplitude and wavelength.
T: How were you able to use patterns to better your understanding of wave properties?
S: Patterns helped us see that amplitude doesn’t impact wavelength.
S: Looking at the pattern of the waves helped us better understand how frequency is related to wavelength.
T: In what way did the computer simulation help you better visualize patterns?
S: We were able to stop and start the simulation at various times while the wave was moving. This made it so we could better see what happened throughout time.
S: The wave moved continuously so we were able to immediately see how changing the variable changed the movement of the wave.
T: The computer simulation allowed us to simplify the wave; how do you think computer simulations might help scientists?
S: Scientists can use simulations to better visualize things that they normally can’t see.
T: In what way might computer simulations help us better identify patterns?
S: Simulations keep going so we can see it repeat.
These questions aid students in explicitly reflecting on how the computer simulation can help detect patterns to help scientists understand the natural world. Students who are able to recognize and use patterns better “make predictions, work more efficiently and establish a strong foundation for designing algorithms” (Valenzuela 2018).
Day 2: Integrating nature of technology
The nature of technology (NOT) encourages students to take a more critical stance toward technology so they can make more informed decisions about technology (Kruse et al. 2017). One way to get students thinking about the limitations of technology is to ask, “How did the simulation limit our investigation? What were some things it couldn’t do?” This question scaffolds students by incorporating their prior knowledge and utilizing a concrete shared experience. Example answers students gave included: “only uses transverse waves,” “lacks energy measurements,” and “uses a discrete line rather than a continuous line.” We then ask students, “What are some limitations of cell phones?” Students typically start shallow by noting that their batteries run out or sometimes they don’t have service. So we push them further by asking, “What are some limits or problems of cell phones even when they are working well?” After some time, students start to tentatively speculate that conversations on a cell phone can never include touch (e.g., hugs). The purpose of this discussion is to have students develop a more critical awareness of technology and to show that all technology has benefits and drawbacks.
Below are questions to deepen students thinking on NOT ideas that are applicable to the lesson. The questions can be asked at any point during the lesson to both whole class and small groups.
T: How does technology limit the kind of data scientists collect?
S: It would be difficult for technology to collect data that requires seeing or feeling.
S: I think it would limit scientists to only think numerically.
T: Why should we be critical of technology?
S: Technology can make mistakes or needs to be debugged.
S: Takes away from human interaction.
S: Technology can fail when not properly taken care of.
S: Computer Programming can be incorrect or corrupted.
T: How does technology help advance science?
S: Technology can help scientists in their investigations to further explore a field. Like, when engineers built telescopes scientists were better able to investigate space.
T: Therefore technology can help you see, hear, and even smell by capturing gasses.
T: How does science help advance technology?
S: The thing scientists learn helps new technologies get developed.
S: Science is the catalyst of what technology can become.
Students better relate to NOT by first considering the NOT idea to activities they’ve completed and then apply to larger ideas (Kruse and Wilcox 2013). Furthermore, by moving from something they do not care much about to more personal technologies (e.g., cell phones), we can account for some of the emotional attachment that might hinder students’ engagement with NOT ideas (Clough 2013; Kruse 2013).
Conclusion
We have found that integrating computer science standards into our science curriculum can sometimes benefit student learning of both sets of standards. Yet, we as teachers teach much more than the standards. For example, throughout this lesson, students are connecting computational and scientific thinking while being analytical and critical of technology. Making these connections between technology and science can help students better understand how scientists work and can better prepare them to be informed citizens.
Molly Rockefeller (mollyrockefeller1@gmail.com) is a grade 6–8 STEM Teacher at Bondurant-Farrar Community School District. Jerrid W. Kruse is an associate professor in the Department of Teaching and Learning at Drake University in Des Moines, Iowa.
Computer Science STEM Middle School