
feature
Putting the Energy Into Concept Development
Teaching Thermal Energy With Science and Engineering Practices
CONTENT AREA Physical Science
GRADE LEVEL 6–8
BIG IDEA/UNIT Thermal energy is determined by both the temperature and mass of a substance
ESSENTIAL PRE-EXISTING KNOWLEDGE Familiarity with the concepts of energy and temperature
TIME REQUIRED 4 Days
COST $50 (one time cost for thermometers and fish tank)
SAFETY Hot liquids will be handled using heat-resistance gloves and safety goggles.
Labs allow students to deeply investigate phenomena on which their conceptual understanding of science is built (Achieve 2017). Although laboratory investigations create many opportunities for student learning, teachers must help students make sense of their laboratory experiences. Teachers also play a crucial role in developing students’ science and engineering practices (SEPs; Furtak and Penuel 2019). Teaching SEPs is not simply a matter of giving students a set of procedures to follow (Ford 2015; Miller et al. 2018). Instead, teachers need to guide students toward more sophisticated ways of engaging in the SEPs, as well as help students reflect on their laboratory experiences to deepen their knowledge of the SEPs (Furtak and Penuel 2019; Manz and Renga 2017).
In this article, we describe how we have used laboratory experiences to develop students’ understanding of both science concepts and practices. We illustrate key principles using the context of a 5E laboratory activity that addresses concepts about heat and temperature (partially addressing MS-PS1-4) and that we use to specifically target the SEP of Analyzing and Interpreting Data. This activity sits within a larger unit that addresses ideas about heat, temperature, and particle movement. The activity uses simple materials and is likely familiar to many readers. That’s because our emphasis is not on the activity itself, but on how we used it to pursue student meaning-making. Given that focus, we provide a detailed description of the explain portion of the 5E; our discussions of the other portions are brief.
Engaging with a puzzling question (Day 1)
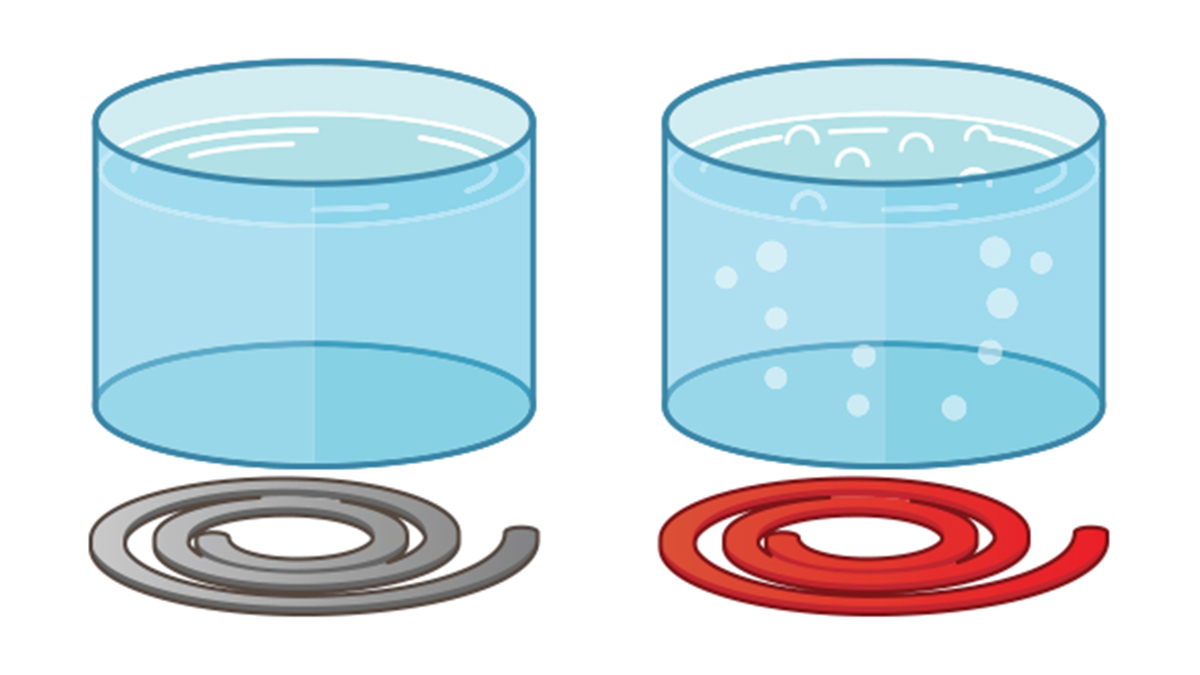
To engage students, we show students a beaker with 100 ml of boiling water (100°C) and a 10-gallon fish tank at room temperature (~23°C). We ask, “Which of these do you think has more thermal energy, and why?” and we have students discuss the question in groups of four. After a minute or so of small-group discussion, we bring students back together to talk about their ideas. In our experience, we get a variety of views in every class, but the majority of students think the boiling of water has more thermal energy because it’s at a higher temperature. We tell students we are going to engage in a lab to help them gather evidence to determine which container has the most heat. This introductory discussion often runs about 15 minutes.
Exploring heat and temperature (Days 1–2)
In this phase, we introduce students to the kinds of materials that are available to investigate this phenomenon further, including plastic containers, beakers (100 ml, 250 ml, 500 ml), hot plates, ice, and thermometers. We then help students think about how they could use these materials to investigate thermal energy. We establish that if we were to mix a small volume of hot water with a larger reservoir of cold water, we can learn something about how much thermal energy the hot water had by measuring the temperature increase of the cold water. We then work with students to develop a laboratory procedure that would let them systematically test what happens when hot water of varying volume/temperature is added to a cold water reservoir of consistent volume/temperature. We have the students decide exactly how many trials to run while assisting them with questions such as, “What might be the value of running a greater number of trials?” and “What are the drawbacks of running more trials?” This discussion often takes 20–30 minutes, and typically we plan to have students collect data during the next day’s class.
Figures 1 and 2 show examples of the materials that we have used for this investigation. In this case, the cold water reservoir has a volume of 500 ml and is drawn from an ice/water mixture. In each trial, students add 100 ml or 200 ml of water heated by a hot plate. We have found that the Vernier digital thermometers are particularly useful here because they allow students to see when the final temperature has been reached. Figures 1 and 2 show an example of a trial with 200 ml of 60°C water, before and after being added to the reservoir. An example set of data collected using these materials is provided in Table 1.
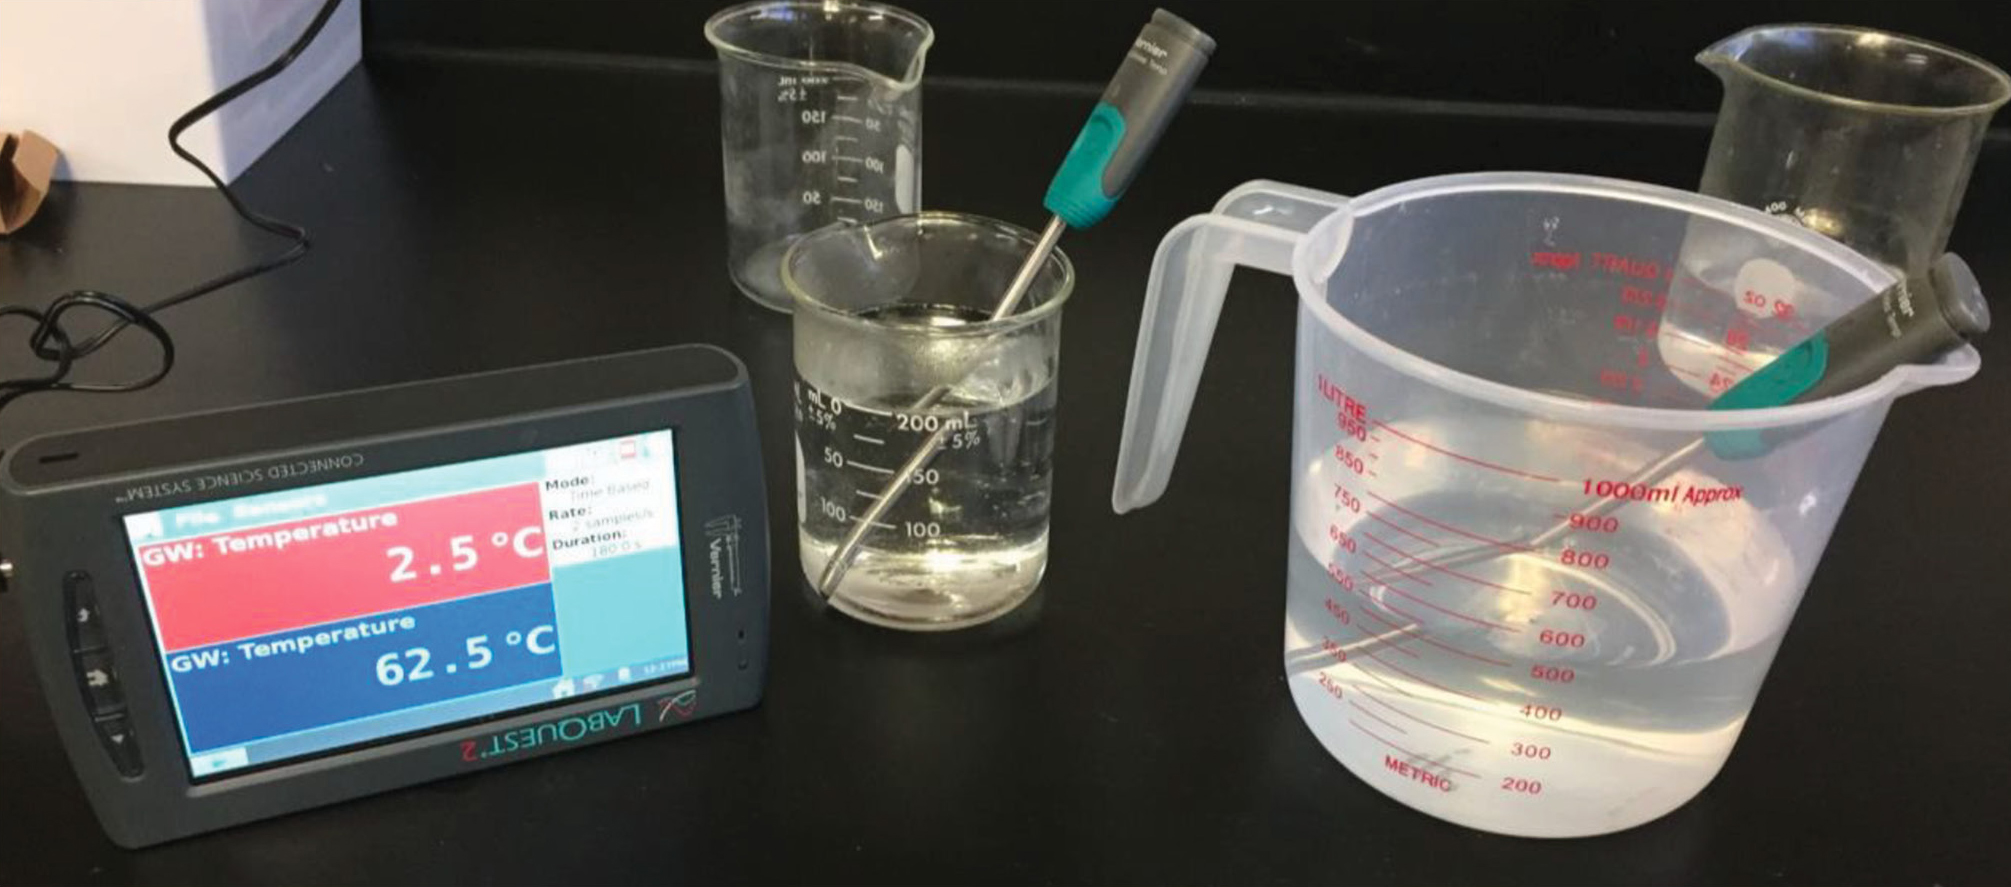
Hot water about to be added to the cold water reservoir.
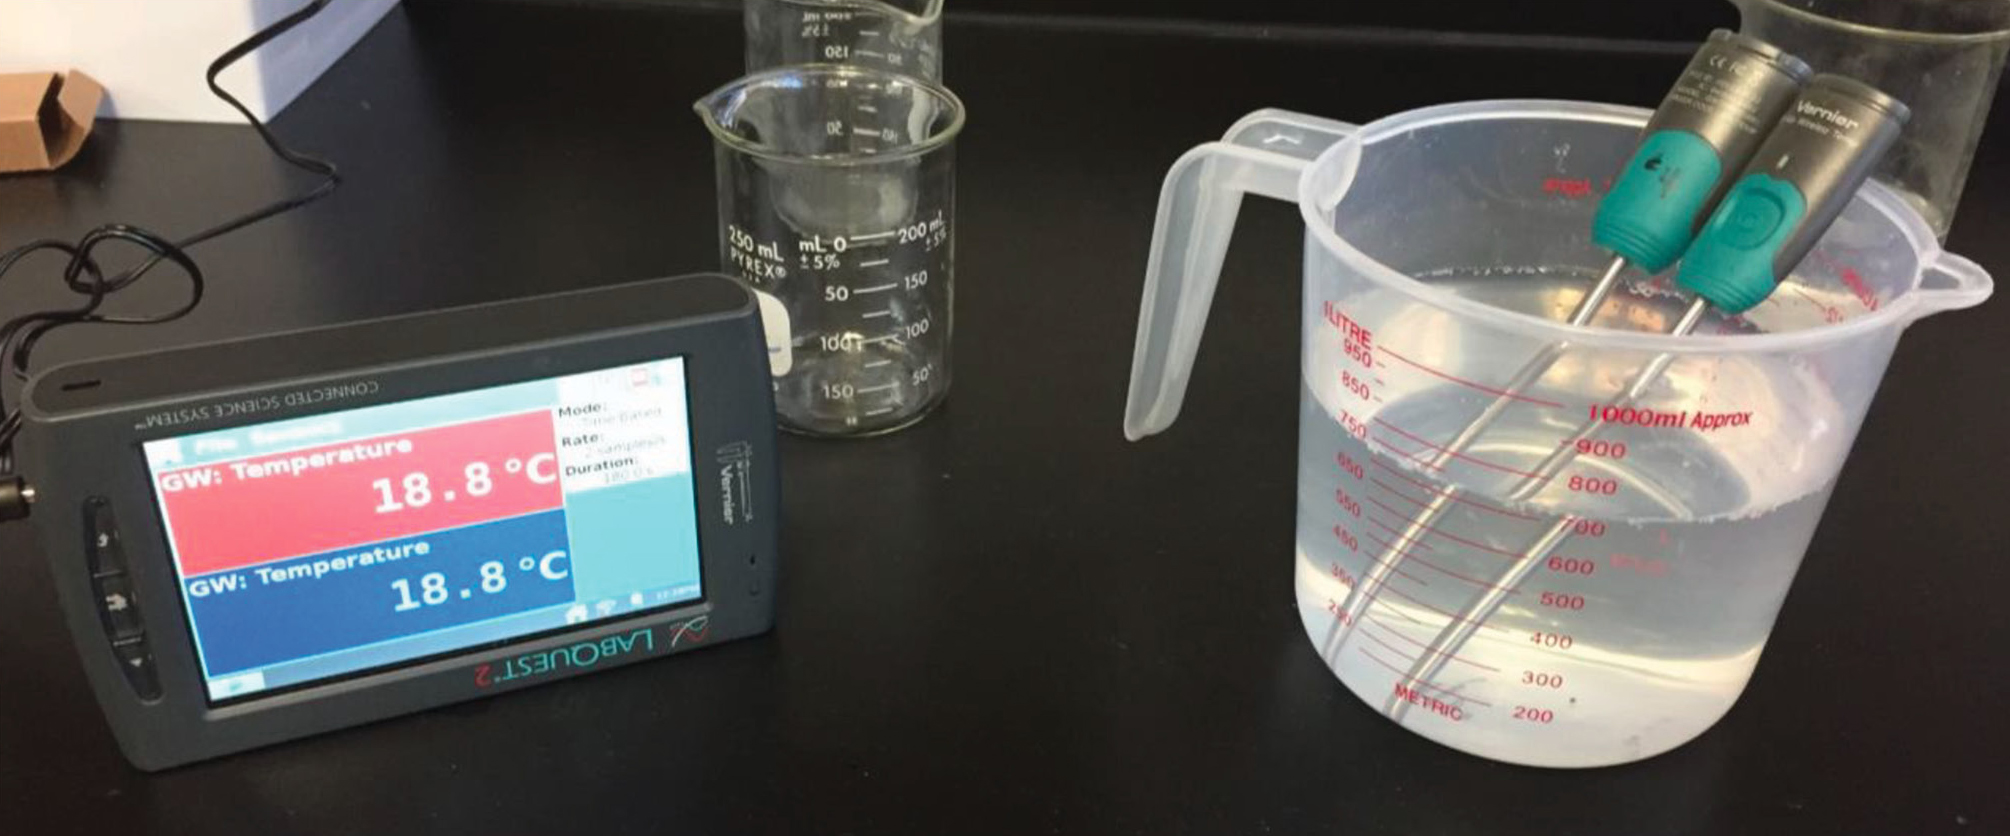
Final temperature after mixing hot and cold water.
Prior to distributing the materials to students, we discuss potential safety issues posed by hot plates and how to ensure that hot water is handled with care. We demonstrate the proper handling of hot glassware using heat-resistant gloves and safety goggles. We also emphasize that the temperature of a hot plate cannot be determined visually and that it might be very hot even if it is not plugged in.
We have students work in pairs or groups of three to collect their data. We prefer pairs so that all students are fully engaged with the materials (rather than simply observing their classmates, which typically leads to off-task behaviors) and to reduce crowding around each lab station (which creates safety concerns given the hot liquids being moved about). This group size also allows us to accommodate students who might not be able to physically manipulate the materials. We require each group to plan out the role that each group member will have during the lab and how they will maintain a safe environment. The data collection often takes the majority of a class period, depending on the number of trials students choose to run.
Explaining thermal energy (Day 3)
The day after students have collected their data is dedicated to interpreting their results. To help students get started in identifying patterns, we start by helping students think about the temperature change by asking, “You recorded the starting temperature and the final temperature. How would we figure out how much the temperature changed?” Students often say, “We could just subtract the final temperature from the starting temperature.” We have students calculate that new quantity for their data, and similarly guide students to calculate the initial temperature difference between the hot and cold water (see Table 1). We then ask, “Why do you think scientists would use strategies like this?” Students mention that it’s easier to see how much things change. We point out that calculating new quantities is a common strategy that scientists use to make sense of their data.
Next we ask, “What patterns are you noticing that might be causing the reservoir temperature to rise?” We have students work in groups for a few minutes. As they work, we walk around the classroom and differentiate the process by asking scaffolding questions to groups who need assistance. For instance, we might ask students to look closely at two trials that used the same temperature of hot water but different volumes and explain what they notice about how the temperature increase compares between the two. When we return to the large group, students recognize that when you add hotter water (larger temperature difference) to the reservoir, you end up with a greater temperature increase. Students also typically point out that adding more water will also result in a greater temperature increase. We help students relate each pattern to what is going on in terms of thermal energy, focusing especially on the relationship between volume and thermal energy, because we know that idea isn’t intuitive. We ask, “Why do you think a larger volume of warm water causes a greater temperature increase?”
To help students make connections to key science ideas, we remind them of the definition of temperature from a prior lesson (temperature describes the average kinetic energy of particles in a substance). We then have students draw a model of the particles in the larger volume and smaller volume. While students are drawing, we walk around, observe, and scaffold students who need assistance. After students make the drawings, we point out that those particles are in motion and thus have kinetic energy, and we then ask, “What must be true about the total kinetic energy of the particles in the larger volume of water?” Students readily recognize that more particles mean more kinetic energy, and here we indicate that what we have been calling thermal energy is nothing more than the total kinetic energy of the particles. We now return to the pattern in the data and ask students, “Based on what we have just discussed, why does it make sense that adding a larger volume of warm water results in a greater increase in temperature?”
After we are confident students understand the key concepts, we draw their attention to the SEPs of Analyzing and Interpreting Data and Developing and Using Models. We ask, “Why was it useful for you to draw a picture of the particles?” Students note that visualizing the particles helped them think about the energy. We then ask, “Why does interpreting data not only mean looking for patterns, but also making sense of patterns?” Students often note that they can find patterns, but you also have to have ideas about why that pattern happens.
We also draw students’ attention to errors and uncertainties in their data. For example, the reservoir was not exactly the same temperature for each trial, nor was the warm water exactly at the intended temperature. We discuss with students why those might be issues, and we emphasize the importance of thinking about errors anytime we make sense of data. Errors and uncertainties are unavoidable, and the question is whether they are significant enough to affect our ability to make sense of the data. In this case, students usually agree that the errors are minor enough that we can move forward.
We now bring students back to the question that started this inquiry: whether a boiling beaker has more thermal energy than an aquarium. Students now know that both temperature and volume matter, but haven’t fully resolved this issue yet. We indicate to students that they can use their data to figure this out and give them the following tasks to complete in their groups:
1.What evidence do you have in your data that a lower temperature container of water can have more thermal energy than a higher temperature one?
2.Use the data you have collected to make and defend a claim about the boiling beaker versus aquarium situation.
Before students get started, we ask, “Why might looking at pairs of trials be more useful than attempting to look at your whole data set?” Students often note it’s easier to understand if you are using fewer things at a time. Students then begin looking through the data in order to make and defend a claim about the boiling water in the beaker and the aquarium. For students that need more assistance, we provide sentence starters such as “Based on _____evidence, I think____” and a condensed data set. After about 5 to 10 minutes of discussion and writing, students realize there are many places in the data set where a larger volume of cooler water has more thermal energy than a smaller volume of hotter water. Using that observation, most groups defend the claim that “the aquarium has more thermal energy than the beaker.”
Elaborating with liquid nitrogen (Day 4)
To help students apply their new understanding, we do a demonstration with a racquetball and liquid nitrogen. Videos on YouTube are also available if a teacher doesn’t have access to liquid nitrogen. The racquetball was kept in a freezer overnight and so has a temperature of about –18°C. We ask students, “If this ball is –18°C, what do you think is true about its thermal energy?” Students often think it is cold, so it won’t have thermal energy, or that the particles won’t be moving much. At this point, we pull out a dewar of liquid nitrogen. We ensure that we follow all safety protocols including that there is a plexiglass shield between the front of the room and the students, that there is adequate spacing from the students and the table, that students are wearing safety goggles, and that we (the teachers) wear proper personal protective equipment (e.g., safety gloves, apron, safety goggles). We carefully place the racquetball into the liquid nitrogen using tongs, and students quickly note that the liquid nitrogen is boiling. We show the students the racquetball and ask, “The liquid nitrogen is about –196°C, so what do you think just happened to the thermal energy of the racquetball?” Students note that the thermal energy must have been transferred because the ball got colder and the liquid nitrogen boiled. We then return to the initial question, and students begin to realize the ball did have thermal energy, even if it was less than the thermal energy of a room-temperature ball.
Evaluate
To evaluate students’ understanding, we give them an assessment (see Supplemental Materials) that requires students to apply their knowledge of the targeted concepts and science practices. We often assess this using a standards-based grading rubric (Wilcox 2011).
Conclusion
As much as we might wish that our students would automatically reach the intended conclusions from our laboratory activities, we know that things are not so simple! Students interpret their experiences in varied and often unanticipated ways (Lunetta, Hofstein, and Clough 2007). In our description of this activity, we have illustrated deliberate steps we took to ensure that students moved toward our learning objectives—which included both science concepts and practices. Below, we highlight several strategies that we often use to help us.
Write logical sequence for concepts and practices
To plan how we were going to help students make sense of our targeted concepts and practices, we created a detailed map of the logical sequence in this activity (see Figure 3). By having a clear sense of each piece of the logical chain, we were better able to figure out what we needed to do to guide students’ thinking.
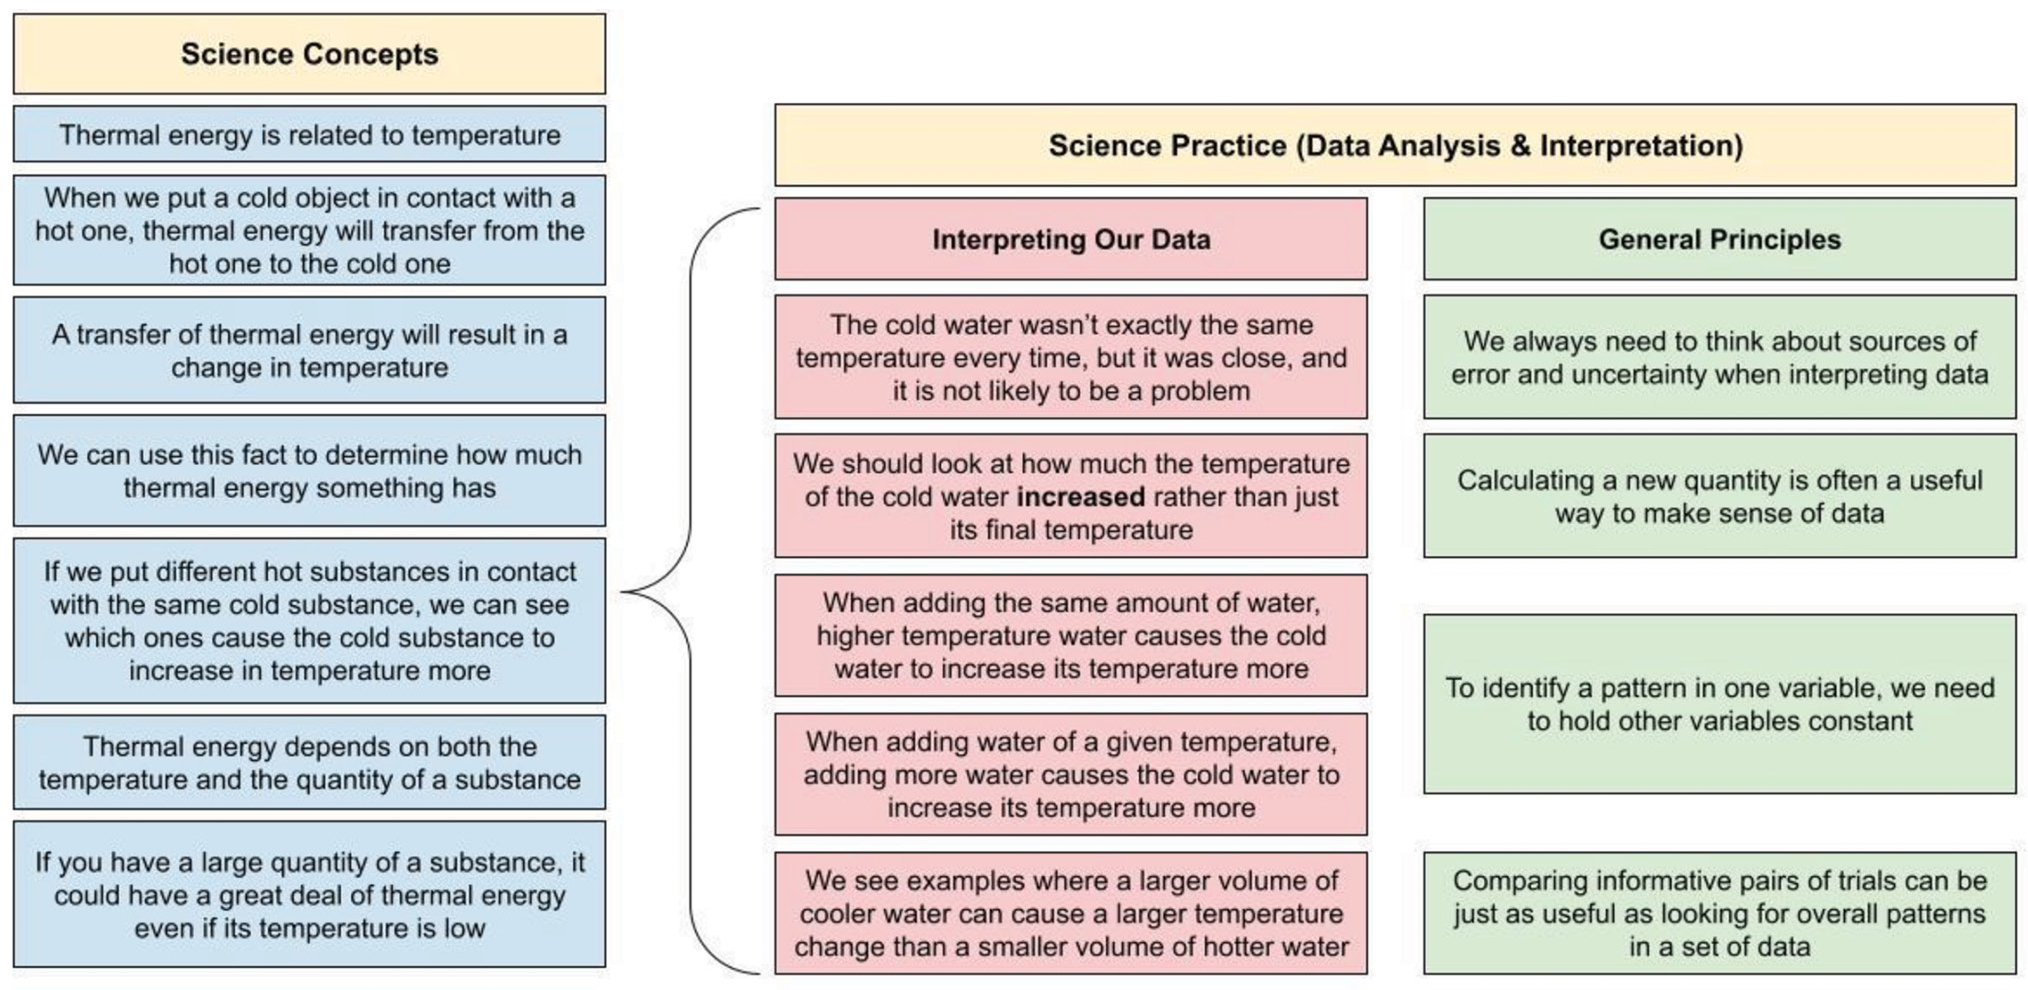
Map of the logical sequence in this activity.
Target each idea in the sequence
We never assume that all of our students will make the necessary logical connections shown in Figure 3. Therefore, throughout the investigation, we asked students questions that explicitly targeted each part of the logical sequence. We also introduced new information to students when it was timely and highly relevant to the key idea we were targeting (Edelson 2001).
Provide scaffolding and supports
To ensure we are supporting all of our students, we plan opportunities to scaffold students’ thinking. We interact with students while they are in small groups to assess their thinking and help them make connections. As needed, we differentiate the learning process by providing targeted supports (e.g., sentence starters) and by giving students a range of work environments (e.g., at their desks or lab tables, in groups or individually).
Give it time
Laboratory investigations require a substantial time investment, especially in terms of helping students make sense of the experience. Often, data interpretation requires more time than data collection—evident in the complex reasoning shown in Figure 3. This requires not only instructional time, but also planning time. We typically spend more time planning how we are going to help students make sense of a lab than we do planning any other part of the activity. •
Supplemental Materials
Assessment and standards-based grading rubric—https://bit.ly/397kEvN
Connecting to the Next Generation Science Standards—https://bit.ly/3NiPlNd
Jacob Pleasants (jacob.pleasants@ou.edu) is an assistant professor of science education at the University of Oklahoma in Norman. Jesse Wilcox (jesse.wilcox@uni.edu) is an assistant professor of biology and science education at the University of Northern Iowa in Cedar Falls.
Disciplinary Core Ideas Physical Science Middle School