
The Science Project Portfolio
Science Scope—March 2019 (Volume 43, Issue 7)
By Joan Hedman and Brooke A. Whitworth
Transform the science fair experience into an authentic summative assessment.
The phrase science fair project likely conjures up images of students working independently on smoldering model volcanoes, catapults, and Rube Goldberg contraptions. To create their projects, students and teachers blindly follow a set of seemingly incomprehensible steps, assembling various pieces. This process continues until the due date arrives, when all the pieces are packaged up for the science fair. Teachers are then expected to assess all the projects in a timely manner while somehow continuing to deliver their curriculum. Eventually, the student receives feedback and, often, a semester-making grade. By that time, everyone is exhausted and relieved it’s over.
A science fair project supposedly improves student motivation and ownership by giving students control of their learning (McComas 2011). However, there are at least a few issues with science fair projects. Even supporters of traditional science fairs acknowledge that students should not work on the entire project by themselves (McComas 2011). The vast majority of students are not motivated by science fairs (Fisanick 2010). Plus, participation in a science fair does not increase students’ knowledge or understanding of science (Osborne 2012).
This article describes our student project portfolio for seventh- and eighth-grade science that seeks to address these concerns with science fair projects. Each student portfolio contains the same set of components, but each student develops their own experiment based on personal interest. Student support—including schedules, lessons, work examples, and templates—accompanies each step of the project as students explore and apply the science and engineering practices. Because portfolios are broken down into components, it is much easier for students to complete assignments and for the teacher to provide feedback to students. Multiple revisions are encouraged. After receiving feedback on an assignment, students can reflect on and revise their work. Portfolio component due dates can be aligned with a school district’s science project due dates so students have ample time to submit their work, receive feedback, and make any necessary revisions. The portfolio’s culminating works (a report and presentation) are authentic summative assessments, encapsulating student learning over a well-defined set of learning goals and performance objectives.
Portfolio description
During the second week of school, students are given a written description of the portfolio process to share with their parents at home. The portfolio description includes the following objectives: To provide support and feedback to students as they work on their science fair projects. To reduce stress among parents and students. To improve learning experiences for students. To provide a positive family experience.
Portfolio components
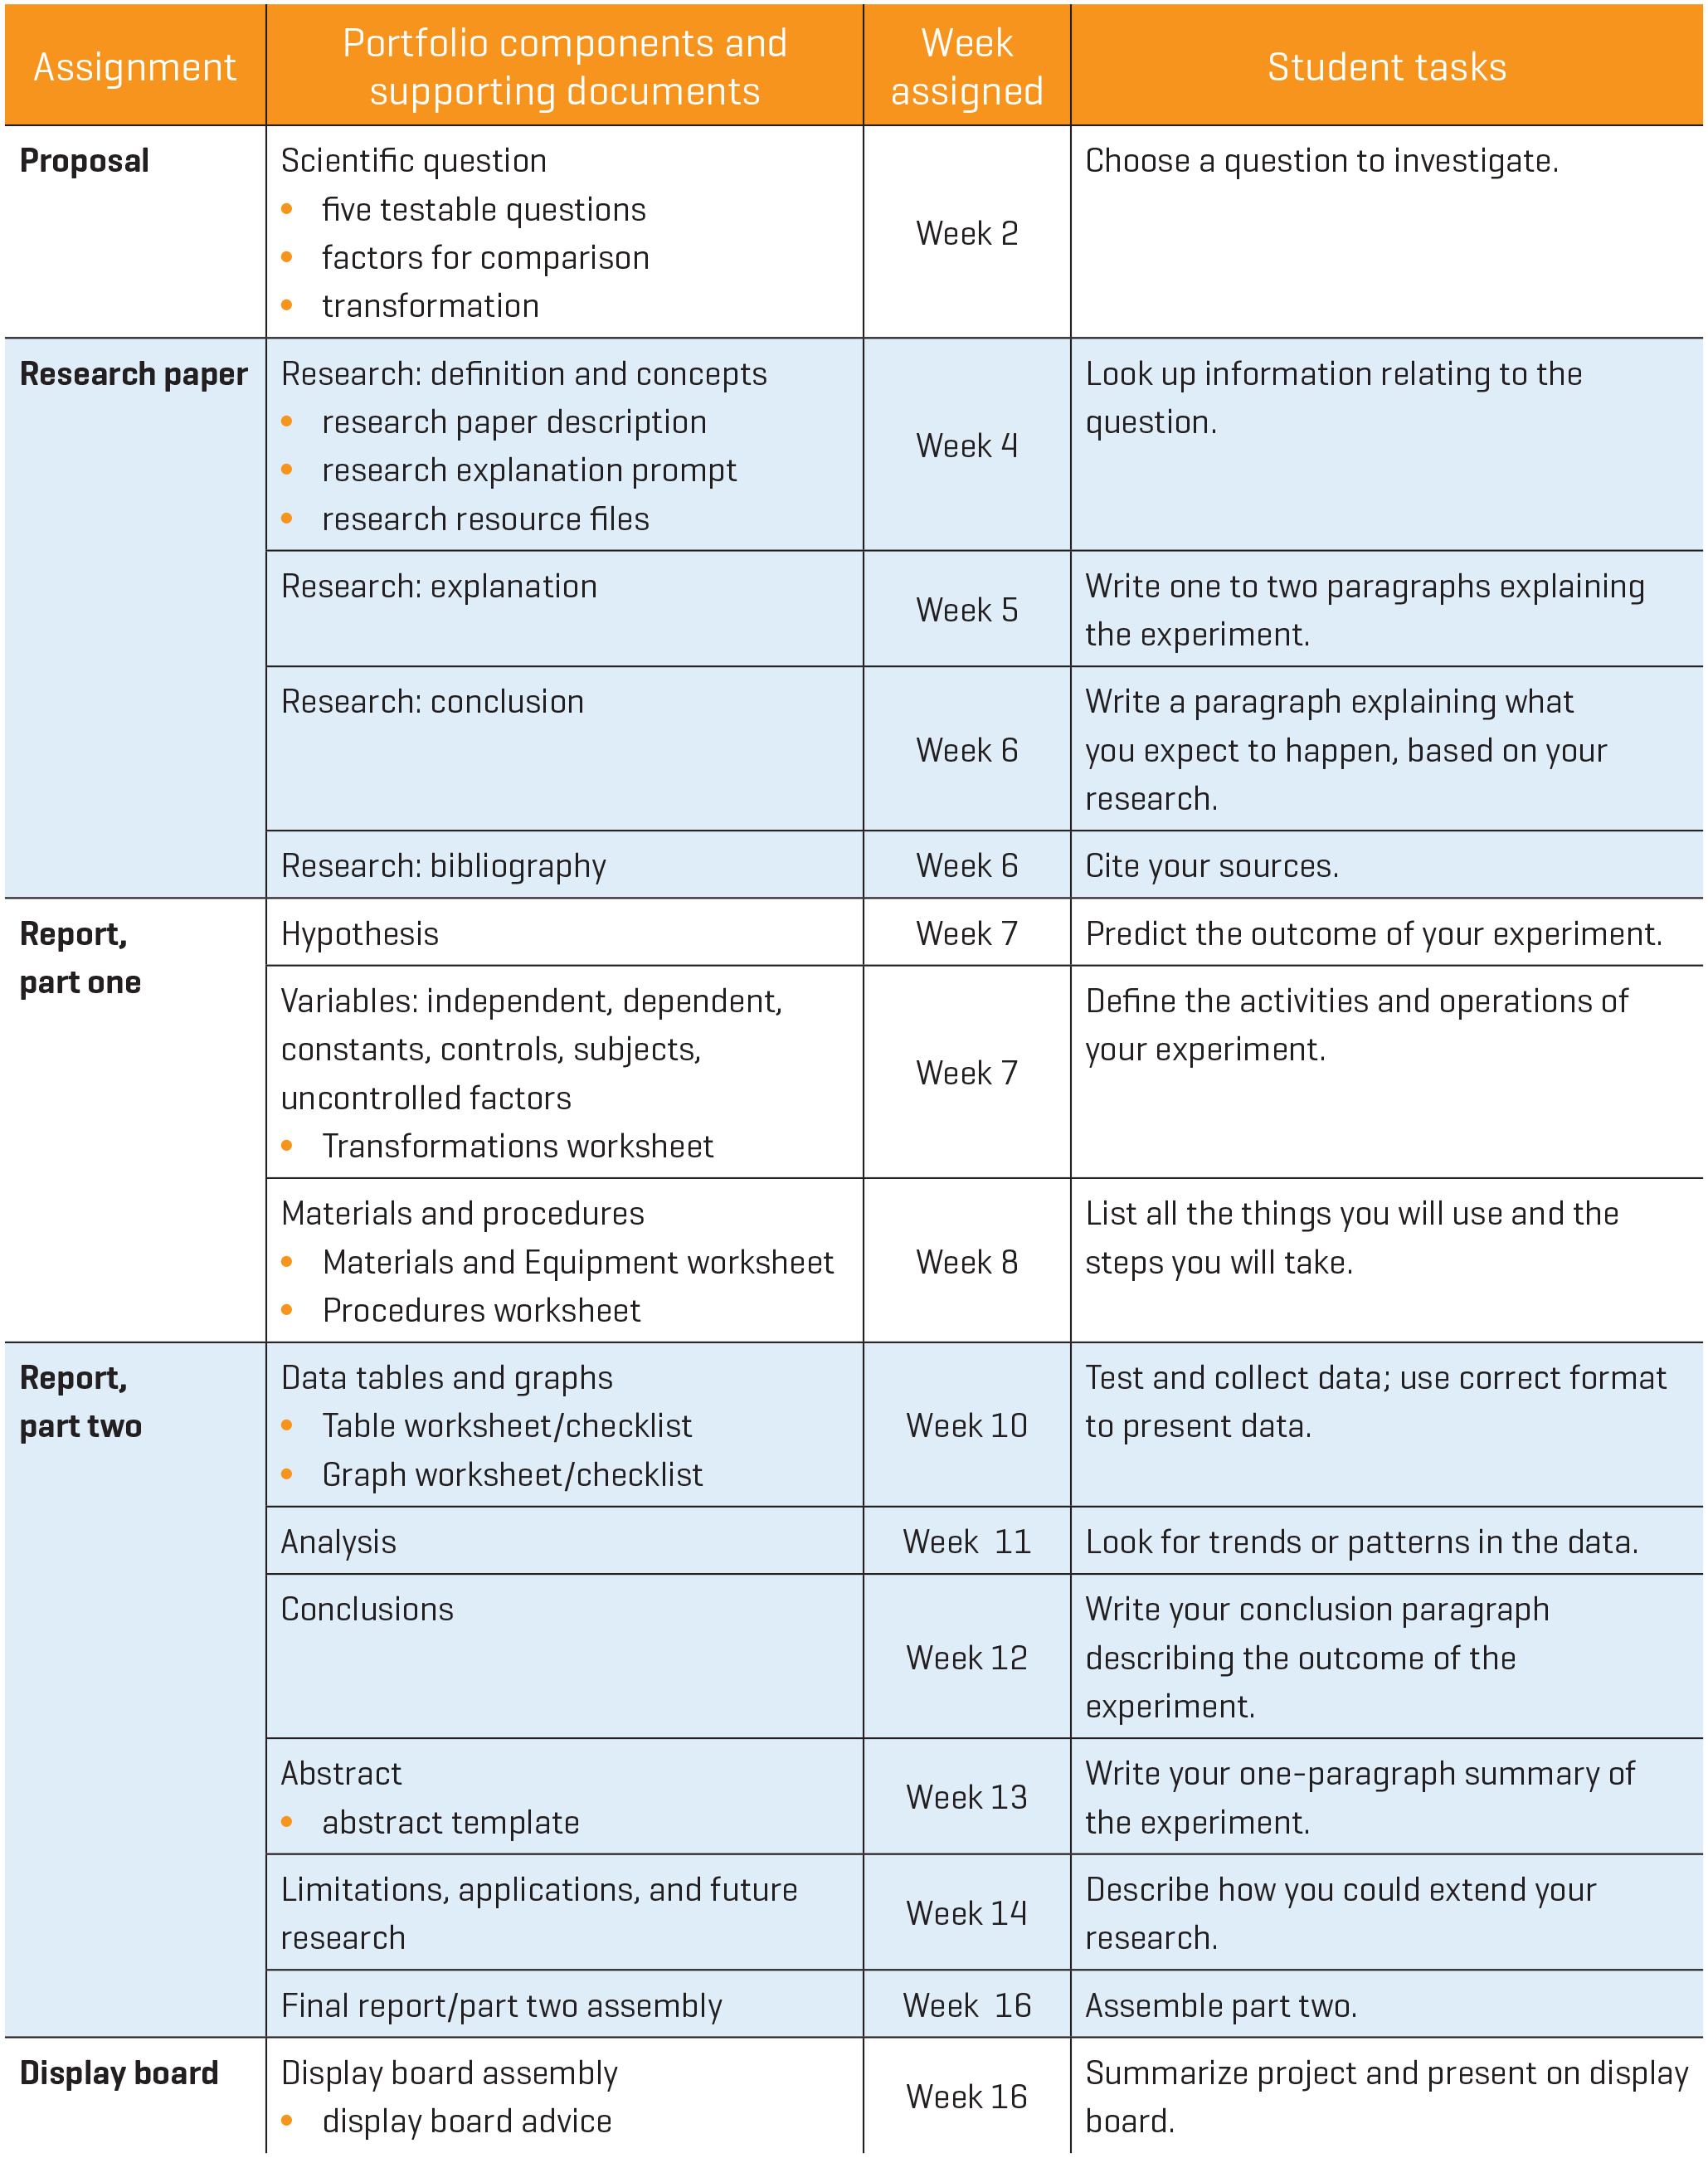
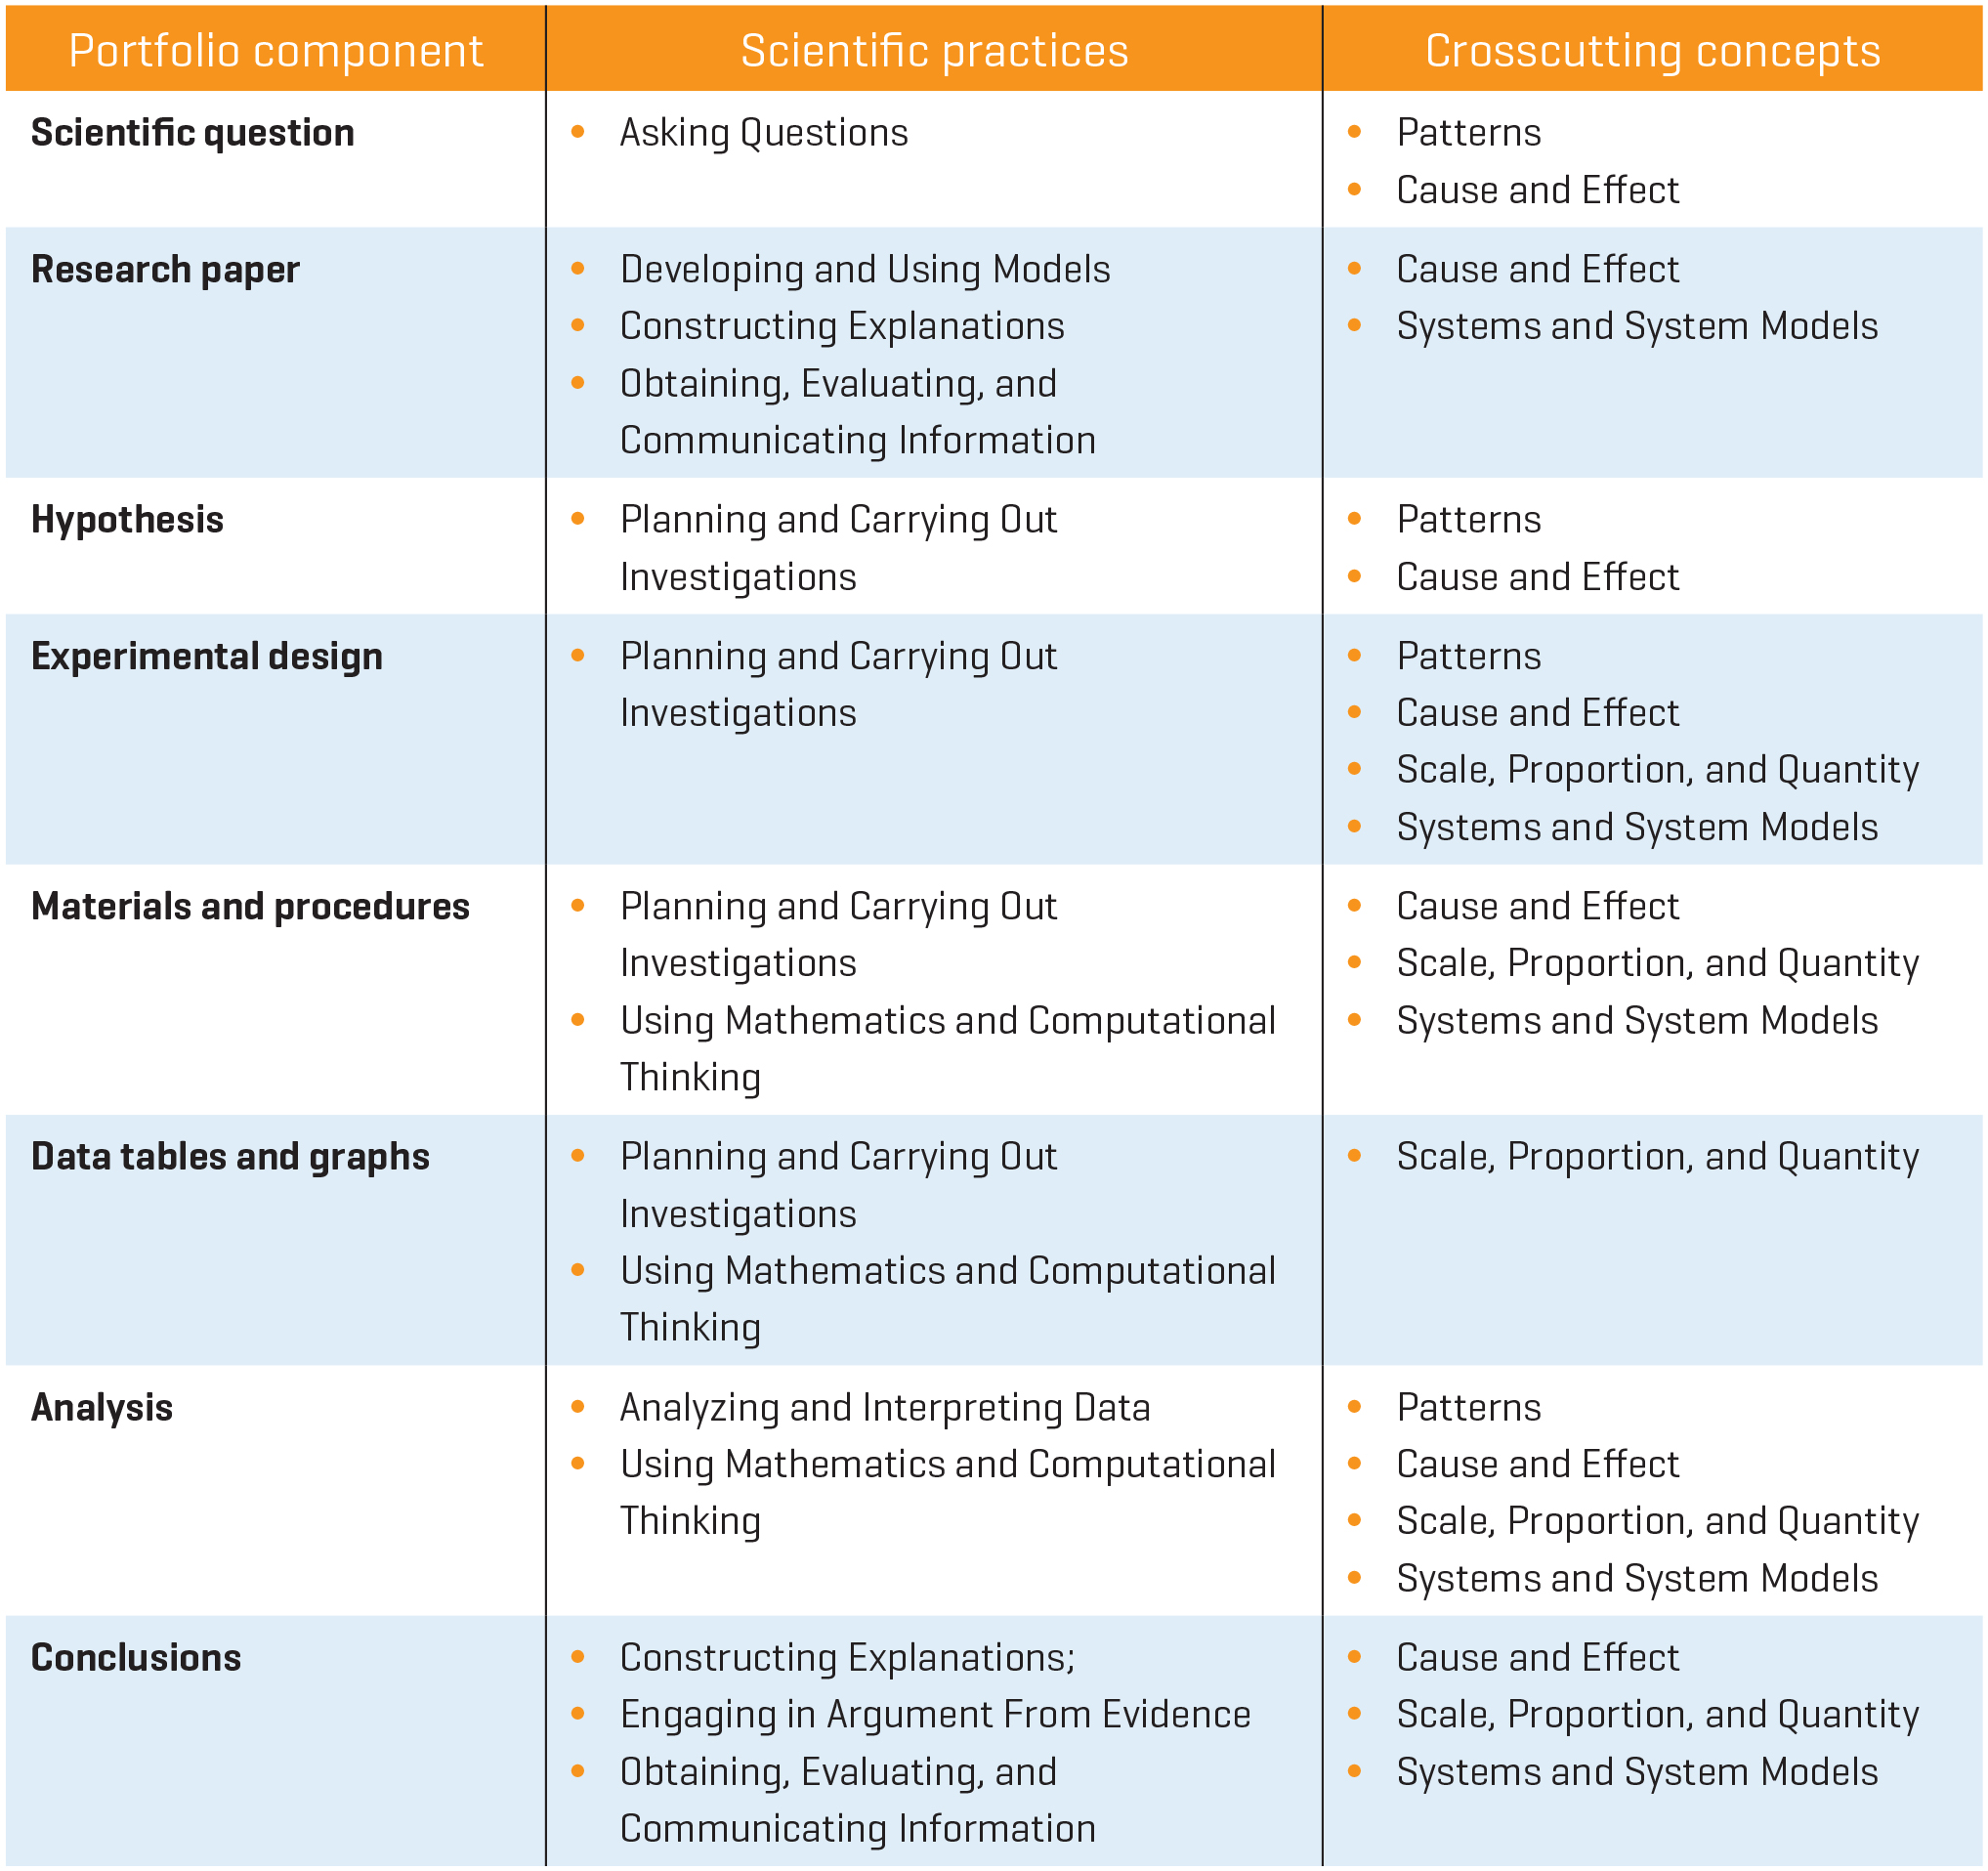
Students’ graded assignments are a project proposal, a research paper, part one of their final paper (including introduction, experimental design, and methods), part two of the final paper (including their abstract, data, analysis, and conclusions), and a project display board. There are several portfolio assignments associated with each graded assignment. Figure 1 summarizes the portfolio components while Figure 2 shows how each portfolio component incorporates the Next Generation Science Standards science and engineering practices (NGSS Lead States 2013). Each portfolio component is described below.
Project proposal
For two to three weeks, students identify their interests and develop their scientific questions. It is important for students to be interested in the topic they choose, but it is equally important for their question to be practicably testable. Students begin by generating five testable questions, and then narrowing down their interest using the Comparative Questions and Four Questions worksheets (see Online Supplemental Materials). These worksheets, along with the Transformations worksheet (see Online Supplemental Materials), help students identify their independent and dependent variables and discover how they will conduct their experiment. The Transformations worksheet is specifically designed to turn students’ interests into an experimental design. Along with the Factors for Comparison worksheet (see Online Supplemental Materials), it helps students identify their independent and dependent variables, along with constants, controls, and any uncontrolled factors. With this information, students can successfully complete a project proposal.
Research paper
The research paper is the most difficult part of the process for students and their parents. Few junior high students have ever had to write this type of paper before. That is why this component is supported with its own sub-schedule and supporting information (see Online Supplemental Materials). In addition, the Research Explanation Prompt worksheet (modeled after Creswell 2014) helps to clarify student thinking on this topic (see Online Supplemental Materials). The research directory (see Online Supplemental Materials) provides grade-level appropriate resources to give students a reasonable starting point for their research. Students are assigned one paragraph each week to allow time for feedback, reflection, and revision. Students are also instructed on proper citation methods to help them assemble a works cited page. To streamline grading and feedback, a set of the most common comments for each section was developed and assigned codes. Each student receives a copy of the comment codes (see Online Supplemental Materials), from which they can easily interpret feedback on their work or rubric.
Report (part one)
The process of writing the research paper helps students develop their purpose and hypothesis, along with the Transformations worksheet. Again, experimental design is typically an area of confusion for students; feedback is essential at this stage so that corrections can be made early. Materials and Procedures sections are supported with worksheets (see Online Supplemental Materials) and detailed examples as well. As we go through the process with students, we use a sample project— how plants react to different amounts of light—to discuss with students how to progress through that portion of the project.
Report (part two)
Presentation of data is another challenging area for students. Table and graph examples and in-class practice of designing data tables will help students display their data appropriately. Checklists for tables and graphs (see Online Supplemental Materials) are provided. Direct instruction addresses any concerns about the remaining sections of the report, including analysis, conclusions, limitations, applications, and future research.
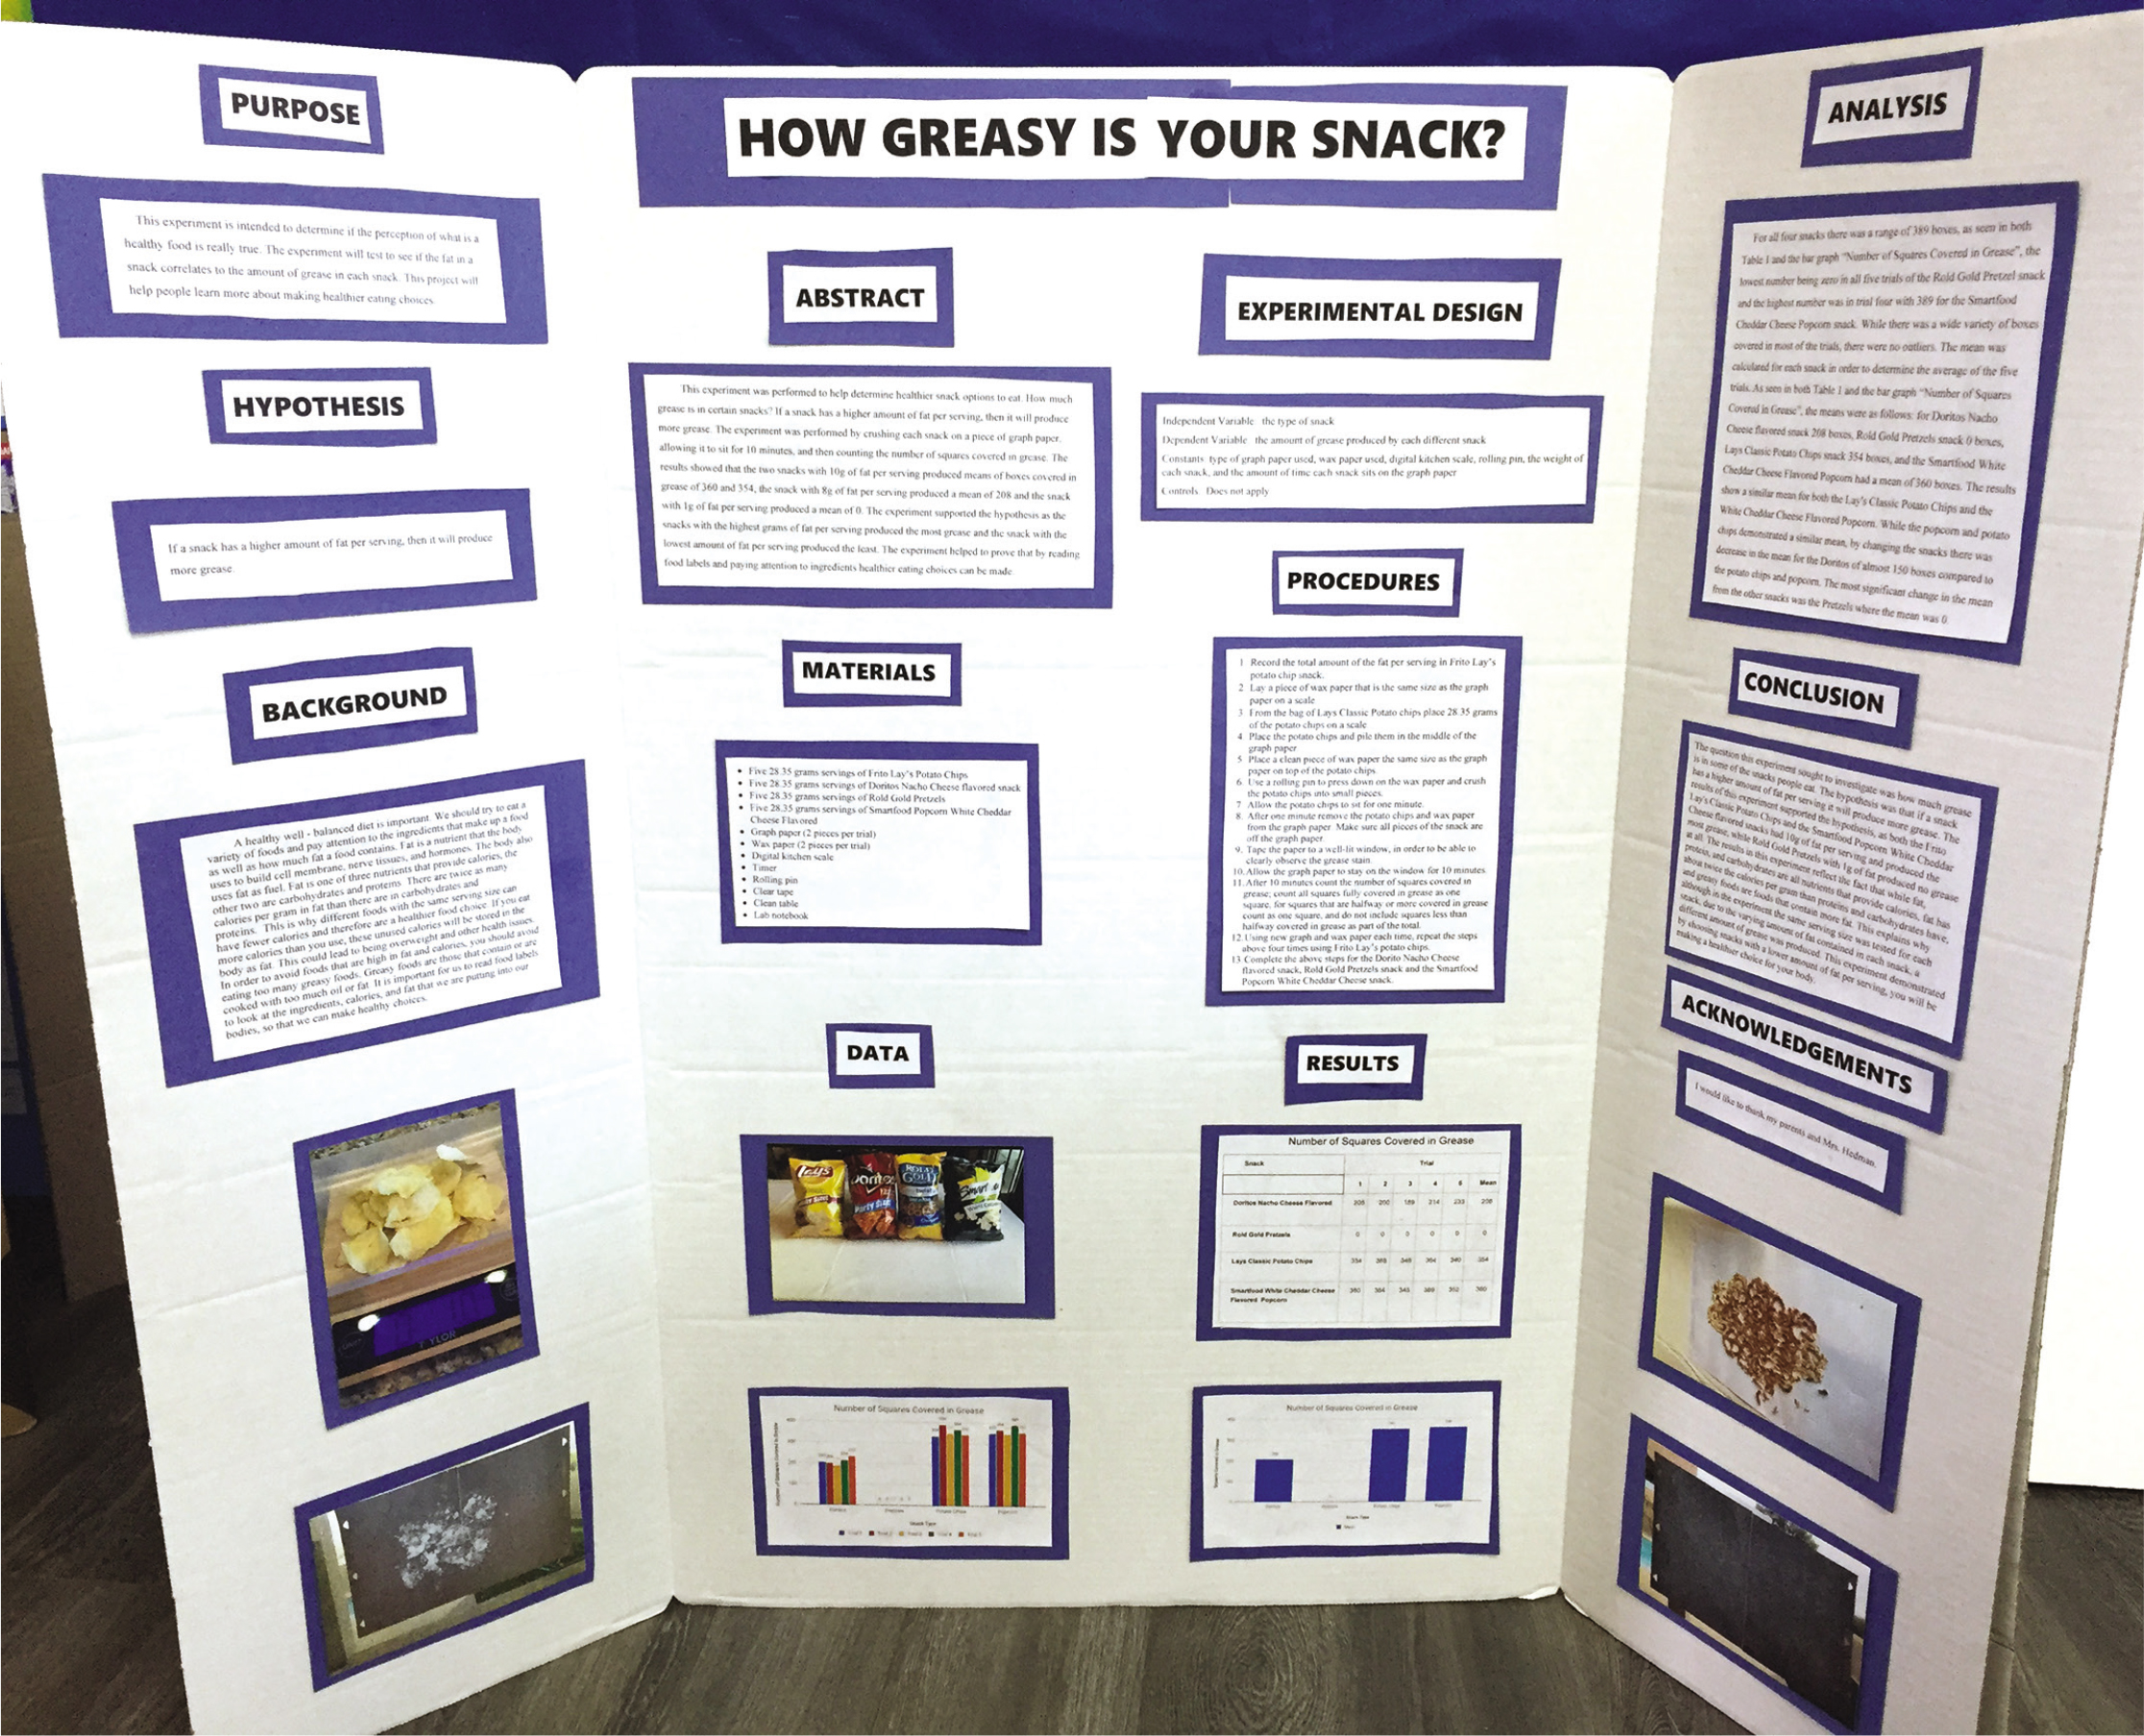
Display board
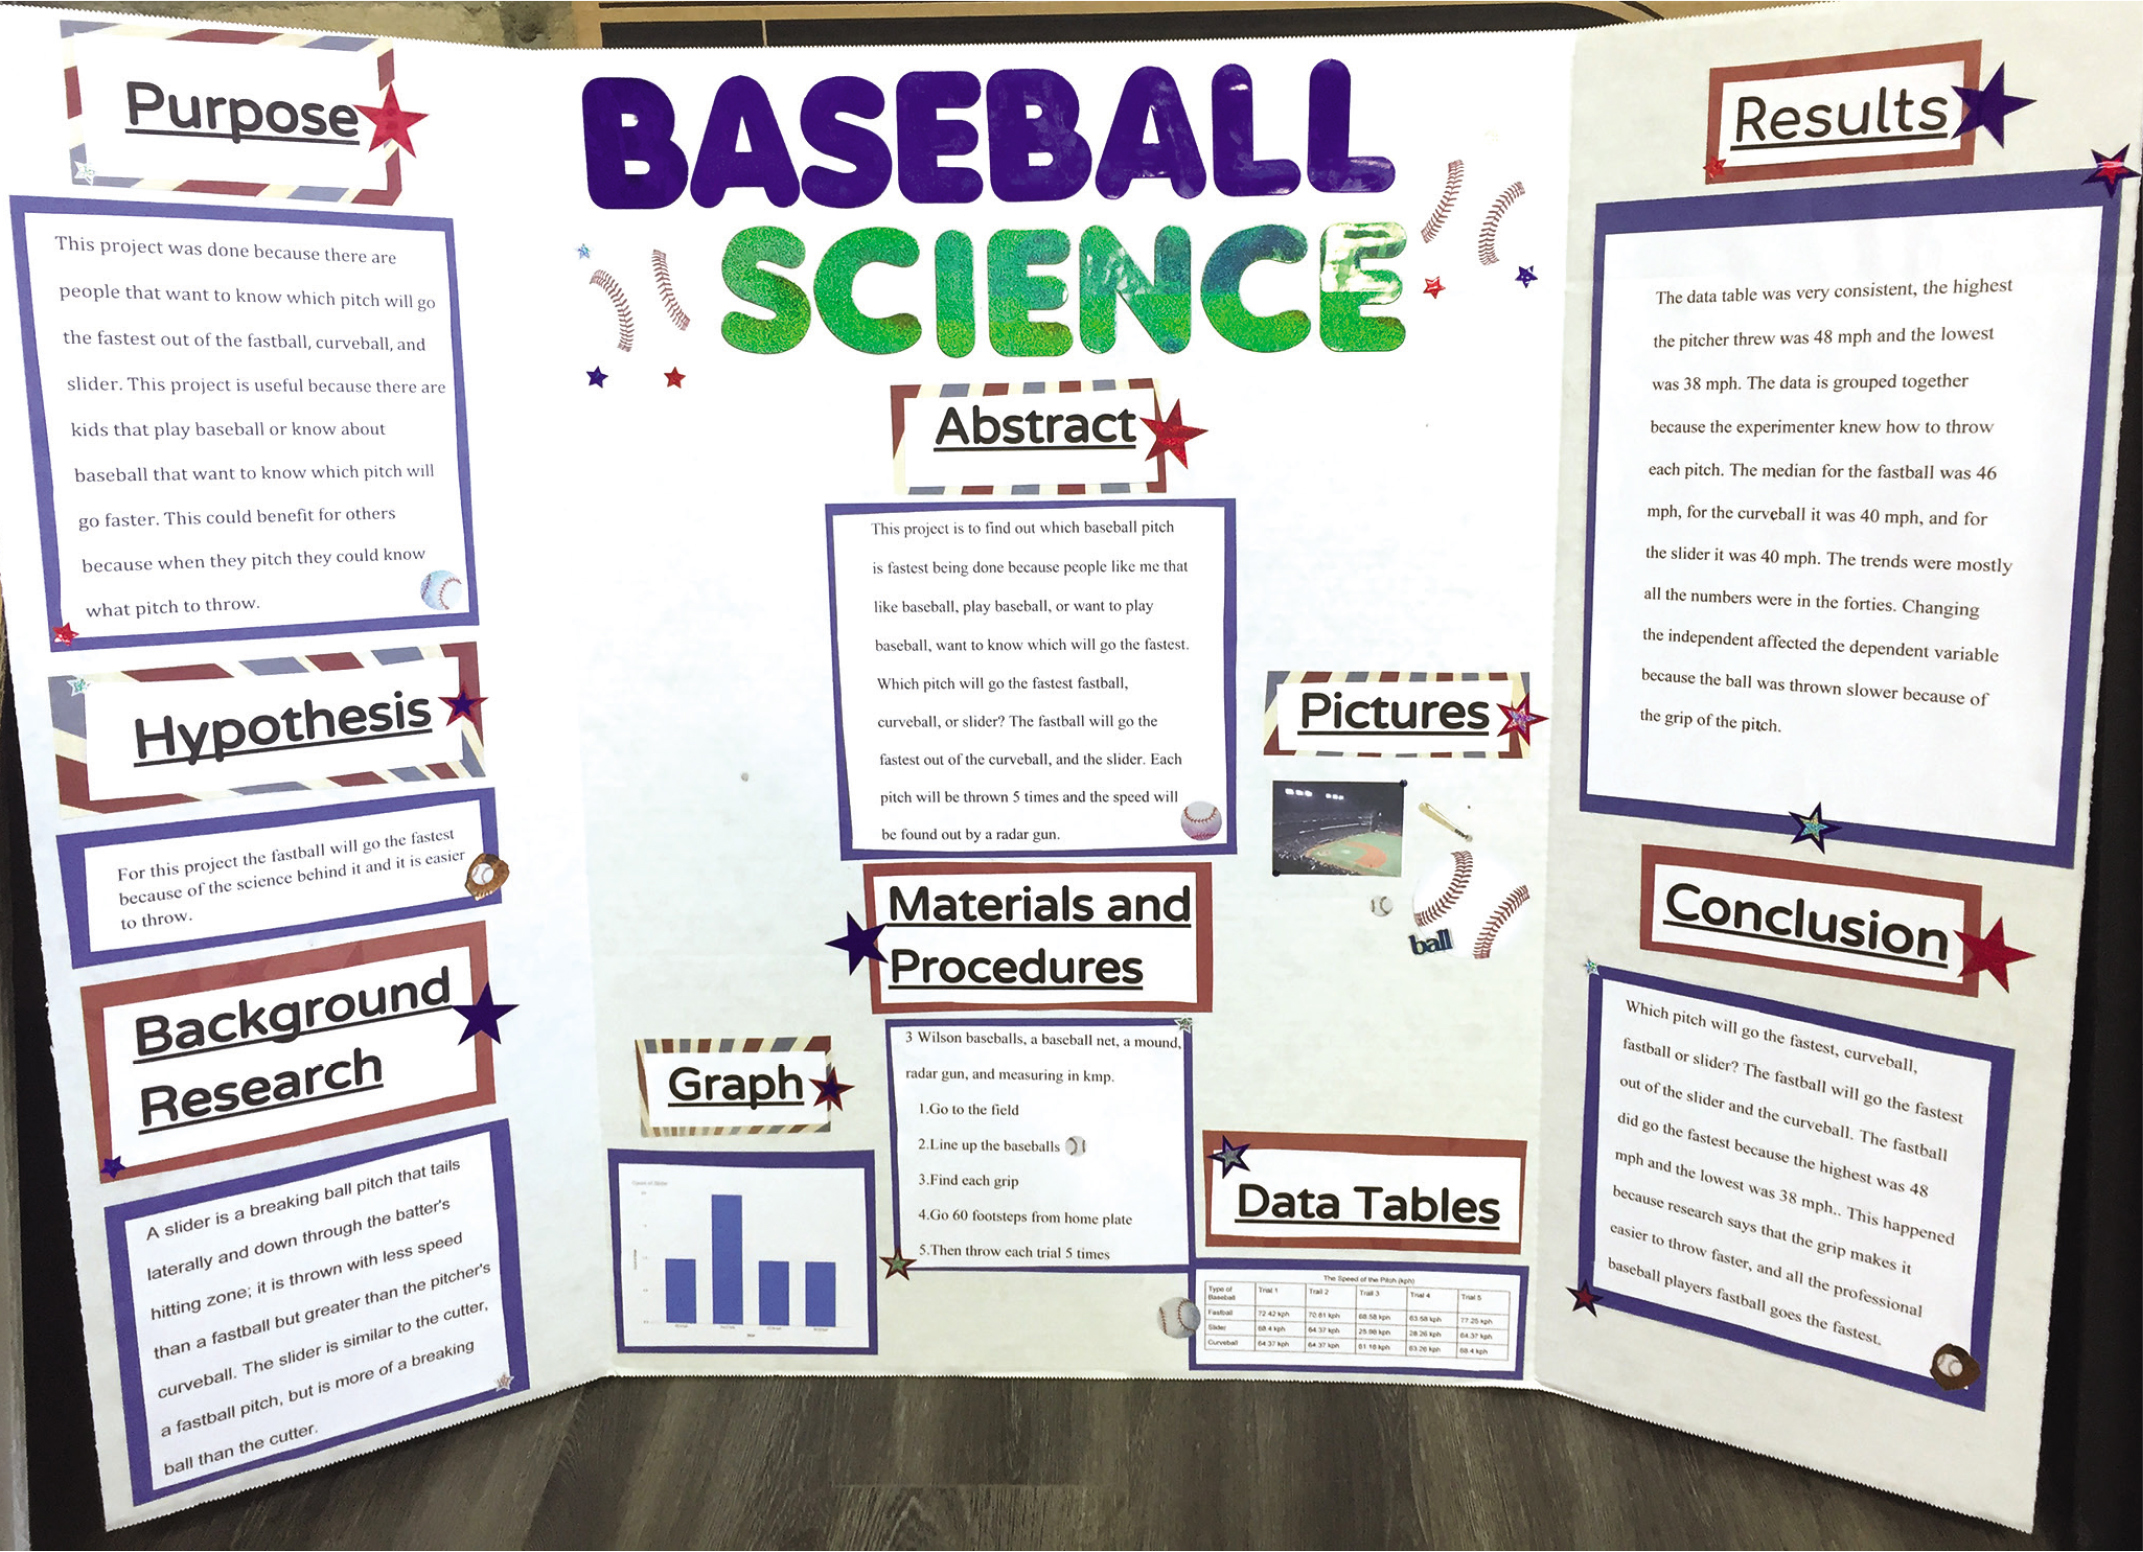
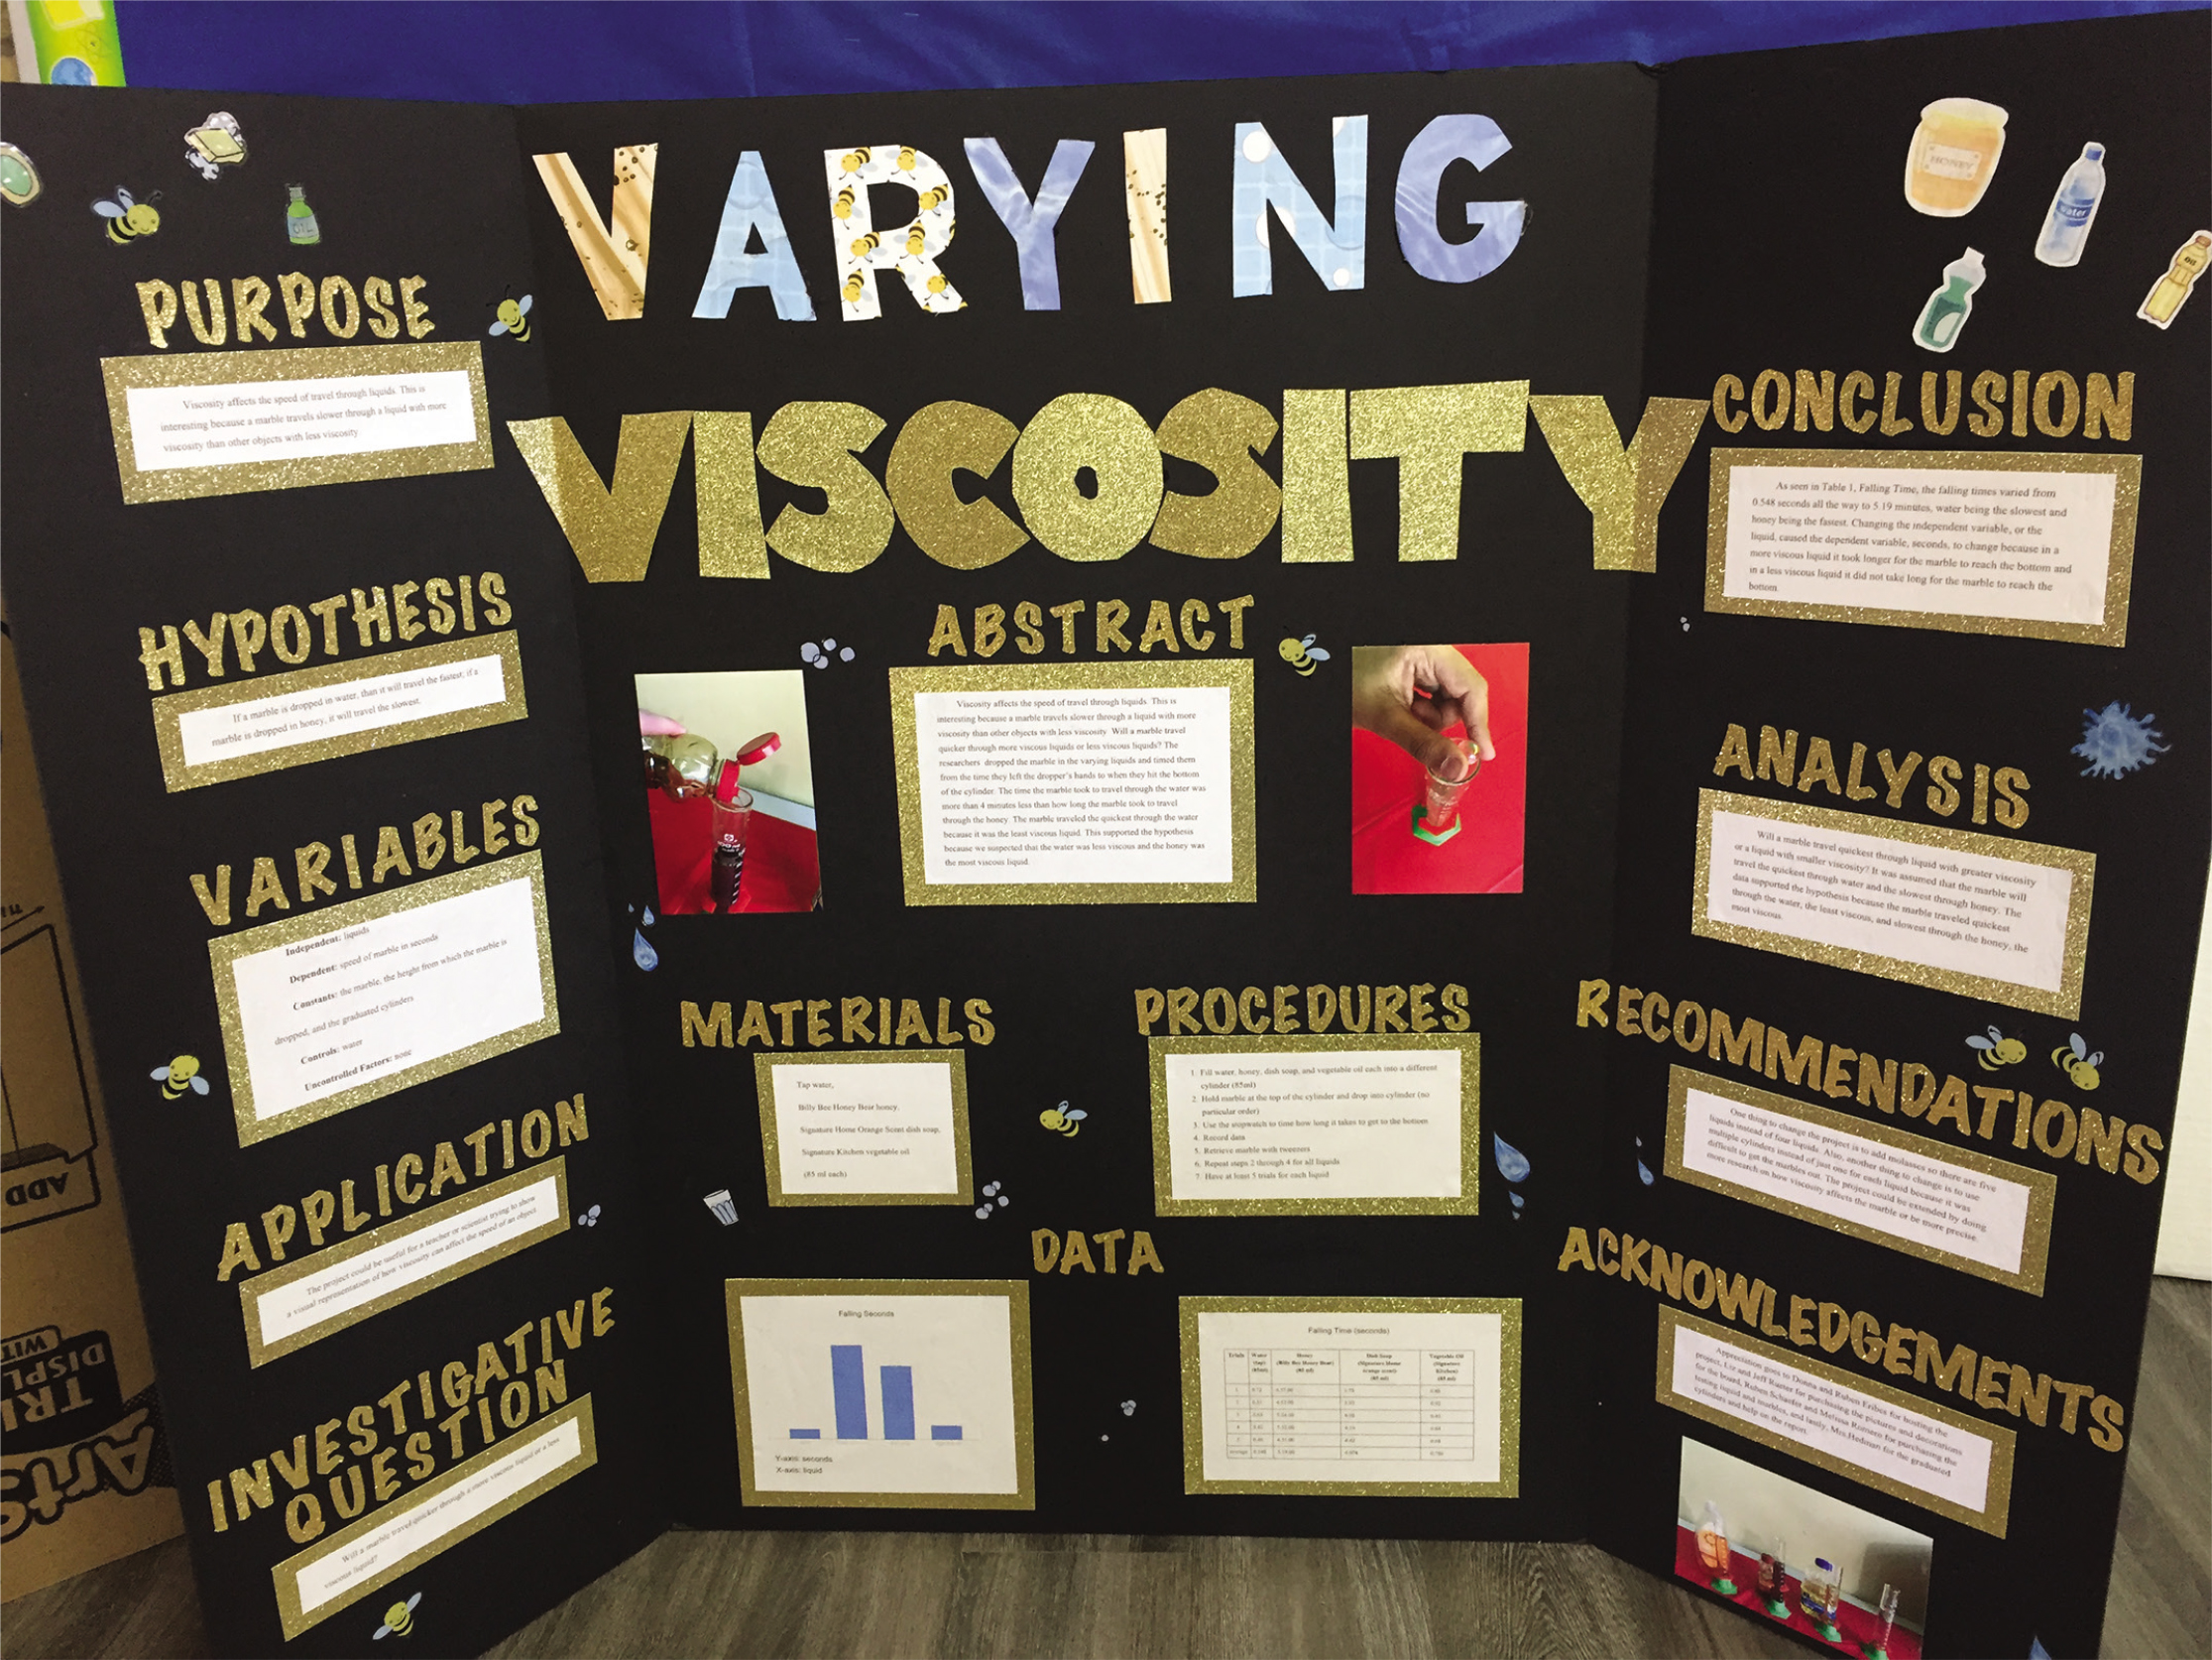
The Display Board Advice document (see Online Supplemental Materials) summarizes both content and format instructions. Typically, students want to just print out their reports and glue them on the display boards. This approach is not encouraged. Rather, students should use the display boards to showcase their project by simplifying and summarizing the results so anyone could easily absorb the impact of the project.
Assessing the portfolio
The teacher grades each portfolio component throughout the project, giving timely and actionable feedback to students, who can respond to the feedback by revising as necessary. This cycle of feedback and revision provides continuous formative assessment opportunities for students. Students do not do peer review on the initial components because they are not ready to provide feedback to one another. However, peer review of the major milestones—research paper, report (part one), report (part two)—are completed using detailed checklists (see Online Supplemental Materials). Students are summatively assessed using rubrics (see Online Supplemental Materials) at key milestones throughout the project. In addition, all completed projects are displayed at the all-school science fair, but students may choose whether they want to compete and be judged. Winners of the school science fair proceed to the district-level science fair and may attend the statewide fair if they win the districtwide fair. Students at this age tend to be extrinsically motivated, so recognition and awards often give them enough encouragement to compete. There is a high correlation between well-executed projects and the desire to compete. Around 20% of students opt to compete, with wide variation depending on the particular cohort.
Implementation issues
Do not expect junior high students to maintain the project components over several months. Students may throw out or lose portfolio components before the end of the project, and then have to scramble to reproduce those pieces when the final components are due. To address this issue, student portfolios were kept in the classroom in hanging files, and student work was reliably available. However, if students need to access their work at home, an electronic portfolio may be the best solution, as it eliminates the need for storage space and access to physical files. Teachers need to have a plan in place for the collection and management of the portfolio components. One strategy that has been useful this last year is using Google Classroom. Work is saved automatically in Google Documents, and it all can be accessed online.
Positive outcomes from the science project portfolio approach
During the 2014–15 academic year, the first author of this article spent more than 80 hours grading science fair components. Approximately 91% of the 154 junior high students enrolled in the science fair participated. While some students excelled, most students met the minimum requirements of the project. In addition, between 10% and 20% of the submitted projects were clearly not the student’s own work alone. Several projects had apparently been completed by, or with significant help from, parents or other adults. Parts of some projects were plagiarized from the internet. By the time students submitted their work for grading, unfortunately there was no mechanism with which to address these issues. Both plagiarism and parent-completed work prevent learning and make authentic assessment impossible. The portfolio approach is specifically designed to prevent these problems, and it allows a teacher to identify either of them early enough in the process so that recovery is possible.
In the 2015–16 academic year, when the science fair portfolio project was implemented, 195 junior high students were enrolled and expected to produce science fair projects. Only nine students (4.6%) did not complete a project. All the projects were students’ work; no projects were plagiarized. Grading hours dropped from 80 to 60, even though student enrollment had increased by 30%.
The portfolio process breaks down the larger assignments into a series of small, easily graded homework assignments. Students receive meaningful feedback on their homework assignments and are required to review and incorporate the feedback into their projects. Students reach the major milestones of the project by putting together these smaller, graded assignments. Grading the major components is thus streamlined considerably: All the parts have already been graded at least once before. In addition, student academic achievement improved substantially, with the majority of students earning a B or above. The grades represent the summative assessments at the major milestones of the project. Individual schools and districts can, of course, set these milestones however they like.
Differentiating for a low-income school would most likely occur when students are generating ideas for projects they would like to test. In previous years at a Title 1 school, we also expanded the schedule to allow time for the students to do all of their data collection (testing) in class. This allows students to use the school’s resources and levels the playing field by giving all students a supportive environment for designing and conducting their experiments.
Conclusion
The portfolio process provides the support and examples students need to be successful with such a complex set of tasks. In addition, it streamlines the workload so timely and actionable feedback can be provided to students without teachers becoming overwhelmed by the grading at the end.
The science project portfolio transforms the monolithic “science project” into a set of well-defined tasks, each more easily accomplished. Along the way, it improves student learning and family stress levels and reduces teacher time investment.
Online Supplemental Materials
The Science Project Portfolio
- Comment Codes
- Display Board Advice
- Factors for Comparison worksheet
- Four Questions worksheet
- Materials and Procedures worksheet
- Report Part 1: Peer Review Checklist
- Report Part 2: Peer Review Checklist
- Research Directory
- Research Paper Description and Components
- Research Paper Explanation Prompt
- Research Paper Peer Review Checklist
- Rubrics
- Table and Graph Checklists
- Transformation worksheet