
Scope on the Skies
Give Them the Tools and They Will Explore
Science Scope—March/April 2021 (Volume 44, Issue 4)
By Bob Riddle and Betsy Stefany
In our classroom, students are a captive audience as we use our “teacher ways” to engage them in science learning and activities. So, when they leave our classroom, how can we continue their involvement with science? No, not with homework per se, but rather with involvement in projects where there is observation and data collecting. Depending on the science, there could be an outdoor field component supported with data-collecting apps, software, and websites. This opens an opportunity for students to role-play, in a sense, what scientists do, and it supports part of our role as educators to encourage and nurture students’ curiosity in our world beyond the classroom walls. Keep in mind that websites are usually operating-system independent but may require creating an account.
With that in mind, it is possible for a classroom, individual student, or group/club to join any number of a wide-ranging variety of science investigations and projects; for example, at the SciStarter website (“science we can do together”), participants choose from many different projects; depending on the project, they will make observations and provide the observations as data specific to the project. Projects include astronomy-related activities like identifying spiral galaxies or counting stars to measure light pollution. Use the SciStarter website as its name suggests and start getting involved by searching for a project and then linking to the website of that project (see Resources).
One of my favorite citizen science projects is the Satellite Streak Watcher website at the Anecdata website (see Resources). At this site, participants observe and use cell phones or digital cameras to photograph satellites in Earth’s orbit. The increasing number of satellites is becoming a concern for ground-based astronomy, as the reflected light from satellites and their solar panels appearing as streaks of light interferes with imaging of celestial objects (see Figure 1). By tracking satellites, participants are contributing to a database that will help them understand how the increasing numbers of satellites impact ground-based observations.
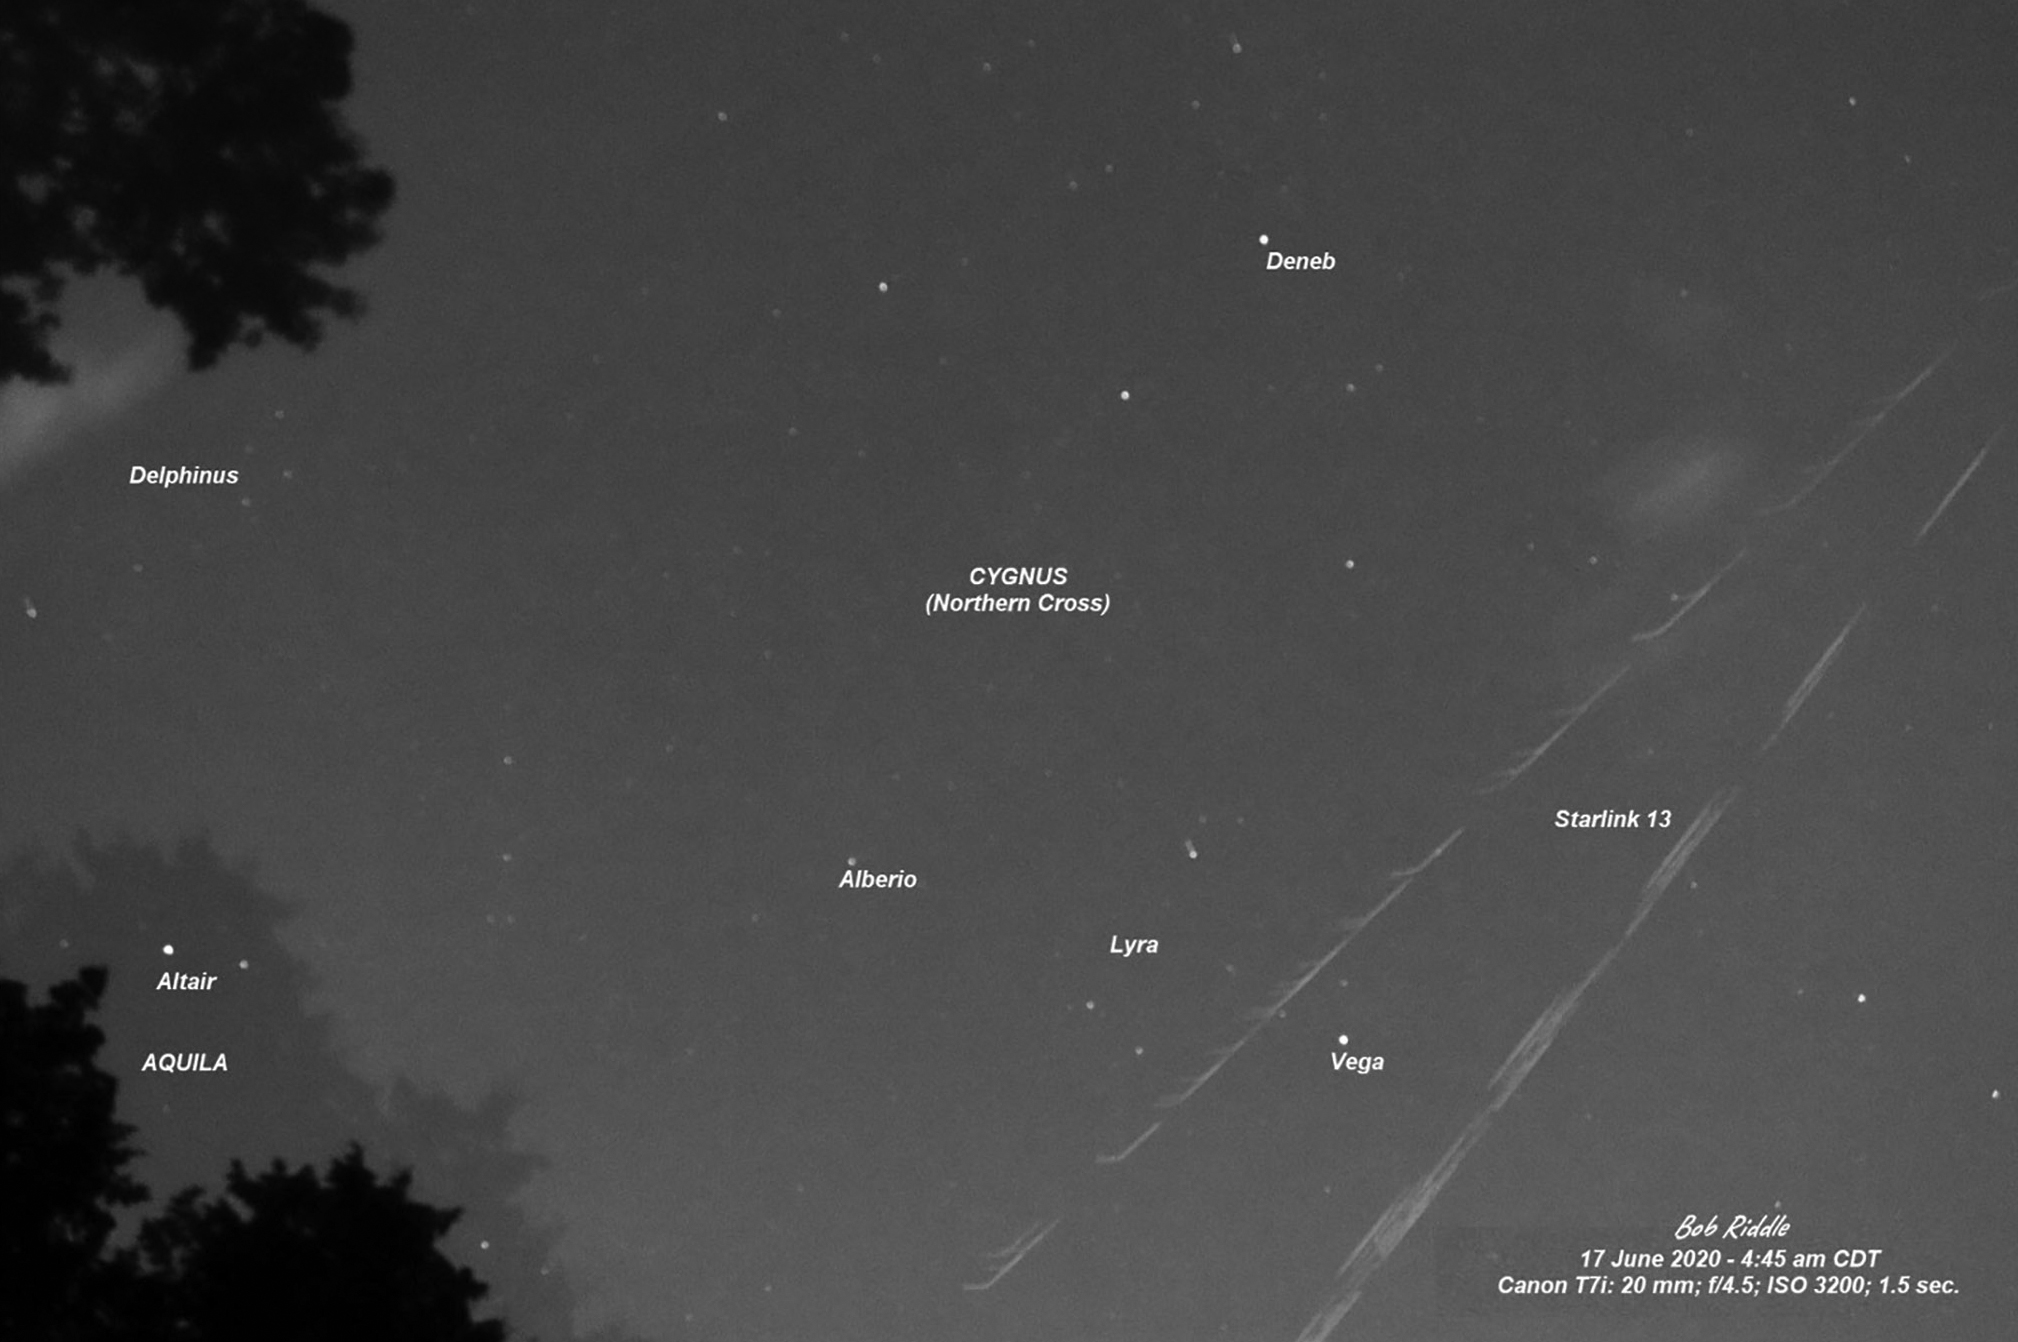
Starlink satellites train.
April is Citizen Science Month, and at the Citizen Science website (“helping federal agencies accelerate innovation through public participation”), teachers and students are introduced to more than 400 projects searchable by project status, Government Agency, or field of science (see Resources).
Additionally, there are websites such as the NASA-supported AEROKATS and ROVERS Education Network (AREN; see Resources), where remote sensing can be explored through joining NASA/AREN; developing a site; and then adding a toolkit of handhelds, apps, and sensors to detail your location and extend projects. Not only does the NASA/AREN program website provide an opportunity to develop a remote-sensing site, but it also helps you find peers beyond the classroom. The website connects to the AREN Project, where teachers interested in having students participate must complete a short survey. Teachers are also encouraged to sign up for the Global Learning and Observation to Benefit the Environment (Globe) Program, a worldwide science and education program. Joining requires attendance at either a physical or virtual workshop.
Go fly a balloon or a kite
What are the conditions of the atmosphere at different altitudes? And interestingly, what would you do with any data showing these conditions? One possible answer came from Ascent: A Community-Based Project to the Stratosphere. This was a collaboration of science, musicians, a couple of “McGyver” types, students, and local businesses to fly three high-altitude balloons over the Kansas City area. The purpose was to use remote data sensors attached to a high-altitude balloon to record motion, temperature, direction, speed, altitude, and audio, as well as to broadcast GPS tracking data in real time. Much of this was incorporated into a series of full-dome videos along with an original soundtrack and performed live under a planetarium dome (see Resources).
Ever wonder as you get ready to fly a kite which way the wind aloft is coming from? If you attached an Aeropod to the kite string, you would get an answer to that question as well as collect other data about the atmosphere at the altitude of the Aeropod (“an aerodynamically stabilized instrument platform for kites and tethered balloons”; see Resources). Regularly flying a string of Aeropods at various heights would allow for an interesting collection of data that could be graphed and plotted to show daily trends in how, for example, reradiating surface temperature affects the atmosphere near the surface. Aeropods may be used in a variety of situations where sensors need to be stabilized (see Figure 2).

Using an Aeropod to stabilize instruments suspended over and under the water. The Aeropod is a “NASA technology” used in conjunction with the NASA AEROKATS and ROVER Education Network Project (AREN/HenryNNX16AB95A).
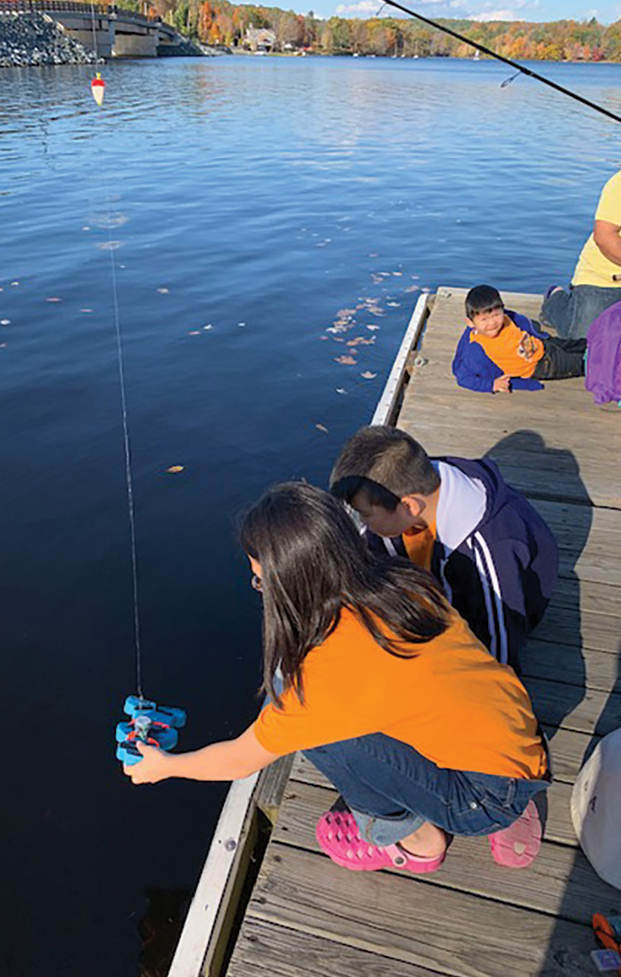
Students using sensors to measure water temperatures.
Remote sensors come in a variety of capabilities, ranging from those attached to the balloons used with the Ascent project, or those attached to an Aeropod, or those that are parts of a probe inserted into a body of water, the ground, or even as snow or ice cores. Other sensors may be of the type that are left in place over a predetermined period of time or are of the type that are installed as an app on a cell phone. Regardless, success with remote sensors requires practice, and best practices are initially successful when the selection of the use of a sensor aligns with a problem that the sensor is designed to measure and capture.
During the annual 2020 NSF STEM for All Video Showcase: Learning from Research and Practice, where videos were shared and discussions held, co-author Betsy Stefany presented the video “Becoming STEM: Bringing Remote Sensing to Immediate Spheres” (see Resouces). The video follows annual seasonal integration activities introducing sensor and data collection initially developed as math and science partnership projects. These STEM classroom projects merged with the NASA/AREN remote-sensing goals, extending the application beyond the classroom. The ongoing data collection unites multiple learning designs and individual interests through family, clubs, and field classroom practice with STEM. The video highlights the use of Aeropods and sensors used for remote measurement of temperatures and light and by snow core sampling.
Using sensors, students explored the temperature of air and light reaching the surface of pond water at two different depths. They placed a sensor on a foam figure floating on pond water to represent a person swimming and two more sensors in the water (see Figures 2 and 3). Mrs. Stefany added, “The whole reason we use both light and temp is to get back to Albedo . . . so measuring these together and referring to the floater as a ‘foam figure’ removes the gender issues of doll . . . and also get the concept of heat transfer into the discussion. Dolls don’t care about being a water-based Crash dummy . . . most only like exotic changes of clothing and hair!” (see Resources).
On the other hand, cell phone apps are designed to build from the users’ knowledge of the phone’s suite of communications tools. The individual’s phone becomes the central organizer for the data collection. To get an idea of a cell phone’s capabilities, visit the Phyphox website, download the Phyphox app, and take the cell phone challenge. The Phyphox app contains an incredible suite of 30 measurement tools that would greatly add to the set of sensors and tools for students to explore their world. Another app, the Arduino Science Notebook, has a smaller suite of sensor tools, and like the Phyphox app, the sensor tools display in real time, plus allow for recording, saving, and sharing the results (see Resources).
Apps may work as well as a sensor in collecting data, but in one instance, as described by a colleague, they “are not as flexible as working with a remote sensor. Who could toss their phone into a Maine pond over the winter and expect a positive outcome?”
Given that many of our students will have a cell phone by middle school, it is possible to have them utilize apps that are designed for data collecting. Many apps, like Phyphox, use cell phone built-in abilities including the microphone, camera, GPS, light sensor, accelerometer, and others. By using the built-in functions, students will not only be able to record visual observations, but (with apps such as those described in this column) also be able to collect data in real-time. Apps are generally available for both IOS and Android, and many of the Freeware apps include in-app purchase options. PC software comes in different operating systems, and there may also be some limits to installing software on a school district’s provided equipment.
The apps described in this column are used as examples and do not reflect an endorsement by NSTA for their use. All the apps have been successfully installed and used on an Android-based Samsung Galaxy 7 cell phone (one belonging to the author).
Astronomy in your hand
Observing celestial events is an out-of-classroom activity that is greatly enhanced using resources that are online or are cell phone apps. However, between your eyes and outer space is a layer of gases, our atmosphere, that may or may not be transparent for an observing session. Determining this in advance could involve using local weather broadcast or going online with either of these two websites with an emphasis on observing weather.
In addition to looking out a window, Clear Dark Skies (see Resources) is my “one-stop” website for checking on atmosphere conditions in advance of an observing session. Once local location information has been entered, the website offers a few options that include a multiday, very detailed graphic display of the sky that “shows at a glance when, in the next 84 hours, we might expect clear and dark skies for one specific observing site.” There is an interactive color-coded map of the Earth showing light pollution levels. And there is a page for calculating local limiting magnitudes based on atmospheric conditions. The latter could be part of a light pollution project where students simply look for the dimmest star visible at their location. Given enough of an area, students could construct their own local light pollution map.
Another very useful website and cell phone app specifically for astronomical observing is Astrospherics, offering advanced weather forecasting for North American astronomers (see Resources). As with Clear Dark Skies, location information needs to be entered. Once done, the website displays an interactive map of your location with the ability to change the map overlays to show, for example, cloud cover, sky transparency, a satellite view, and several other choices. These open into a larger map display centered on your location.
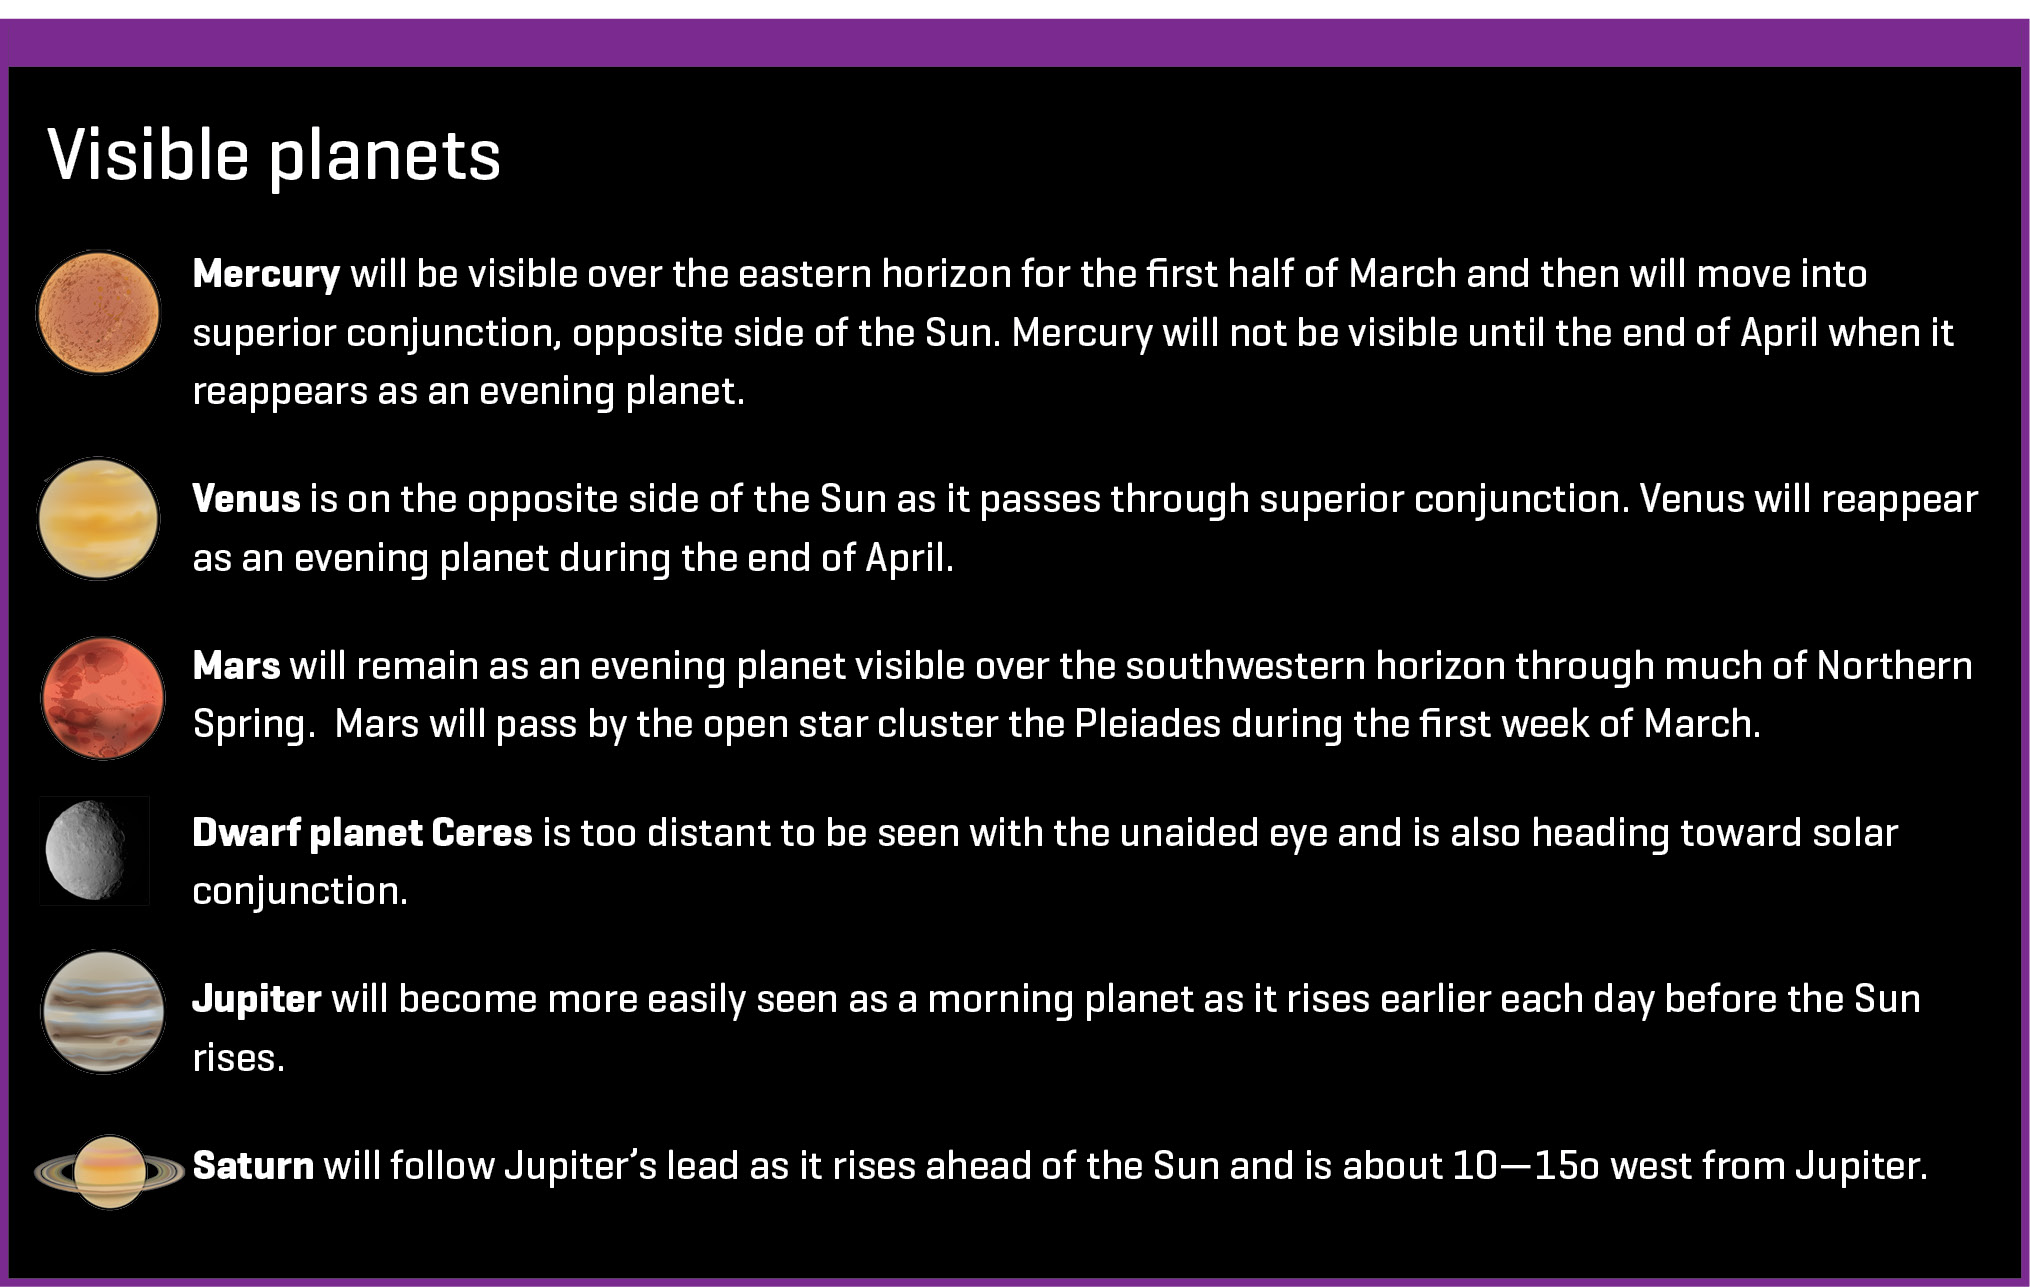
For students conducting astronomy-related projects, there are many options. However, knowing what celestial objects such as planets, stars, and constellations will be visible, and where they will be located, is an important first step. To meet this need, look for an interactive app that uses GPS to determine your viewing location to then show what is visible.
Two of the many useful apps using GPS that display the sky as you aim the cell phone skyward are StarTracker and Skeye. StarTracker is available for Apple and Android cell phones, and Skeye is Android-based only (see Resources). Typically, these types of apps will also display data such as rising and setting times, percentage of illumination, and apparent size and magnitude, all of which are data that could be graphed or plotted to show past, current, or even possible future trends.
Most apps or websites about Earth-orbiting satellites typically contain information about the rising, transit, and setting times; the path the satellite will follow; its apparent brightness; and a variety of other observing information. Online, both NASA’s Spot the Station and the Heavens-Above websites are set to your specific latitude and longitude, and both provide observing information about the International Space Station (see Resources). However, at the Heavens-Above website, information about other satellites from its app is available as a data table and as a star map showing the satellite’s path.
Earth Now is an app from NASA that at start-up displays a 3-D view of the Earth with orbiting satellites moving in their respective orbital path. The app may also be used to visualize data collected over the previous 24 hours from the NASA/NOAA Suomi National Polar-Orbiting Partnerhip satellite (see Resources). The app can display a mosaic of the globe showing “vital signs” including air temperature, ozone, sea level, and a visible Earth. •
Intellectual Property Notice: Aeropods—aerodynamically stabilized tethered remote sensing platforms—are patented intellectual property of NASA and the Airborne Earth Research Observation Kites And Terrestrial Systems (AEROKATS) program, and are considered competition sensitive. They may not be copied, re-engineered or reproduced without prior authorization from NASA. The Aeropods used in this project were produced in accordance with NASA Space Act Agreement SAAM #9200.
Resources
2020 STEM For All Video Showcase: Aeropods—https://videohall.com/p/1715
Aeropods—www.globe.gov/web/aren-project/overview/aerokats/aeropods
Aerokats—www.globe.gov/web/aren-project/overview/aerokats
Arduino Science Notebook—Available for Apple and Android
Ascent: A Community-Based Project to the Stratosphere—Scope on the Skies. Science Scope. Bob Riddle. November 2012
Ascent project video trailer—1drv.ms/v/s!ApK_fhbAUVH9i74bvwNpdF7gQ6jzcg
Ascent flat screen version—1drv.ms/v/s!ApK_fhbAUVH9i74iS6_xXWoPpwQkWw
Astronomy apps—astrobackyard.com/astronomy-apps-for-stargazing/
Astropheric—astrospheric.com
Becoming STEM: Bringing Remote Sensing to Immediate Spheres video—https://stemforall2020.videohall.com/presentations/1715
Citizen Science—www.citizenscience.gov/
Citizen Science Month 2021—www.citizenscience.org/events/citizen-science-month/
Clear Dark Skies—www.cleardarksky.com/
Earth Hour—www.earthhour.org/
Earth Now app—Available for Apple and Android
GearBox Labs—store.gearboxlabs.org/
Globe at Night—scistarter.org/globe-at-night
Heavens Above—www.heavens-above.com/
Imaging the Night Sky. Scope on the Skies. Science Scope. Bob Riddle. February 2014
Ivan Ivanovich—en.wikipedia.org/wiki/Ivan_Ivanovich_(Vostok_programme)
NASA AREN—science.nasa.gov/science-activation-team/resa
NASA/NOAA Suomi National Polar-Orbiting Satellite—www.nasa.gov/mission_pages/NPP/main/index.html
Satellite Streak Watcher—www.anecdata.org/projects/view/687
SciStarters—scistarter.org/
Smartphone Challenge—phyphox.org/news/smartphones-put-to-the-test/
Spiral Graph—scistarter.org/spiral-graph
Spot the Station— https://spotthestation.nasa.gov/
StarTracker App—Available for Apple and Android
TomatoSphere—scistarter.org/tomatosphere
For students
- Hang a data sensor like an aquarium or lab thermometer from different heights between the floor and ceiling of a room. Create a thermocline map or graph to show the temperature at different heights in the room.
- Join the Globe at Night program and determine and map the limiting magnitude of star visibility for your community or metropolitan area. Involve students and families from as many locations as possible.
- It is springtime so plant some tomatoes from seeds that have orbited the Earth.
- Take the Smartphone Challenge.
- Participate in Celebrating Earth Hour.
Bob Riddle (bob-riddle@currentsky.com) is a science educator in Lee’s Summit, Missouri. Visit his astronomy website at www.bob-spaces.net. Betsy Stefany (bastefany@gmail.com) is an independent researcher with the SABENS Group in West Lebanon, New Hampshire.
Astronomy Earth & Space Science Middle School