
teacher’s toolkit
Using Proxy Data to Understand Climate History
Science Scope—May/June 2023 (Volume 46, Issue 5)
By Regina Brinker
Climate change is of great concern for today’s students. Impacts of climate change are felt on environmental, health, social, economic, and political systems globally, and urgency for mitigation continues to grow. To effectively take action now and in the future, students need to understand the basics of climate science.
This article describes the use and discussion of proxy data in the middle school classroom to explore Earth’s historic temperatures as determined by proxy data. Scientists use proxy data as evidence to describe past conditions. Proxy data are preserved physical characteristics of the environment that can stand in for direct measurements (National Centers for Environmental Information 2018). Proxy data include tree rings, fossils, pollen, diatoms, and core samples of ice or soil. Middle school students may use proxy data as a means to understanding how scientists use evidence to learn about past climates. This will help students better understand the nature of science, practice evidence-based thinking, and become aware of career opportunities in science and engineering.
Providing details of multiple lessons is beyond the scope of this article. Instead, the author provides links to activities successfully used in middle school classrooms, as well as to other supporting resources related to proxy data (see Supplemental Materials for link to supporting resources). This article also gives background information on core sampling, the gold-standard of climate study. This information should increase teachers’ confidence and interest in using additional proxy data lessons.
Guiding student interpretation of temperature and CO
To best understand human-driven climate change, students need to recognize the relationship between atmospheric CO2 levels and temperature trends. Use supported, guided discussion so that students make sense of a graph that depicts historic CO2 and temperature data, internalize the information, and remove uncertainties about the causes and rates of CO2 and temperatures. This activity can be done in a 45-minute class period. For longer class times, extend the discussion into other examples of proxy data. The author has successfully used this activity with students of various academic abilities by allowing time for individual thinking, partnering or small-group discussions, and class discussions.
Graph analysis
Present a graph (see Figure 1) that shows only data lines but no title, values, or labels so that students focus on overall trend lines of the graph. It is important that the graph be presented and discussed without referring to climate change (allow students to reach this conclusion based on evidence presented). Begin by asking students to describe what the graph is showing.
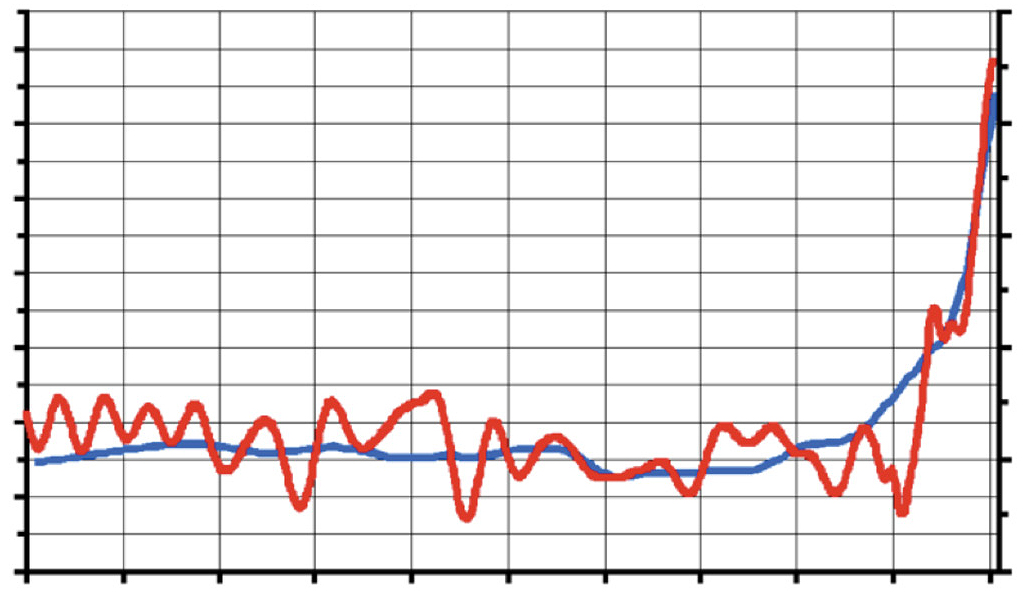
CO2 and temperature graph, without labels.
Prompt students to state the obvious (e.g., There is a red line and a blue line. The blue line is mostly straight.). Ask questions as students are thinking (e.g., What do you notice about the right side of the graph compared with the left side?). By using strategic questions and prompts, teachers elicit responses from students across academic abilities. Give students individual time to make sense of the graphs and record their observations. This may be done on virtual or paper copies. Next, have students share their observations with a partner or small group, adding new ideas to their notes. Students should notice that the following:
- Over time, data fluctuates.
- Most fluctuation falls around a mean value.
- Data points on the far-right side of the graph have a steep rise.
- This rise is higher than any other section of the graph.
- Declines in data points on the far-right side are noted, but the declines are not as deep or as long lasting when compared to earlier data points.
Next, have students review the graph with all labels showing (see Figure 2). Ask the students what other interpretations they can add. Students should notice the following things:
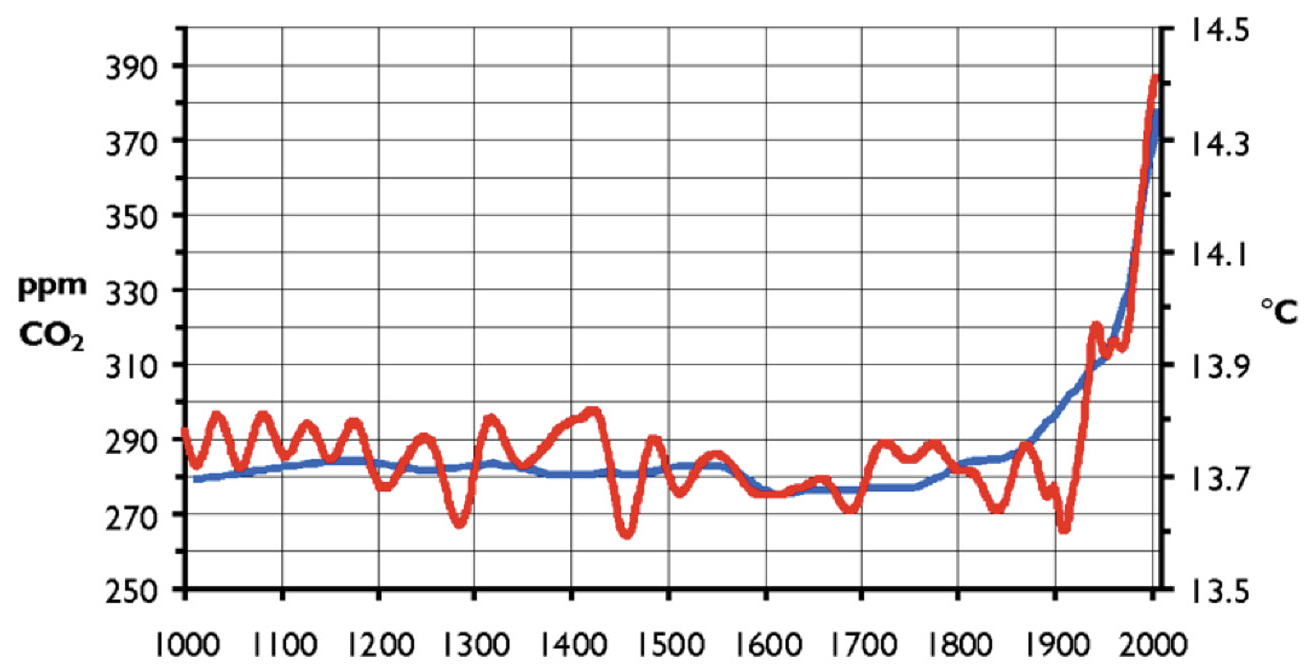
CO2 and temperature graph, with labels.
- The graph shows atmospheric temperature (red line) fluctuations over time, but initially these show a relatively small degree of change.
- A drop in temperature happened during ice ages.
- A recent sharp rise in temperature.
- Temperature is higher than at any previous time.
- CO2 levels (blue line) show little change until about 1800. After 1800, CO2 levels rise without falling.
- CO2 increases precede temperature increases in the late 1800s.
- CO2 levels are higher than they have been in the past 1,000 years.
- Graph shows data from over 1,000 years ago.
Ask students to notice when CO2 and temperature readings began to spike upward (around 1800). Ask students what inventions came about in the 1800s and early 1900s. Prompt, as needed, with images of steam-powered trains and ships, automobiles, trucks, and airplanes, all powered by fossil fuels. On the basis of this data, ask students to describe the relationship between atmospheric CO2 and temperature and to add a title for the graph. Examples of titles include “CO2 and Temperature” and “Changes in CO2 and Temperature Across Time.”
Then ask students to explain why the graph can include temperatures and CO2 levels from over 1,000 years ago when accurate temperature readings were not taken. Students likely don’t have a correct answer. After discussing their ideas, let students know scientists use proxy data to provide information about past events. To explain the term proxy data to middle school students, the words are first considered independently. Students can define data as numbers or measurements and are told that a proxy is a thing that substitutes for something else. For example, if a student is home sick and cannot attend a club meeting, they can ask a friend to attend on their behalf, as their proxy.
Second lesson and additional proxy data sources
The purposes of the second lesson are to review the meaning of proxy data and have students recognize two things they are familiar with—fossils and tree rings—as being proxy data. This may be covered in a 45-minute class period.
Begin by reviewing proxy data. Ask students for other examples of natural things that provide information about Earth’s past. Using images or physical examples as prompts, guide the discussion to fossils. We were not alive when the fossils were created, but we can draw inferences from fossil evidence about what plants and animals existed in the past and where they were found; therefore, fossils provide proxy data. This example helps students to better understand proxy data.
Next, show students an actual or virtual cross-section of tree rings. Ask what the rings indicate. Students most likely know that each ring represents a year of growth, and that wider spaces between rings indicate more tree growth. This information can be matched with historic data of rainfall and temperature for the region where the tree grew. Evidence of fire scars or uneven growth may also be seen on tree-ring samples. Students may not have been alive when the examined tree was planted, but they can say with confidence how old a tree was and how robust growth was from year to year, based on tree-ring information. Therefore, tree rings provide proxy data. Cuts of trees may be available for free from local tree-trimming companies and Christmas tree lots. As an extension, students may research (or the teacher may provide) local rain and temperature data from past years. Using this data, students draw what tree rings would look like from a tree growing under these conditions.
Additional proxy data lessons
To understand how scientists can describe Earth’s climate from as many as 800,000 years ago, students need to be familiar with core sampling. At a minimum, show a video that explains ice core sampling in Antarctica and how this provides information about past climates. The video “How is Evidence of Past Climate Retrieved from the Greenland Ice Sheet?” provides an introduction to ice core sampling (see link in Online Resources). After watching the video, students should understand that ice sheets are made of layers of ice that are thousands of years old, and that this ice contains gases that were present in the atmosphere when the snow fell. Allow 20 minutes for video and discussion. What follows is background information about sedimentary and ice core samples that may be useful for those unfamiliar with the techniques. Additionally, many core-sampling lessons have been published. The Ice Drilling Program website (see link in Online Resources) contains lessons, virtual field labs, videos, and teaching tools related to climate science and ice-core drilling and analysis.
Understanding core samples
Climatologists, geologists, marine scientists, civil and petroleum engineers, and other scientists and engineers use core sampling to determine what lies underground. Core samples from soil, marine, or planetary sediments indicate types and depth of rocks, minerals, groundwater, natural resources present, and layering of soils. This information may be used to assess soil stability before a building project starts or to locate natural resources. Examination of layering of soil and layer displacement may provide evidence of past earthquakes. Sediment samples may also contain diatoms, providing proxy evidence about past climates.
Diatoms are single-celled algae that have cell walls made of silica. Diatoms, which are found in oceans, waterways, and wetlands, are one of the most abundant life forms on Earth and are responsible for 20%–50% of photosynthesis that takes place (Spaulding 2021). Because their silica walls are resistant to decay, the unique structure of diatoms makes them easy to identify in sediment samples from the ocean floor, soil, and sand (see Figure 3). Diatoms respond to environmental factors, including temperature, light, mineral content of water, and nutrient availability. Because of this, diatoms may be used as proxy evidence of past environmental conditions. Because specific diatoms correspond to specific locations, they may be used as evidence in forensic investigations, such as determining where soil found on the underside of a vehicle originated. Prepared slides of diatoms can be purchased from scientific vendors for students to view (“slides” refers to prepared glass slides to use under a microscope). Pictures of diatoms can also be found online.
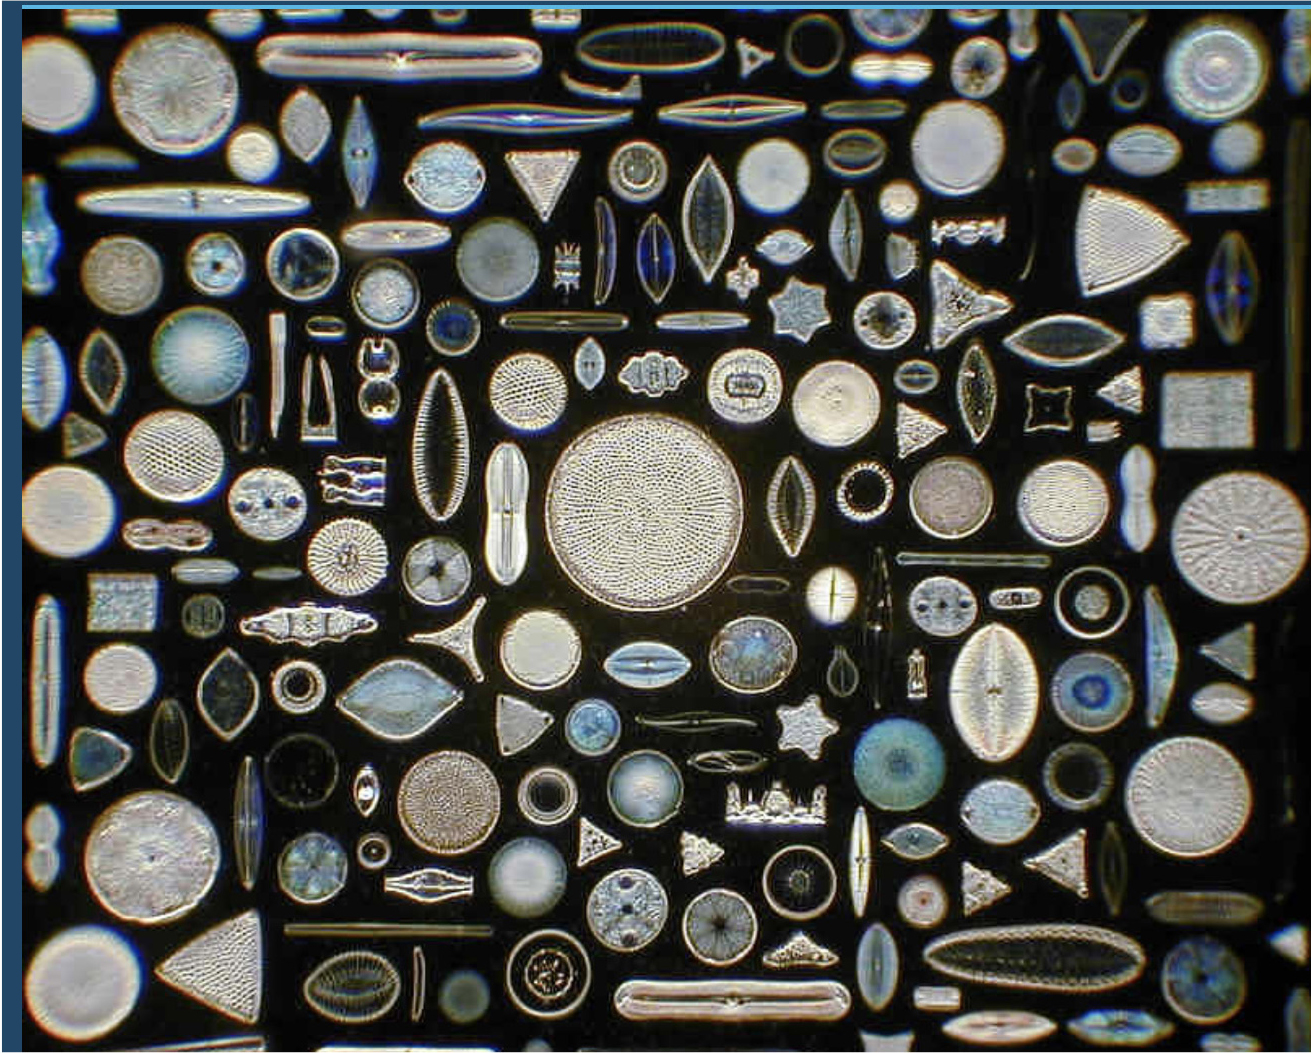
Examples of diatom structures.
In addition to sediment core samples, core samples may be taken from glaciers. Glaciers contain layers of multiyear ice and compressed snow. Whatever was in the atmosphere when the snow fell became trapped in that layer of the glacier, leaving chemical evidence of atmospheric conditions. The oldest continuous ice core records obtained in Greenland extend back from the present to 130,000 years ago, while ice core records from Antarctica go back 800,000 years (National Ice Core Facility 2022; see Figure 4).
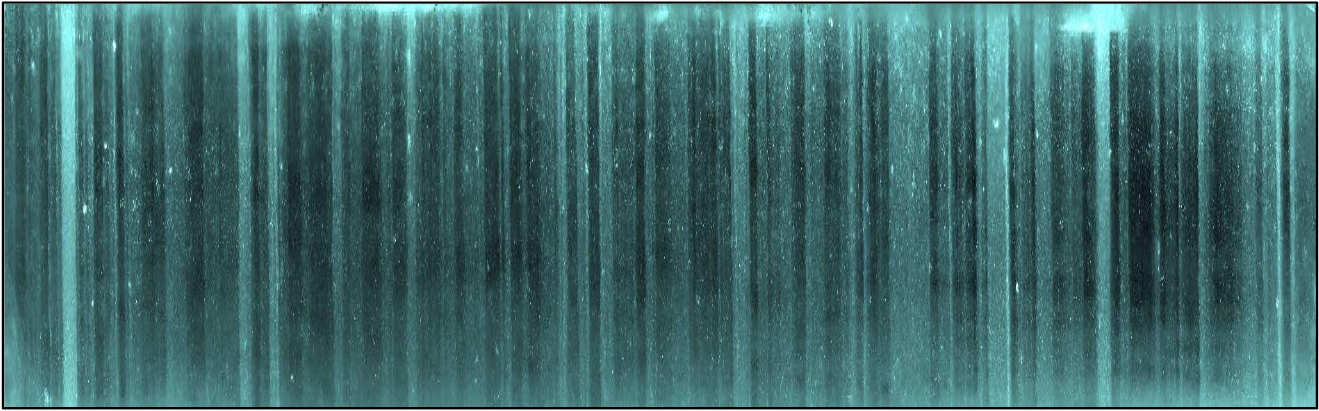
Ice core sample, compliments of the National Ice Core Lab (through correspondence with the author).
Scientists examine slices of ice cores using a variety of methods. Comparison of the amounts of oxygen and hydrogen isotopes in the samples provide evidence of past global temperatures; evidence of past nuclear testing and volcanic eruptions may also be seen. Ongoing research is being done to collect ice core samples from Antarctica and Greenland, as well as from oceanic sedimentary core samples, to learn more about Earth’s past. When introducing ice core samples, you can ask students what is in the atmosphere that might be trapped in ice. Responses may include gas such as oxygen, nitrogen, and carbon dioxide, as well as dust, fire soot, volcanic emissions, sea salt, and pollen. Classes may also connect with scientists in the field doing core sampling.
Conclusion
Data from direct measurement and proxy resources allow us to construct Earth’s climate history dating back 800,000 years. This long-range perspective highlights the current, rapid increases in temperature and CO2 levels. By understanding how proxy data is used and the information it provides, students gain a deeper understanding of Earth’s climate history and how human activity impacts climate.
ONLINE RESOURCES
“How is Evidence of Past Climate Retrieved from the Greenland Ice Sheet?” [video]—https://www.youtube.com/watch?v=InxgGn9JI18&t=14s
The Ice Drilling Program (IDEP) Education and Outreach—icedrill-education.org
SUPPLEMENTAL MATERIALS
Supporting resources—https://bit.ly/3UchidQ
Regina Brinker (brinker.science@gmail.com) is a retired middle school science and STEM teacher. She participated in the PolarTREC program, administered by the Arctic Research Consortium of the U.S.
Climate Change Climate Science Earth & Space Science Environmental Science Middle School