
Idea Bank
Versatile 3D Printed Colorimetry Toolkits
The Science Teacher—February 2020 (Volume 87, Issue 6)
By Claudia Bode, William G. Welch, Sarah Abeita, and Julian R. Silverman
Colorimeters (also known as spectrophotometers) are versatile analytical tools in science laboratories. Yet, it can be hard for students to understand how they function. One idea gaining popularity is to have students build their own colorimeters (Porter et al. 2016; Anzalone, Glover, and Pearce 2013; Mendez 2015). This approach enlivens old lessons, making them more meaningful and student-driven. We describe below how to make reusable toolkits, containing everything needed for students to build a colorimeter in one class period.
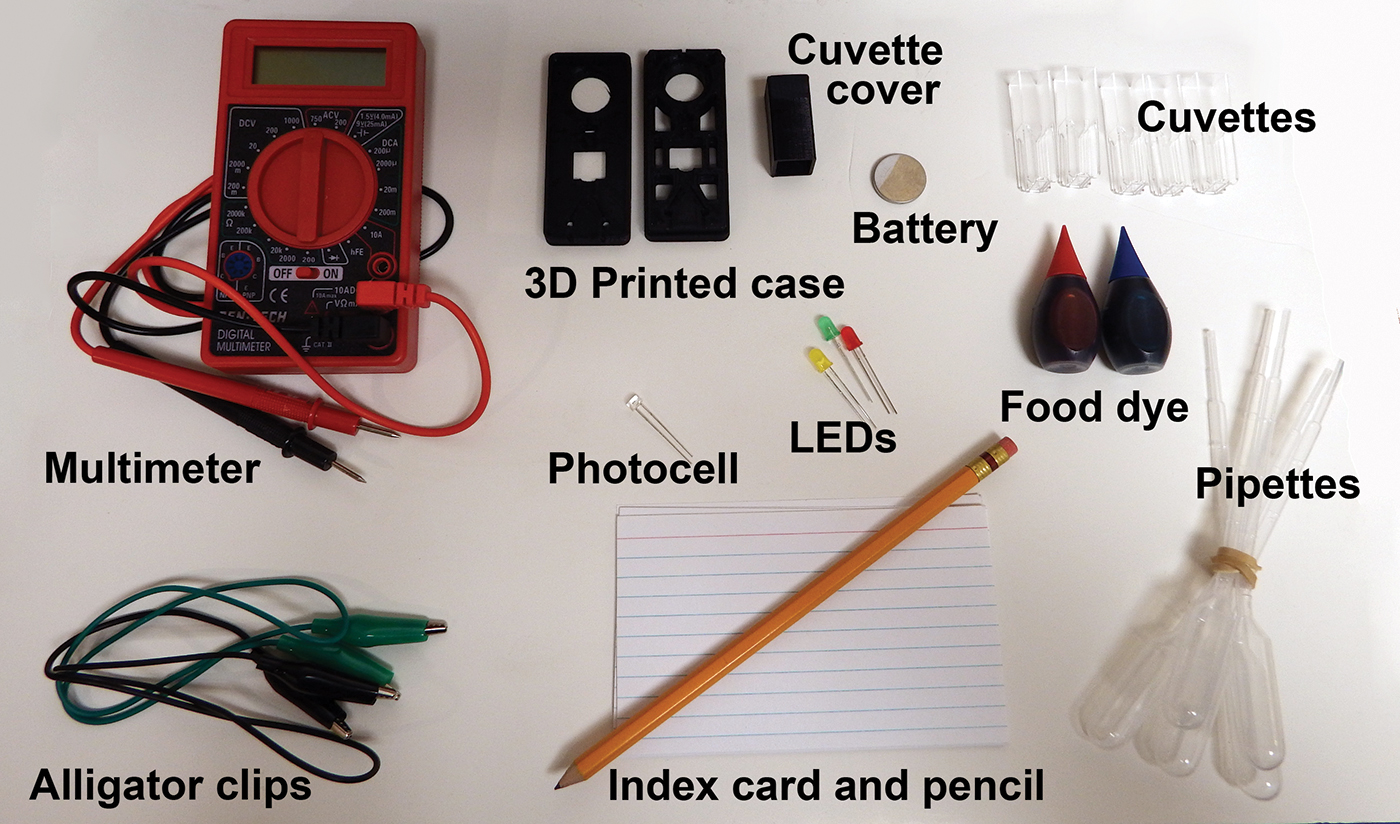
Classroom colorimetry toolkit
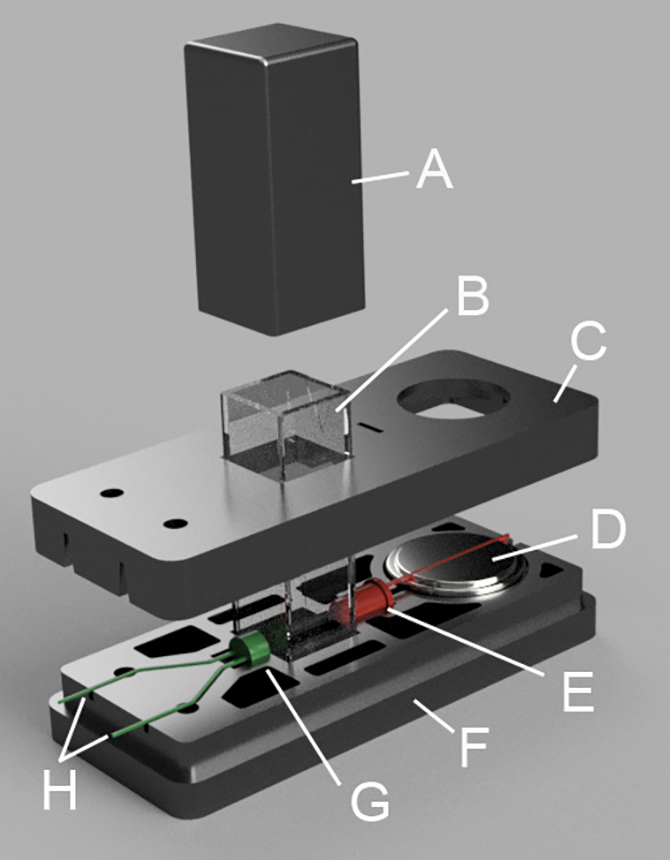
Assembling the colorimeter
The colorimeter works by sending light through a solution in the cuvette. The photocell detects how much light passes through the cuvette, and the multimeter measures this as resistance (Ohms), a measure of how difficult it is for electricity to flow. The amount of light that passes through the cuvette relates to the concentration of the samples, with more concentrated solutions absorbing more light, and showing a lesser resistance. Beer’s Law describes this phenomenon and offers a handy way to determine the concentration of an unknown solution.
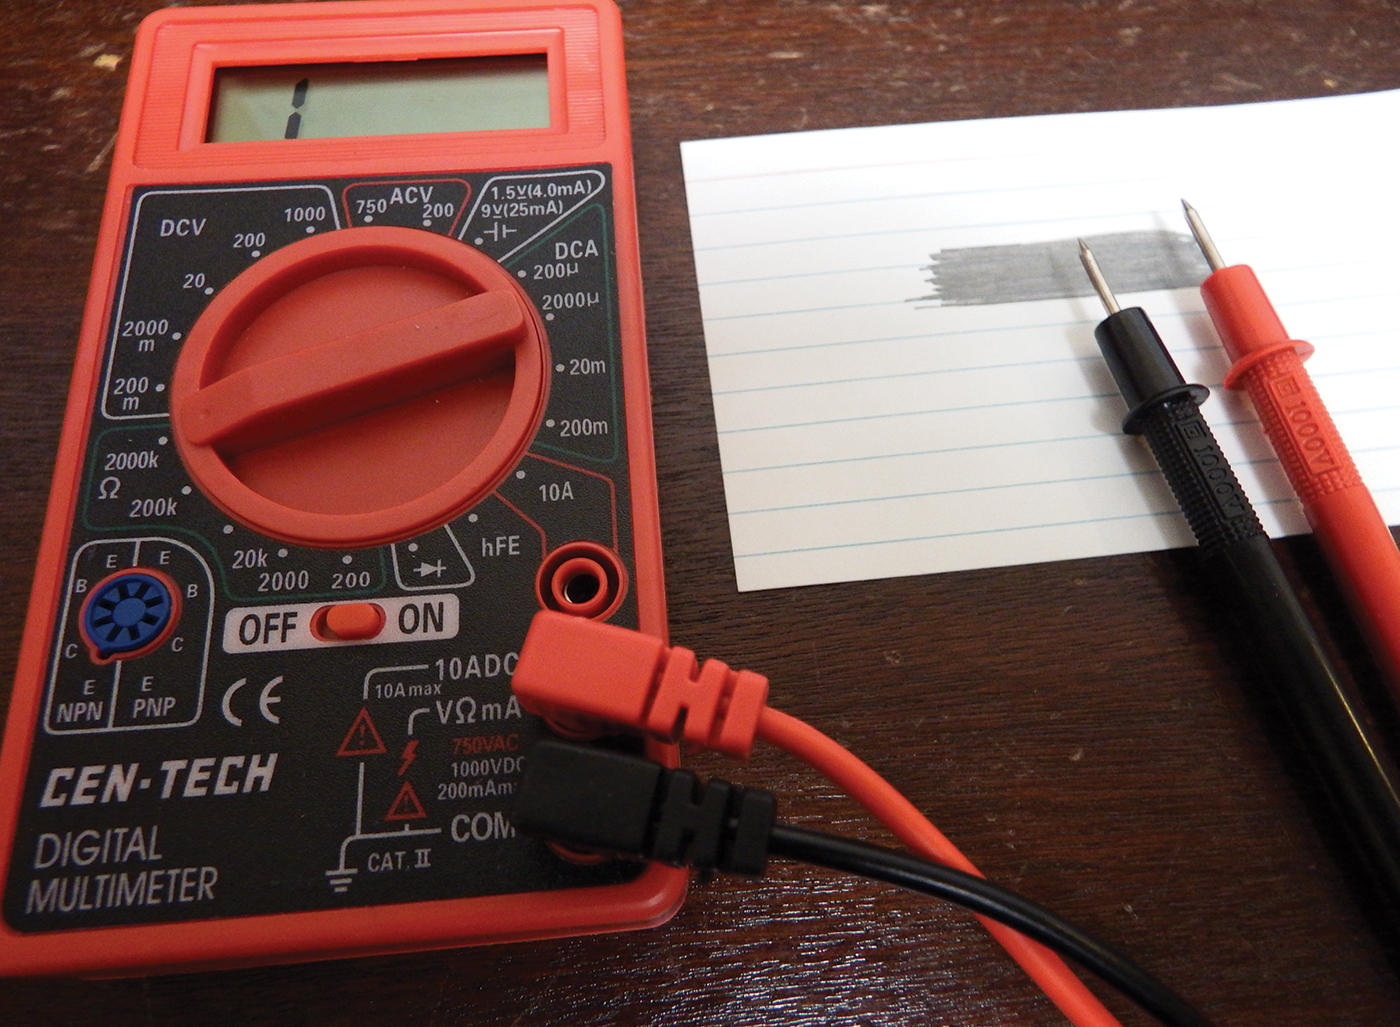
Checking resistance with probe and multimeter
Now it’s tinkering time! After demonstrating how to set up the colorimeter, let students test various combinations of lights and dyes. As they tinker with the toolkit, questions quickly arise. Does the color of the LED light matter? Which one works best? What happens if we change the color of the solution? The simplicity of the toolkit colorimeter allows students to freely explore the component parts, building their knowledge of instrument design alongside experimentation.
A simple analysis reveals interesting results. When a red LED light is used with a red dye solution, little or no change in resistance is observed. This is because red LEDs emit light that is reflected (and not absorbed) by the dye. If a green dye is used instead, it will strongly absorb the red light, its complementary color on the color wheel (Reusch 2013), and show an increased resistance. See “Digital Resources” for example data.
Next, students explore how the concentration of dye affects light absorbance with serial dilutions. Starting with one drop of dye in nine drops of water, take one drop of this solution and combine it with nine drops of water in a separate cuvette. Repeat three times for a total of five dilutions. With the best LED light in the colorimeter for the chosen dye (e.g., red LED and green dye), record the resistance of each dilution.
Convert the data into a straight line by graphing the “absorbance” (calculated by taking the log of the resistance of the sample divided by the resistance of the blank) on the Y-axis and concentration on the X-axis. Use the equation of this line to determine the concentration of an unknown sample given from the teacher (see “Digital Resources”).
This tried-and-true activity takes on new meaning when students use their homemade colorimeters to collect the data. It also helps them practice lab skills requiring careful execution to ensure quality data. Conclude by asking students to share their results with the class before conducting a self-assessment of their own (see “Digital Resources”).
Homemade vs. commercial colorimeters
Unlike Vernier colorimeters that calculate absorbance for you, the toolkit colorimeter requires users to calculate absorbance from resistance. The cheaper toolkit colorimeters also suffer from unstable measurements and inconsistencies between LED lights. Despite this, a side-by-side comparison shows similar results, with a 0.99 correlation coefficient for the Vernier absorbance curve and 0.95 for the toolkit colorimeter.
Advanced activities
These toolkits could be useful for several subjects. For example, biology classes could use them to quantify glucose concentration in foods using Benedict’s solution or to study chlorophyll in plants. Chemistry students could analyze color changing acid-base titrations. Engineering students could explore more advanced design modifications.
Safety concerns
Be aware of the risk of electric shock. While the batteries used in these toolkits are at a relatively low voltage, keep all components dry and away from water. Use multimeters as directed by the manufacturer. Lab goggles or an apron can protect eyes and clothes from the dye.
Conclusion
Having used this lesson in three high school classrooms, we find it successfully supports NGSS, engaging students in asking questions, analyzing data, developing models, engineering design, computational thinking, and crosscutting concepts related to cause and effect and energy and matter.
Labs Makerspace Physical Science High School