
Brief
A Teamwork-Based Technique Using Agricultural Fields to Measure the Speed of Sound
Connected Science Learning September–October 2022 (Volume 4, Issue 5)
By Gordon H. Miller and Helen Belefant-Miller
The most straightforward method to measure the speed of sound compares the speed of sound directly to the speed of light. This lab was developed to avoid the convoluted techniques (e.g., piping and numerous computations) that are abundant in sound measurement exercises but are of little interest to non-STEM students. The disadvantage of direct measurement is the distance needed for the sound to travel to get reasonable measurements. Though a straight piece of road or parking lot would work, long, quiet, safe areas with a clear line of sight are difficult to find in hilly and urban areas. One solution is to take a field trip to an agricultural facility and use a car, an air horn, soccer cones, and cell phones to help students measure the speed of sound.
Agricultural facilities tend to have plots laid out in parallel lines and straight roads to access these plots. Since agricultural locations are frequently exotic to many students, this aspect promotes remembrance and retention. Spreading students along a distance allows for using the scientific method by comparing results at the different distances. Also, having students work in small teams at each distance interval increases the participation of each student. Our students saw other students collecting data and taking care of plants or animals, introducing them to other career paths. While there are many positives for students, the agricultural facility also benefits from the activity by getting to publicize itself to students and potential workers.
Lab Setup
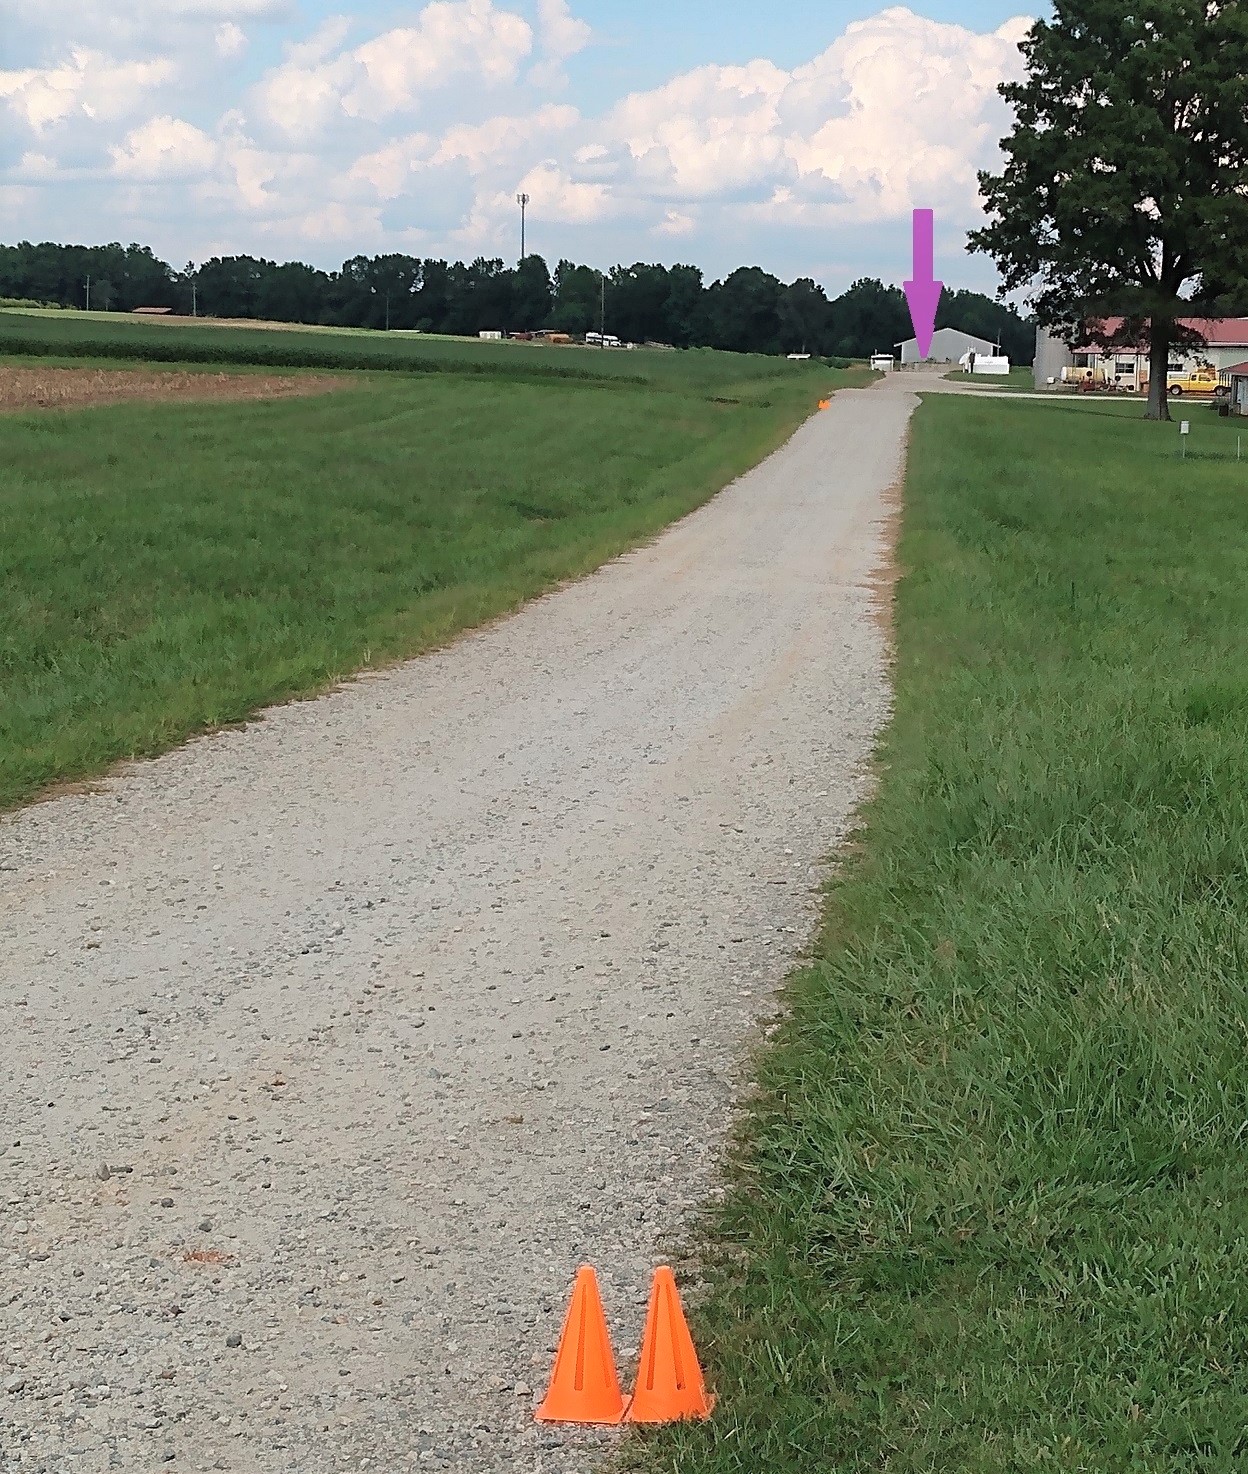
Several setup tasks needed to be completed before students could do the lab. Once the teacher identified an appropriate road, the line of sight was tested to ensure that it was clear along the whole distance and that the car lights and an air horn (a car horn is not loud enough) could be seen/heard at the farthest distance (Figure 1). The odometer on a car was used to locate 0.1 mile intervals along a 0.5 mile stretch of road, which were then marked with soccer cones (see Figure 1). Miles were used rather than an SI unit because the students were familiar with miles; they later convert the miles to meters. A map application (e.g., Google Maps) can also be used to locate or verify the intervals.
Speed of Sound Lab
Once students arrive at the agriculture station, the lab takes about 1.5 h (including the pre- and post-discussion). The actual time to obtain the data takes less than 10 minutes. The cost of the lab was minimal as the agriculture station provided the air horn and students provided the cell phone timers.
On the day of the field trip, the sequence of activities was as follows:
1. Students and the teacher met in a classroom at the agriculture station.
2. The students practiced using their cell phones as timers.
3. Students were divided into groups and sent to different interval markers at 0.1 mile increments up to 0.5 miles from the position of the parked car.
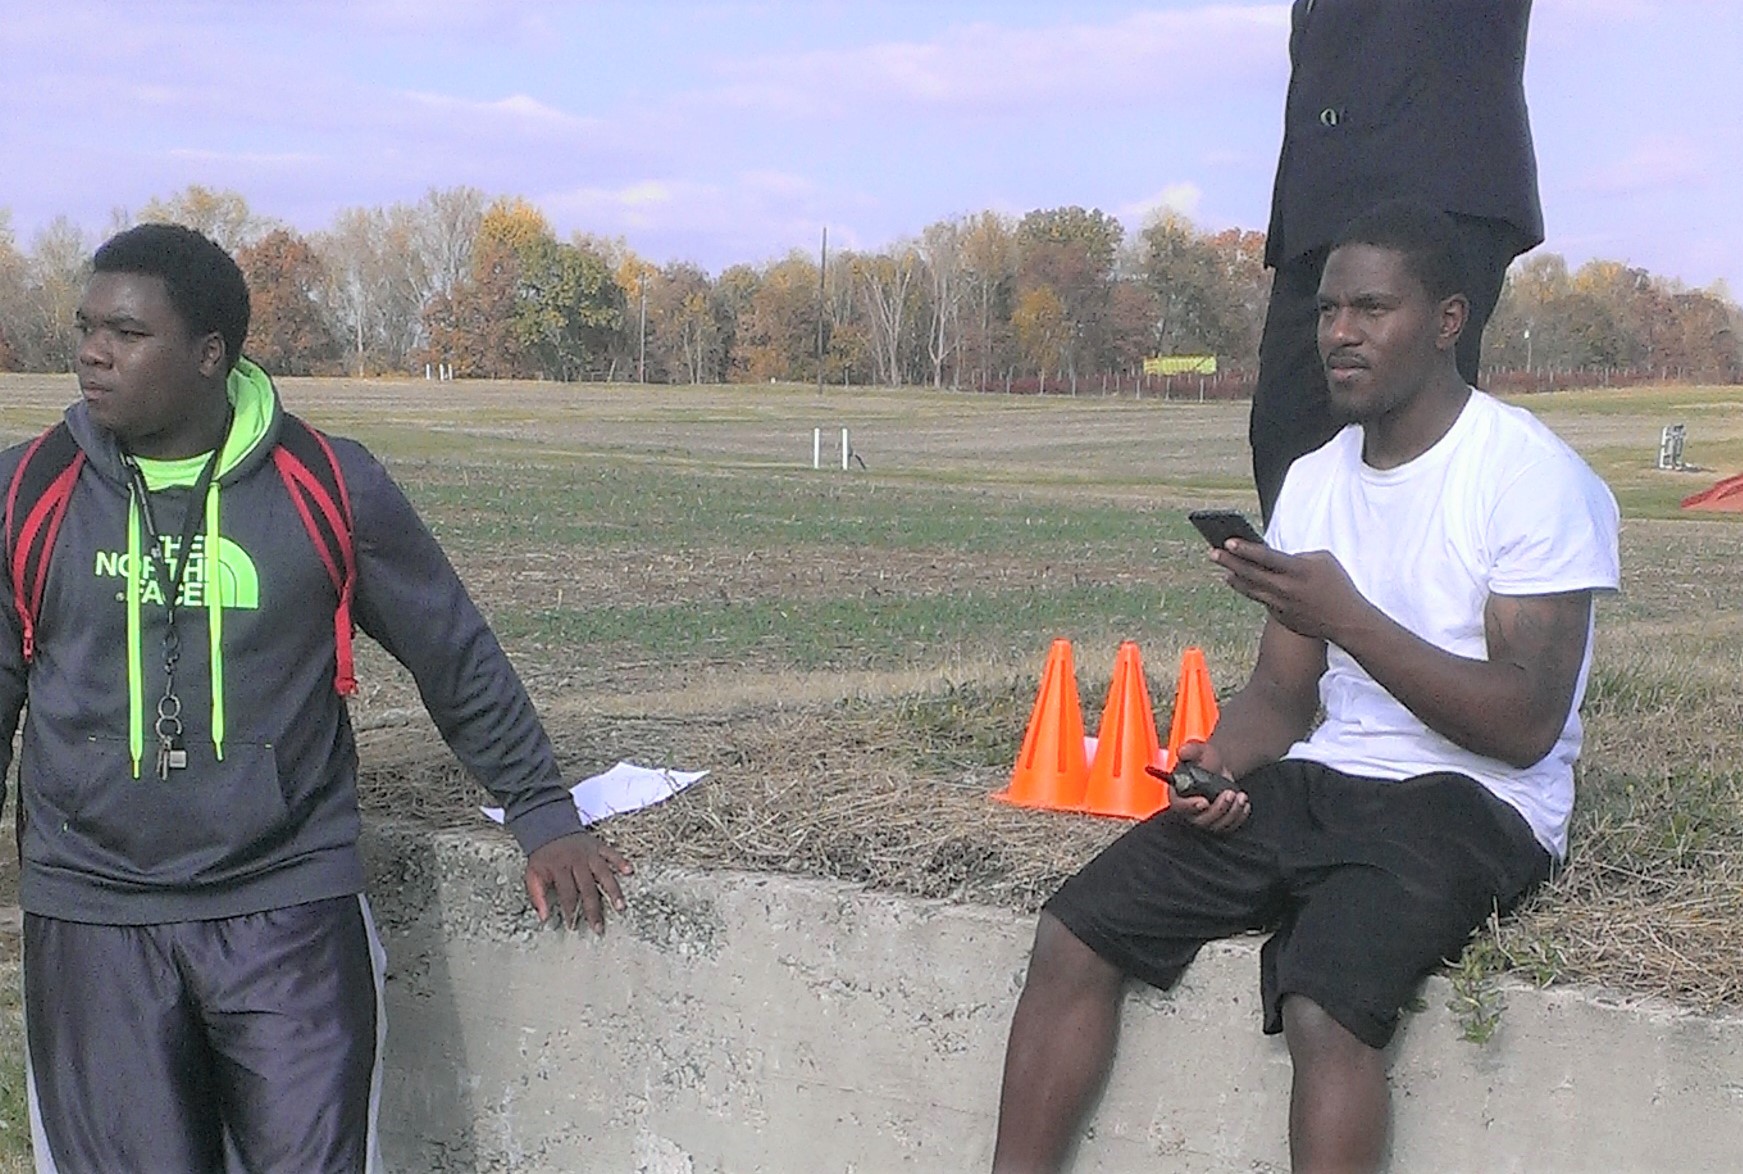
4. The teacher and the groups at the 0.5 mile markers established cell phone or walkie-talkie contact to ensure students' readiness for each test.
5. The teacher carried out the procedure (Figure 2) for measuring the speed of sound four times and the students measured the time to hear the horn.
6. Everyone met back in the agriculture station classroom.
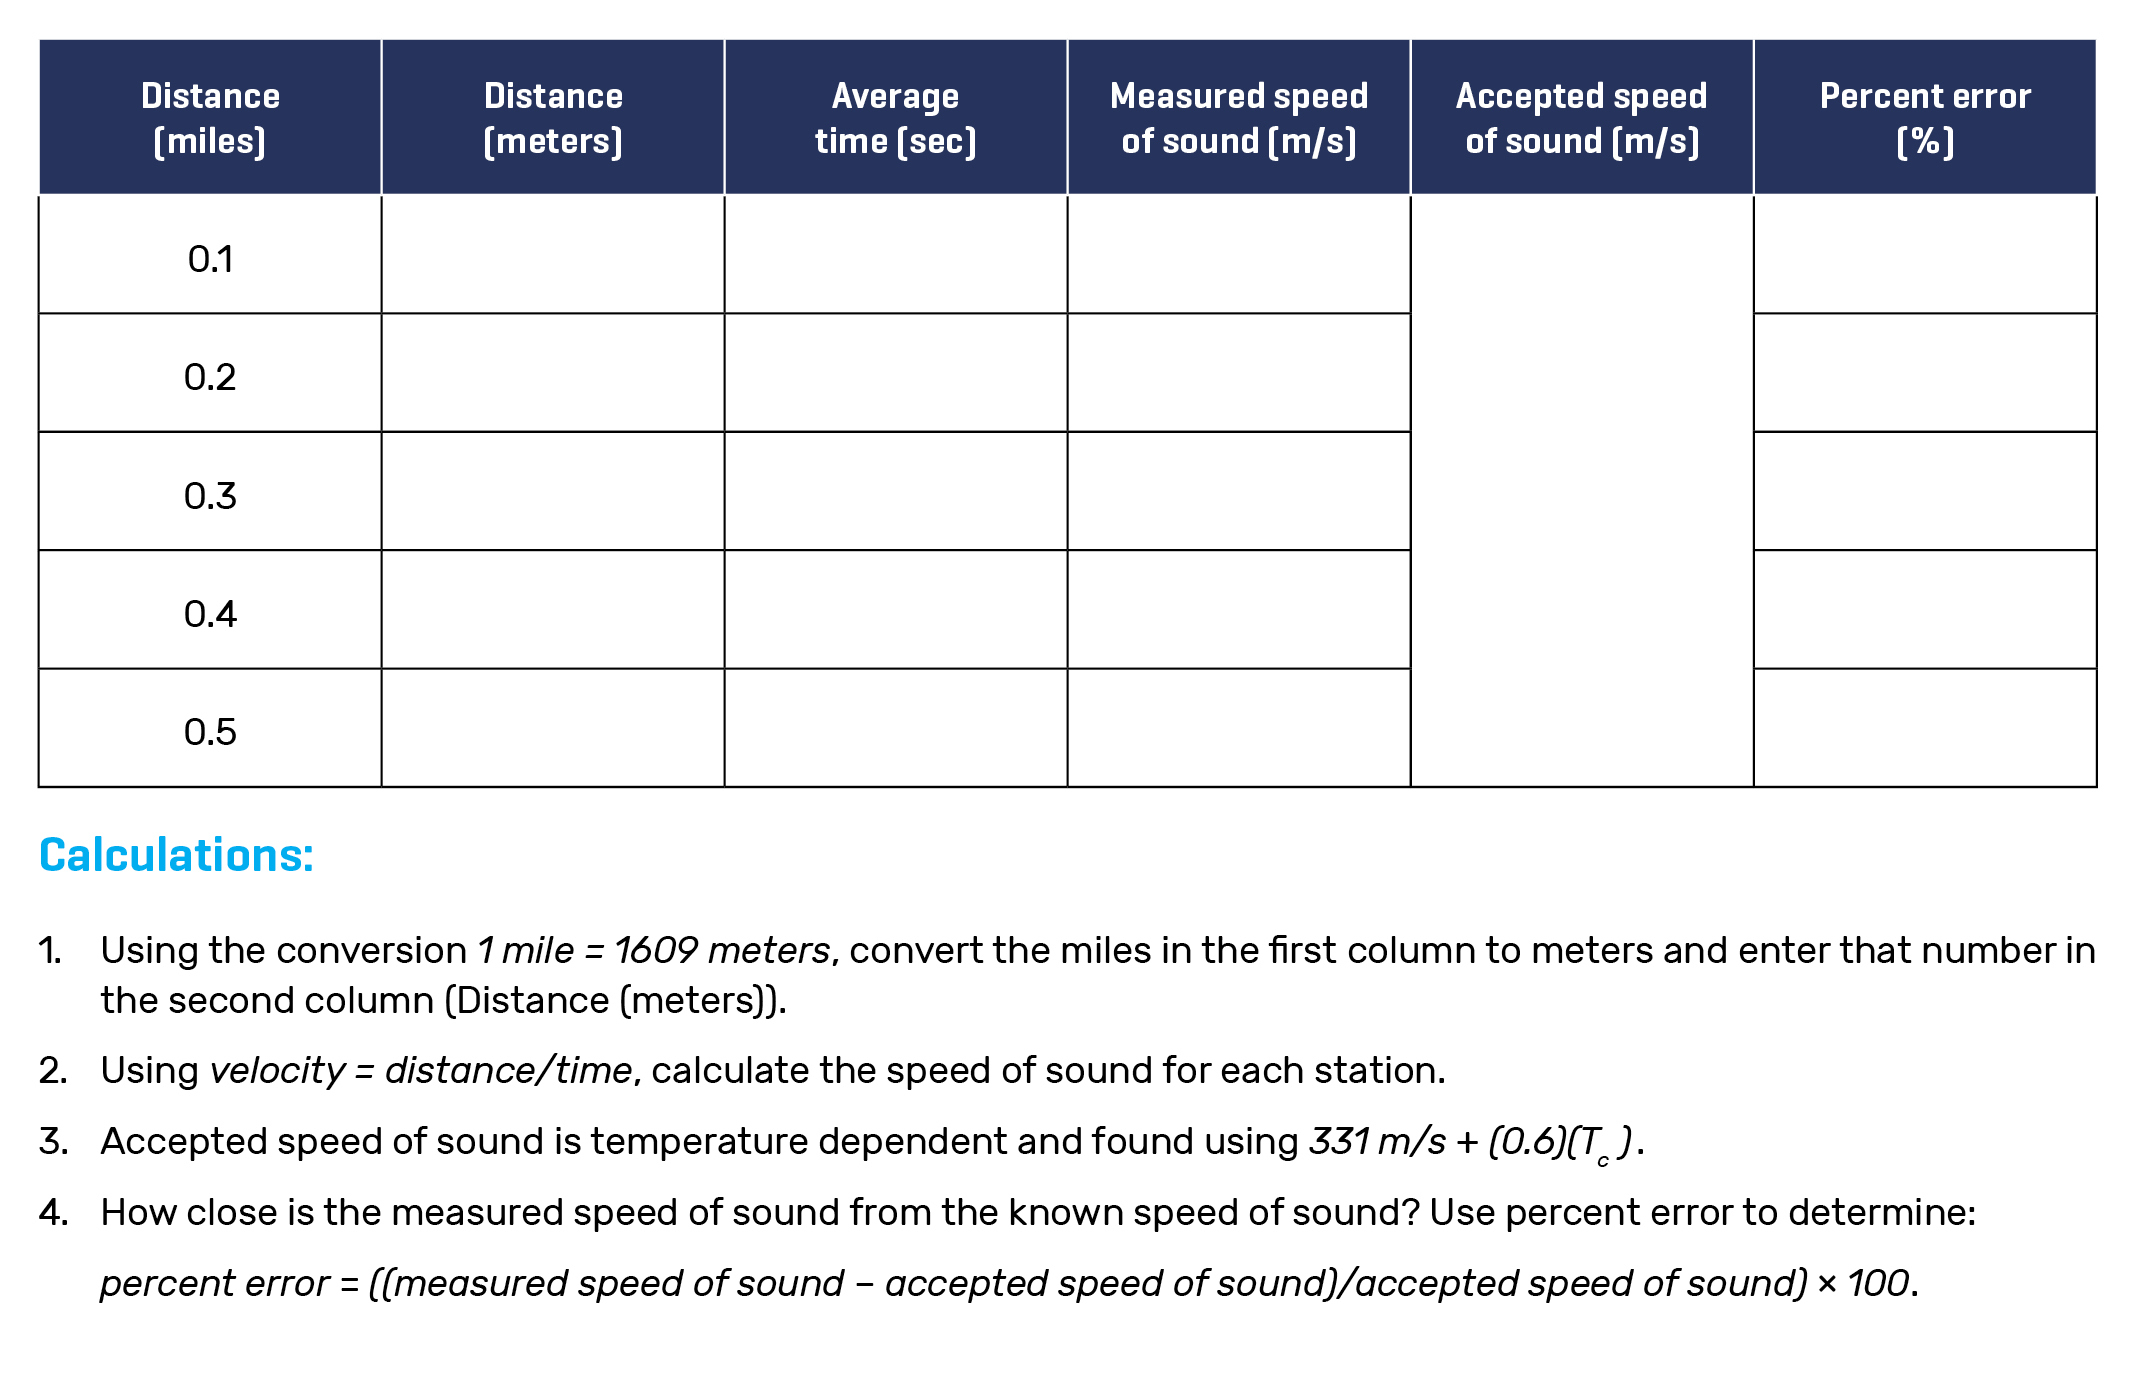
7. Each student group calculated the average speed of the group’s trials on a worksheet (Figure 3) and recorded it on the board.
8. The teacher guided students through the calculations to determine the speed of sound.
9. Using the collected data, students drew a graph on the board of the data ranges, average speeds of sound, and percent errors relative to distance.
2. The teacher in the car at distance 0 simultaneously (with prior practice) turns on the headlights (on high beam) and sounds the air horn.
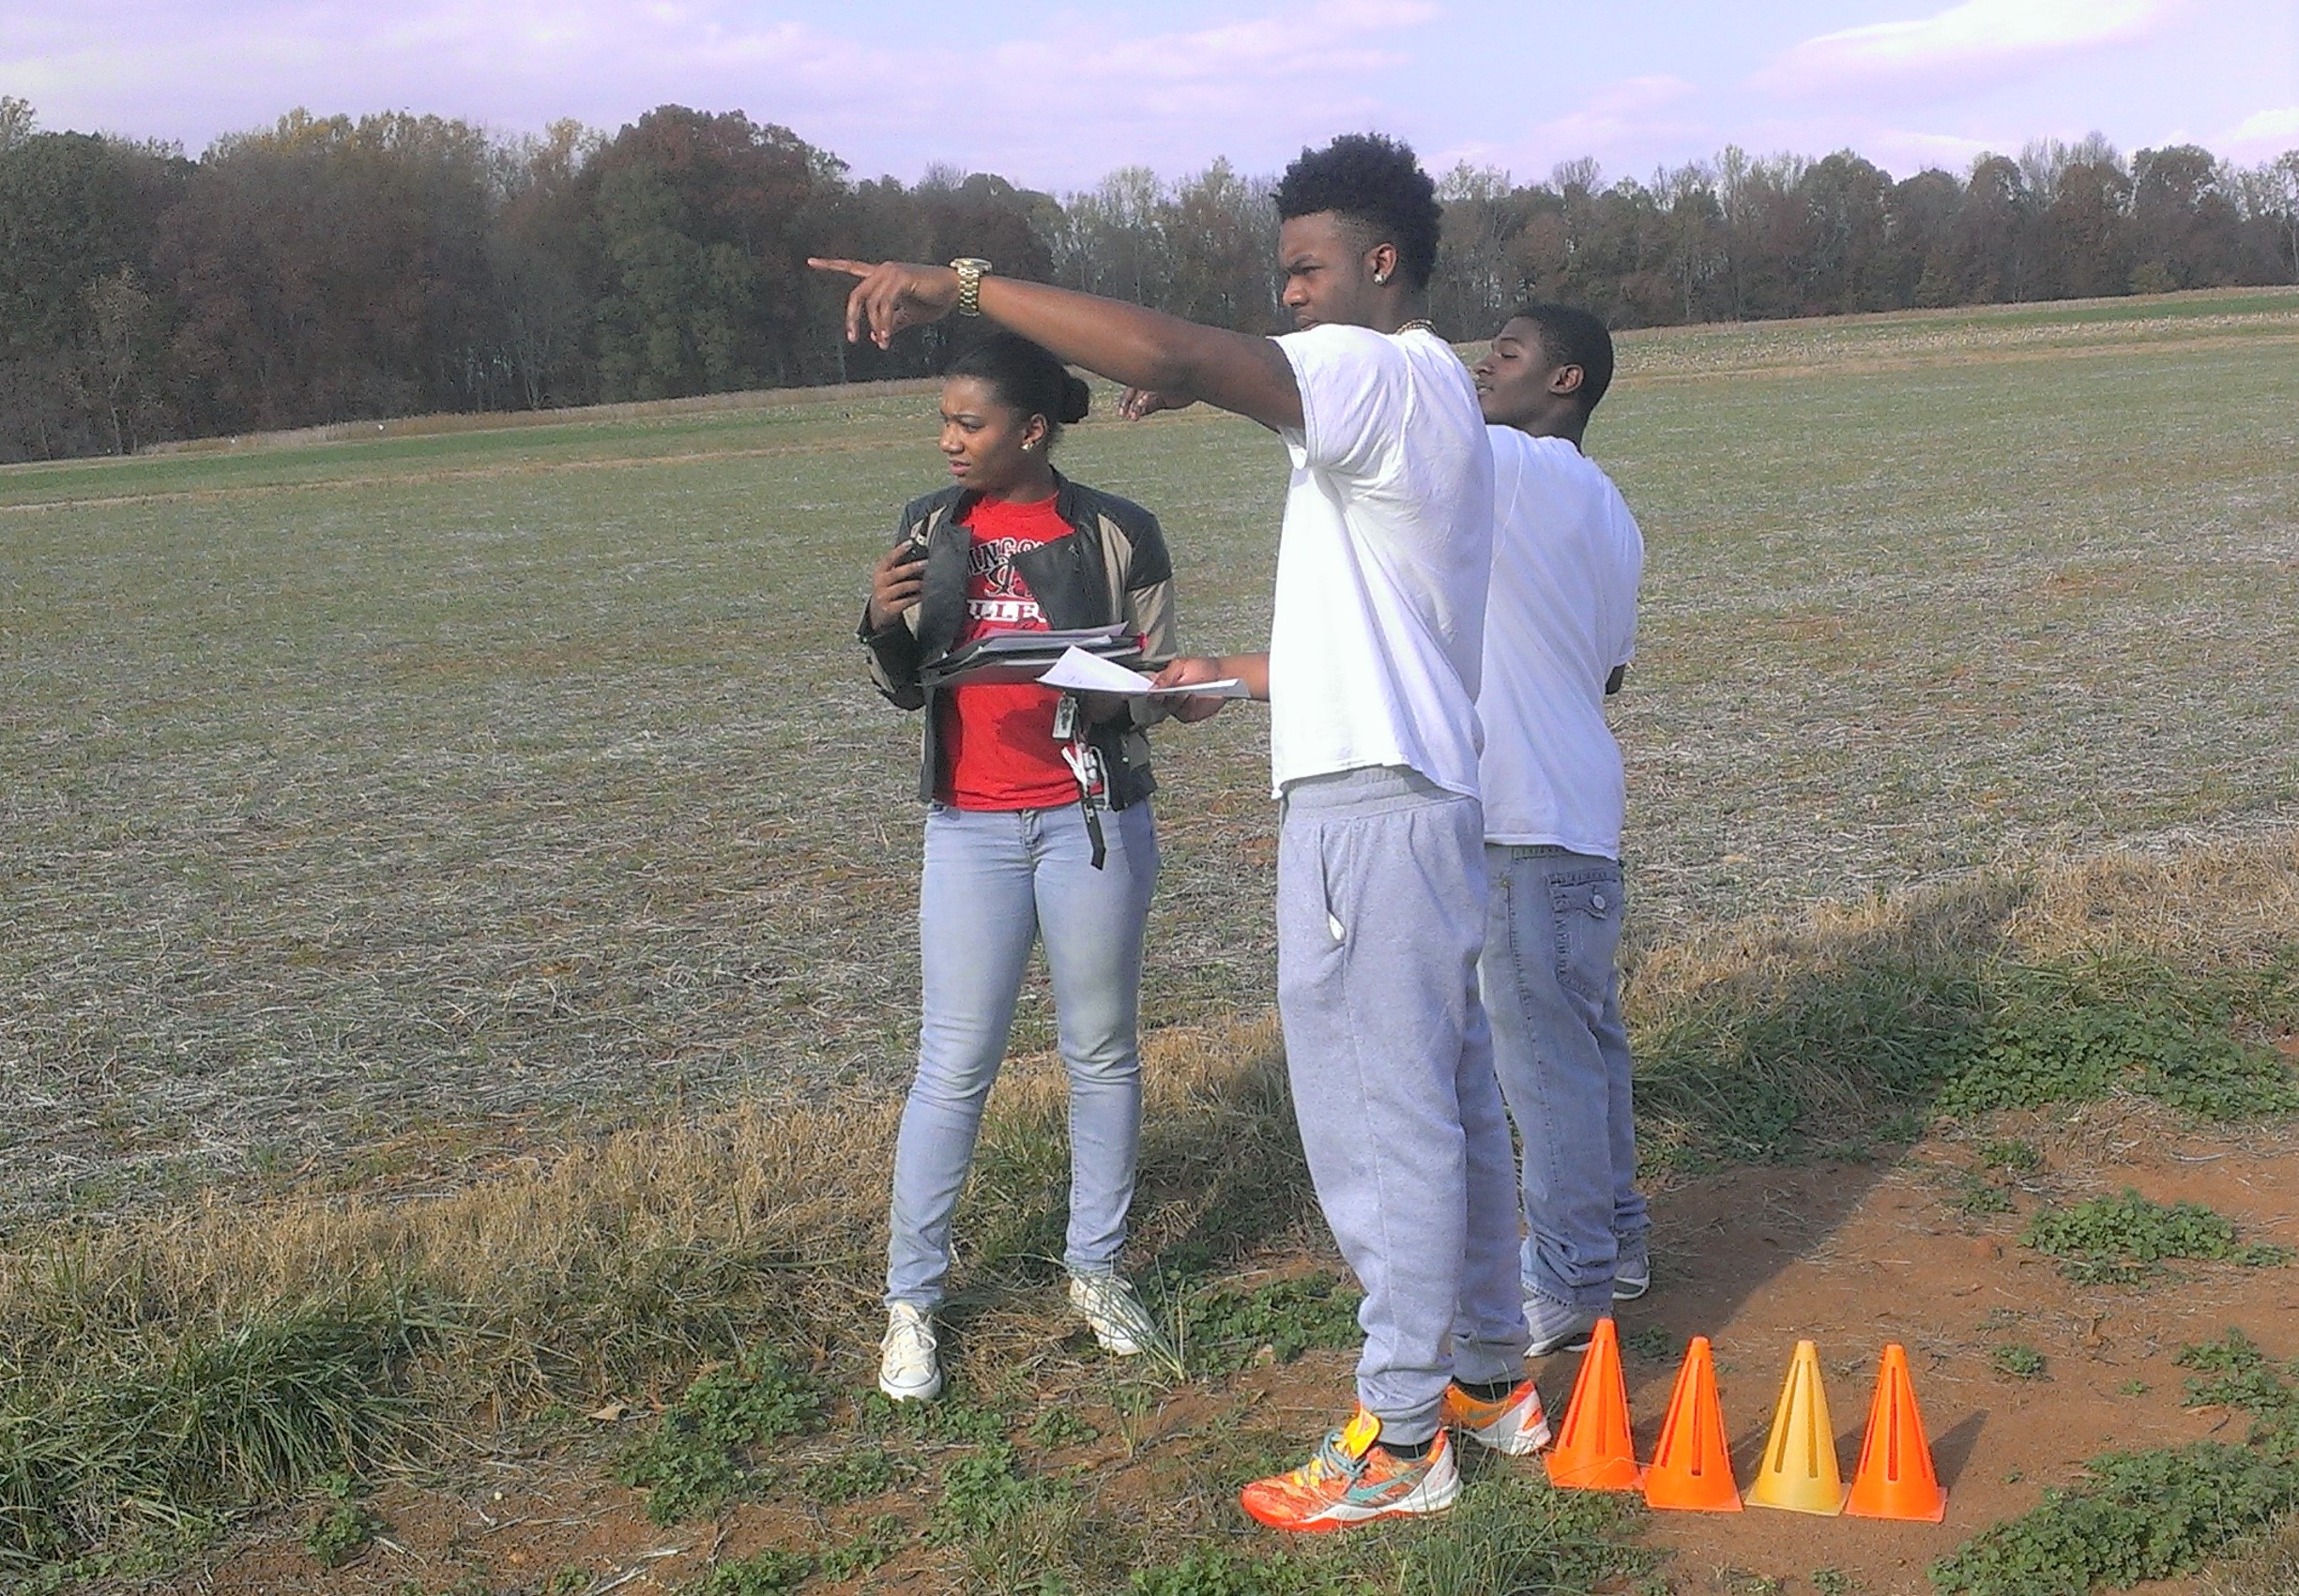
3. The students at each interval start their timers as soon as they see the light and stop the timers when they hear the sound.
4. The data taker records the times on a form provided to the students.
5. The test is repeated 3–4 times and the time measurements are averaged.
Click here for larger image
It has been useful to have a discussion before and after measurements are made, using the same questions in both discussions. This repetition of questions helps students who have taken the measurements to focus on the content learned in the lab. The students also understand how the groups farthest from the car obtained values for the speed of sound closest to the known measurements while the variability in the measurements was greatest in the groups closer to the car. Useful questions include:
- Which is faster—light or sound? Faster than a race car?
- Is speed of sound a measure of distance? acceleration? position? velocity?
- What other units could you use to measure the speed of sound?
Best Practices
We want to stress the value of cooperative learning in this lab and ways to capitalize on the benefits of small groups. Left to their own devices, the students tended to cluster in one large group, sometimes with a few other scattered students. Having the instructor form the groups (instead of allowing students to choose) is helpful for ensuring a suitable group size at each interval, maximizing the diversity of each group, and speeding up the overall process. Having students in groups facilitated the following:
- ensuring that each person's data collection was important
- enabling groups to establish data collection processes through collaboration ("How'd you get 10 seconds? That didn't take 10 seconds! Don't you know how to use the timer?")
- recognizing the importance of systematic data collection and that a large range of response times would lead to larger variability in findings
- encouraging friendly competition among groups, thus increasing engagement
Students in introductory physics have been shown to learn best when they are actively engaged in hands-on or active learning (Loup and Loup 2015). The speed of sound lab demonstrates how a standard laboratory experience can be reframed to improve student outcomes. This has been one of our most successful labs; students, years later, can still recount their experience. Indeed, an in-class pretest on the speed of sound had an average of 47%, while a posttest given weeks after the field trip had an average of 90%.
Gordon H. Miller is an assistant professor at Livingstone College in Salisbury, North Carolina. Helen Belefant-Miller is a retired agricultural research scientist in Kannapolis, North Carolina.
Resources
To locate a suitable, publicly funded research station, reach out to the following groups:
- 4-H
- USDA Agricultural Research Service
- County Extension and Agricultural Experiment Stations for each state
- Individual colleges may also have farms/fields available
citation: Miller, G.H., and H. Belefant-Miller. 2022. A teamwork-based technique using agricultural fields to measure the speed of sound. Connected Science Learning 4 (5). https://www.nsta.org/connected-science-learning/connected-science-learning-september-october-2022/teamwork-based