
Different Strokes for Different Folks
Cross-curricular differentiation strategies for inclusion classrooms

Students with disabilities spend the majority of their day in the general education classroom (U.S. Depart - ment of Education 2017). However, these students consistently underperform in science. This highlights the importance of using effective differentiated instruction. Ac - cording to Mastropieri and colleagues (2006), differentiated instruction should include approaches and strategies to ad - dress diversity in student needs, interests, experiences, and abilities. Our inquiry-based lesson highlights cross-curricular differentiation strategies we found to be successful in our inclusion classroom.
Our third-grade class included seven students with dis - abilities, four English learners, and five students without dis - abilities. We structured cooperative groups based on ability to complete a task and to negotiate differences and ended up with four fairly heterogeneous groups of four students each. The structure of our lesson originated from the engineer - ing design process described by the Next Generation Science Standards (NGSS Lead States 2016). Prior to beginning the lesson, we administered a pretest to gauge students’ under - standings of engineering. Based on the results, our students’ initial perceptions regarding engineering were naïve and limited, depicting engineering to involve mostly fixing cars or working on machines.
Introducing Galimoto
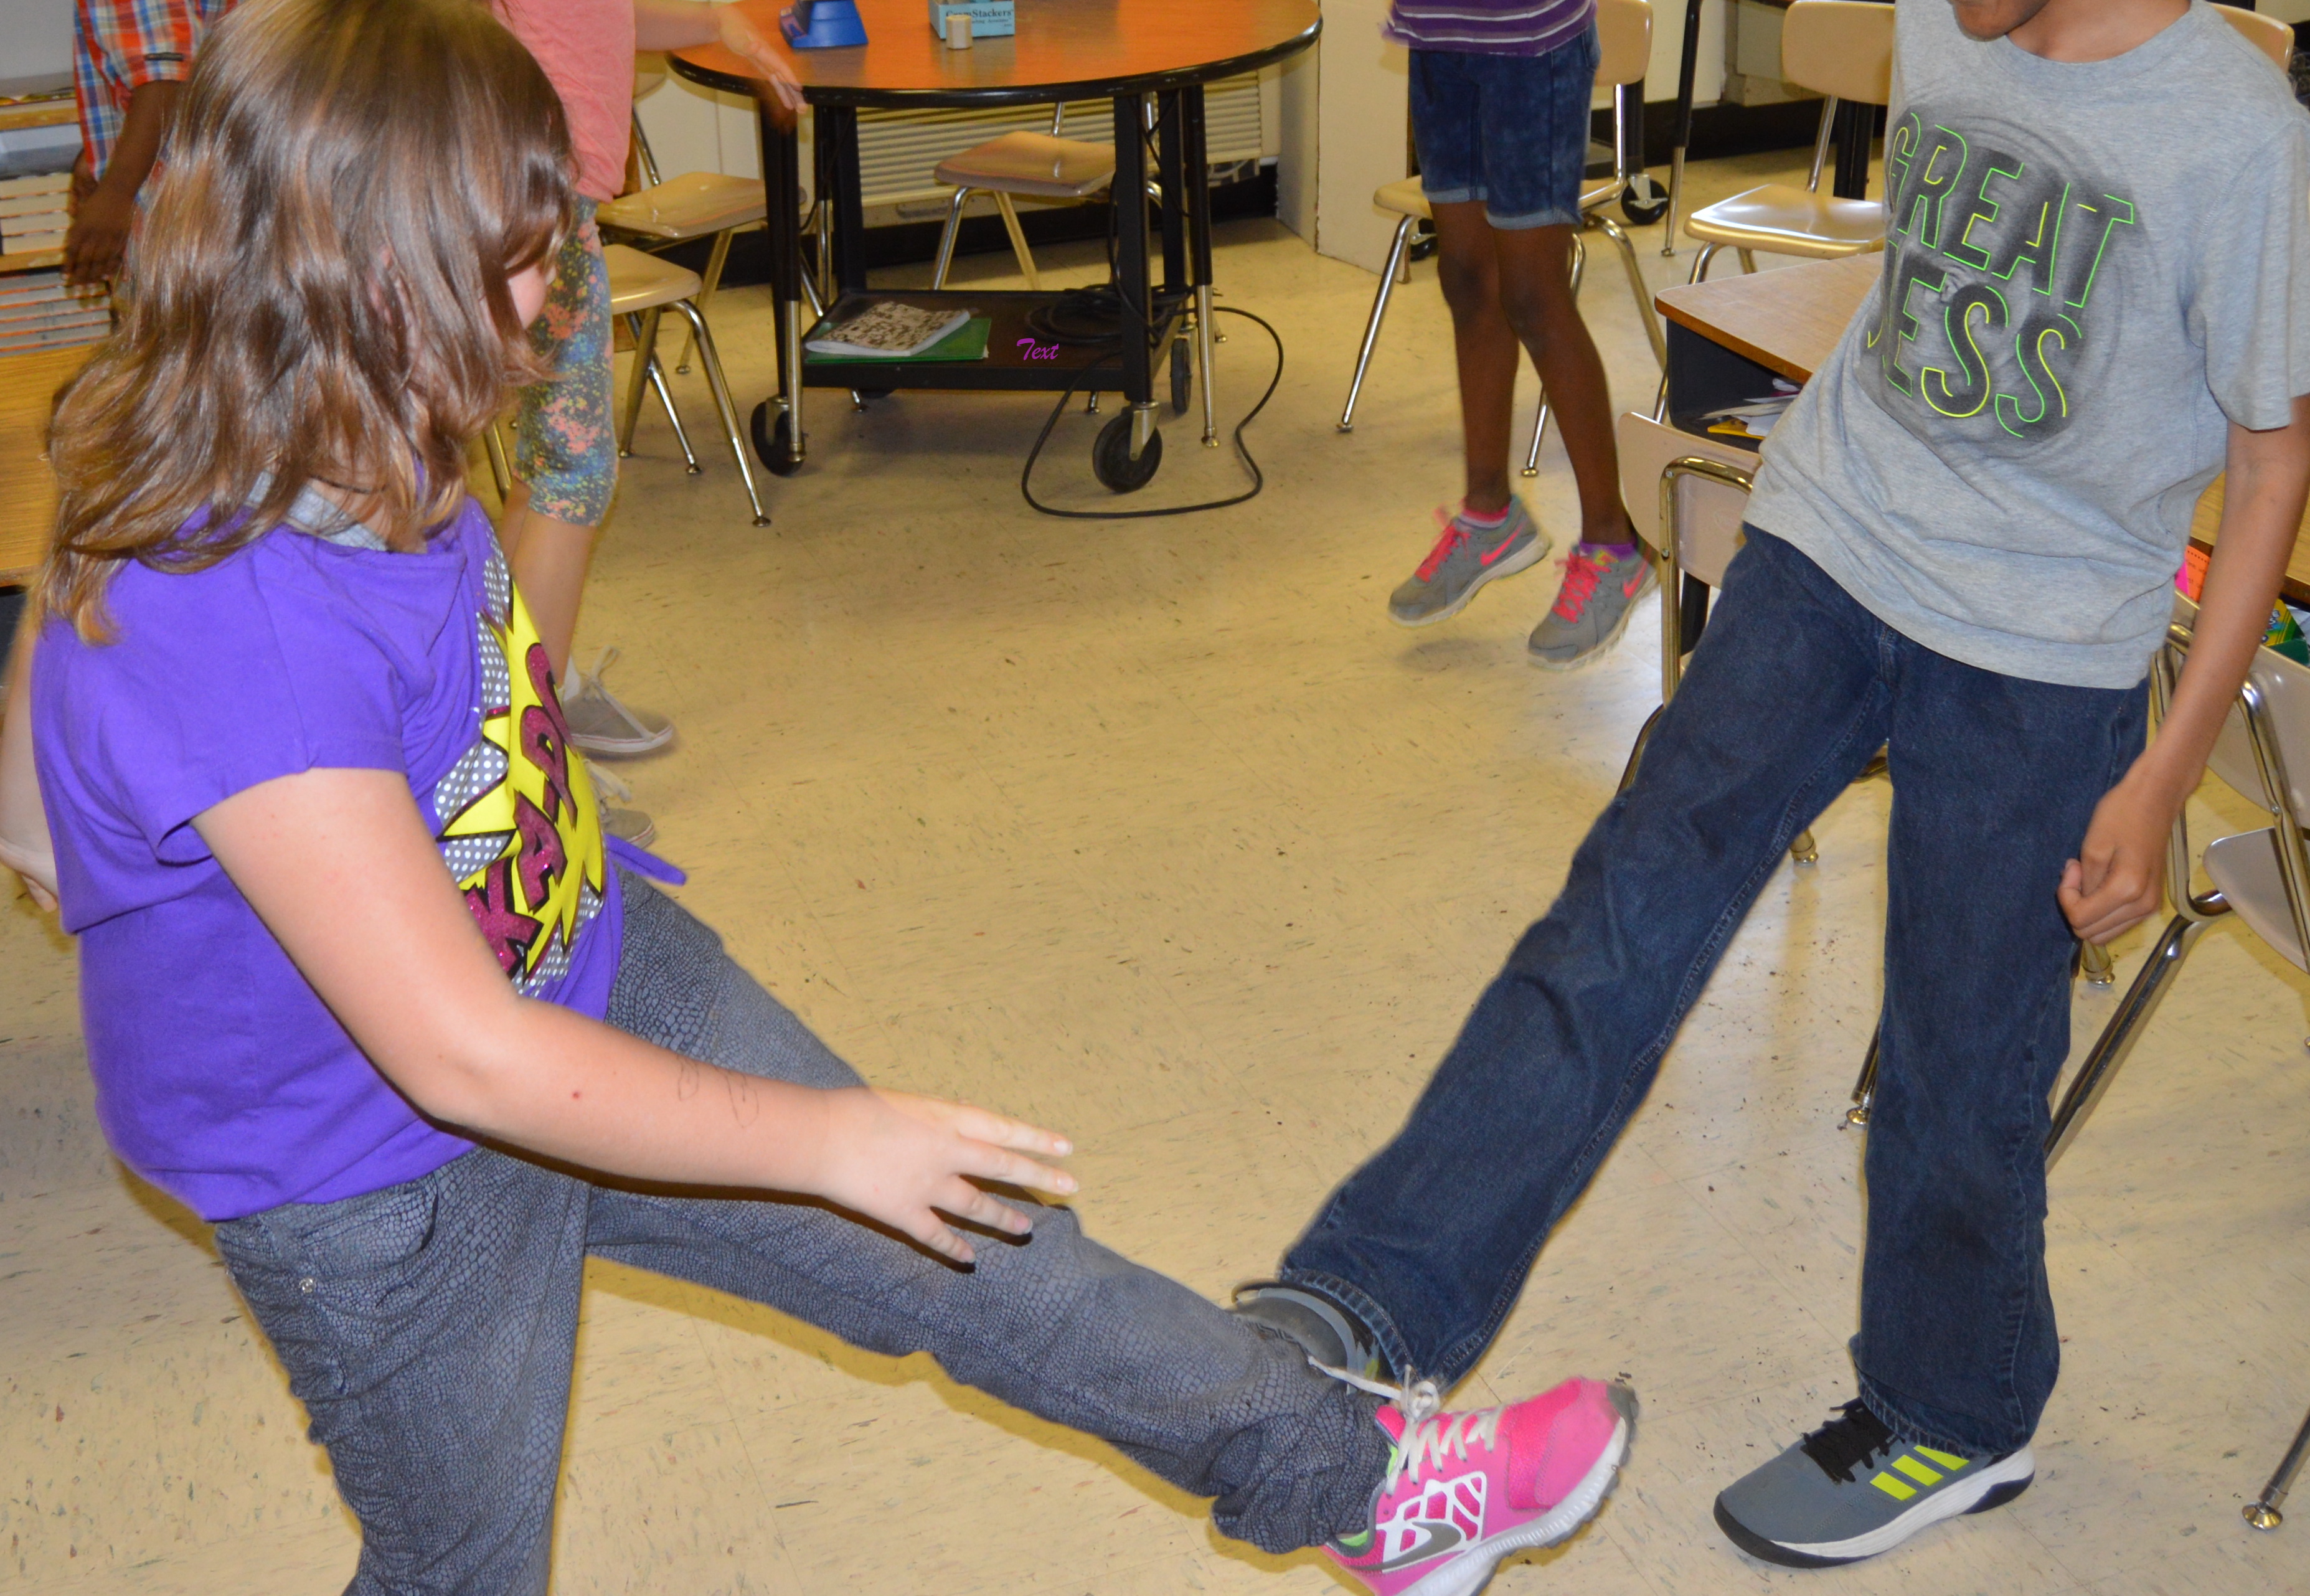
The children’s book Galimoto (Williams 1990) is the story of Kondi, an imaginative boy who collects materials to make a galimoto, or toy car. Despite the naysayers who tell him he will never gather enough material, Kondi successfully de - signs a fine galimoto (see Internet Resources). Before reading Galimoto aloud, we activated students’ prior knowledge of Malawi, Africa, the setting of the book. Students located Malawi on a map, then we discussed etiquette in Malawi, such as how to make a proper handshake and how people used no utensils (many students loved this idea!) and ate with their right hand because the left hand was considered dirty. The students then chose partners to play an African game, Ampe (see Internet Resources). We incorporated multimodal instruction into most of our lesson, due our diverse student population. Using many different modalities (e.g., auditory, visual, kinesthetic) to convey information creates a dynamic learning experience for all students in the classroom.
After the read-aloud, we asked students how Kondi could be considered an engineer. Most answers were similar to “He is working on a car.” This led us to share with students an engineering anchor poster detailing characteristics of engineering (Capobianco et al. 2011; Figure 1). We challenged students to find examples that demonstrated how Kondi resembled an engineer. For several students who processed information through multiple modalities (e.g., linguistic, visual, auditory) a copy of the book was offered to assist them in finding examples. We listed students’ answers on chart paper beside the anchor poster: he uses creativity, he uses science because he understands what the materials can do, he uses math because he makes his galimoto out of different shapes, he has a design for his galimoto in mind, he solves a problem by making a toy because he does not have money to buy one.
Characteristics of an engineer poster.
An Engineer …
- Is creative
- Uses science
- Uses math
- Uses technology
- Works in teams
- Designs everything around us
- Solves problems to help people
- Can be someone like you!
(Capobianco et al. 2011)
Assembling Materials
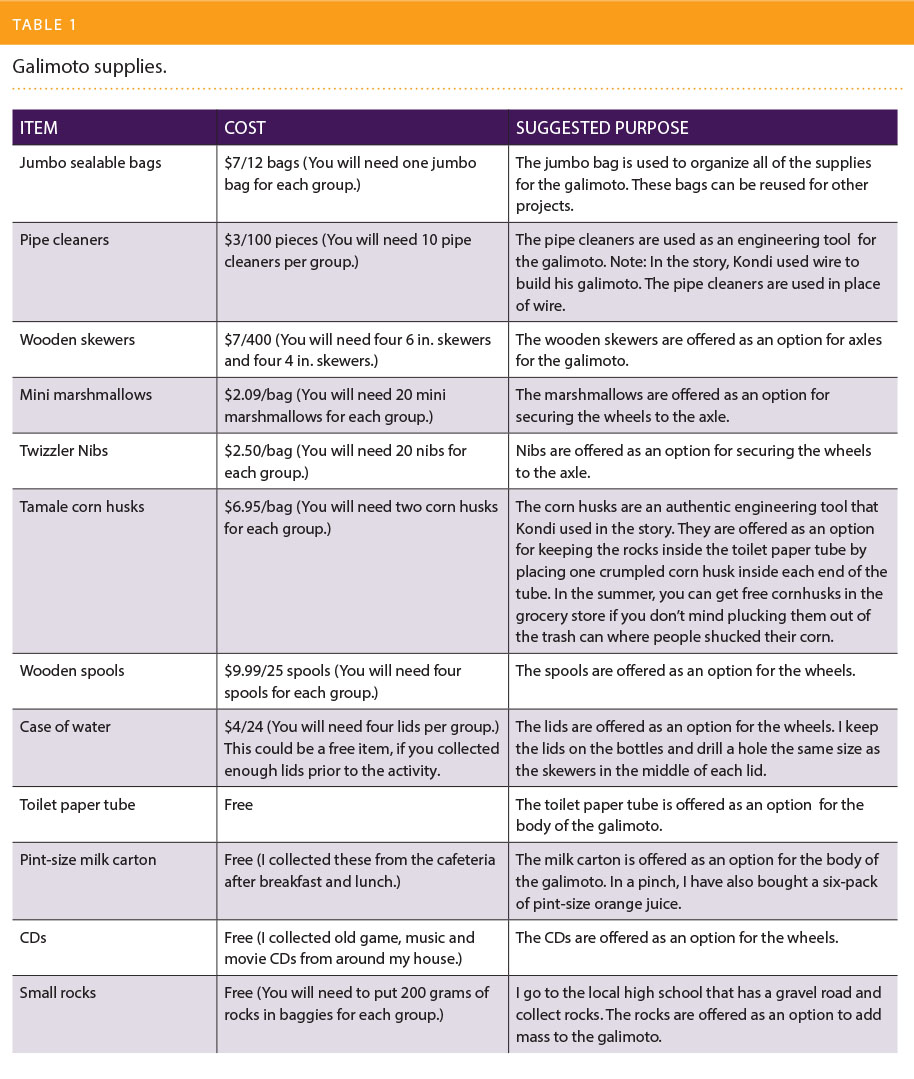
Letting students with disabilities preview materials is a great way to differentiate an activity. Many of our students processed information much slower than their peers and needed more think time. While these students assembled materials, the teacher casually asked them questions like, “What do you think you are going to use these things for? Let’s say you had to build a vehicle using these materials, could you do it?” To differentiate materials, we gave one group the bag with the more difficult items to work with. We knew from experience that designing a galimoto using a milk carton for the body and CDs for the wheels required much more dexterity, and students with poor fine motor skills would find it difficult to work with those items. See Table 1 for a list of items used to design the galimoto and their cost.
We chose food items for students’ galimotos because nibs and marshmallows were inexpensive and one bag of each supplied materials for all the galimotos. However, using modeling clay would be a great alternative for teachers who do not want to offer candy as a building tool. Be sure to remind students that no eating of building materials is permitted!
Defining the Problem
To begin the lesson, we gave one bag of materials and a cost sheet to each group and a Design Challenge sheet to each student (see NSTA Connection). We read aloud the directions from the Design Challenge sheet. A company called Racer challenged students to design a galimoto, or toy car, that moved freely at least 20 centimeters, looked cool to kids, and cost less than $1 to make. Student questions at this time were minimal but quite thoughtful.
April: “Do we have to use all the materials in the bag?”
Deamonte: “If we cut a wooden stick in half, do we still pay the whole price for it?”
We discussed how this challenge related to the characteristics of an engineer and students easily made connections.
Brilliant Ideas!
After our engineering discussion, students worked independently for 15 minutes to draw a galimoto and calculate the cost. We offered grid paper to students who had difficulty aligning numbers. Students who had a calculator accommodation for math were provided a calculator.
Anticipating that our students would have trouble reaching consensus on what individual elements to include in their group design, we developed, posted, and modeled a systematic process for students to make such decisions.
After that, students presented their independent design and associated costs to their small group. Then students chose parts from their independent drawings for a group prototype.
Building and Testing Prototypes
Before students were allowed to build and test their galimotos, a safety talk was in order. We handed out goggles and cautioned students about the possibility of flying objects. Students were told they need to report any broken supplies that could harm someone to the teachers. We also instructed students NOT to eat the candy or marshmallows in their bag. With much anticipation, students began to build and test their prototypes.
We set a building and testing time of 30 minutes. When students were ready to test their galimoto, they placed it on two science textbooks stacked on top of each other and let it go down a whiteboard ramp.
Many of students’ first prototypes did not even make it down the ramp. In fact, while building and testing their prototypes, students’ galimotos failed in many ways and initial ideas had to be amended. The structure of the lesson worked well for the heterogeneous groups as consistent design failure and iteration allowed students to lead the design process with their idea. In all groups, without prompting from the teachers, students chose which part of the galimoto they wanted to design, whether it was choosing which wheels to use (bottle caps, CDs, or wooden spools), how to attach the wheels (nibs or marshmallows), what material would be used for the body of the galimoto (toilet paper tube or milk carton), or how much mass (rocks) should be added. Students took turns trying out different design ideas for their part of the galimoto, and when one idea failed, they tried a different one. We were excited to see that students who had not often led groups before were now taking charge. As students tested and retested their galimotos, we guided them in changing only one variable at a time before retesting it. This assisted them in understanding what element of the design actually impacted the distance traveled. We turned groups’ attention to the anchor chart countless times during the lesson and asked students how they were being engineers.
Math and Science
We knew that mass and friction would be concepts that would come up during testing, so we asked students how they thought increased mass would impact the galimoto’s travel distance. Most students predicted that more mass would make the galimoto travel less distance because the galimoto would be heavier. To address this misconception, we modeled by using a student’s toilet paper tube prototype to add mass (rocks) to. We put crumpled corn husks in each end of the toilet paper tube to keep the rocks from falling out and released the galimoto down the ramp. We then compared the distance traveled with increased mass to the initial distance the car traveled (see Internet Resources). The demonstration revealed that when mass was added, the galimoto traveled a farther distance.
Because of several design issues involving friction, we asked students how they thought increased friction would impact the galimoto’s travel distance. Most students’ predictions were aimed at the part of the car that contacted the ramp or the floor. Once again, we used a student’s prototype to demonstrate. We showed how the marshmallows holding bottle caps on the axle were providing friction, causing the wheels to not turn and slowing the galimoto down.
Students brainstormed a solution and they fixed the issue by poking the nibs through the skewer, making sure the nibs did not touch the bottle caps. This allowed the “wheels” to stay on, but there was no friction to slow the galimoto down. That small design change doubled the distance their galimoto traveled. The demonstration revealed that friction on any moving part of the galimoto can negatively impact its distance. Each group revisited their designs, looking for ways to reduce friction.
We also encouraged students to use a table or bar graph to present data and provided students with a blank data table and bar graph for that purpose. We had previously taught this content using explicit instruction, so we spoke to several students individually to review how to fill out the data table and make a graph of the information.
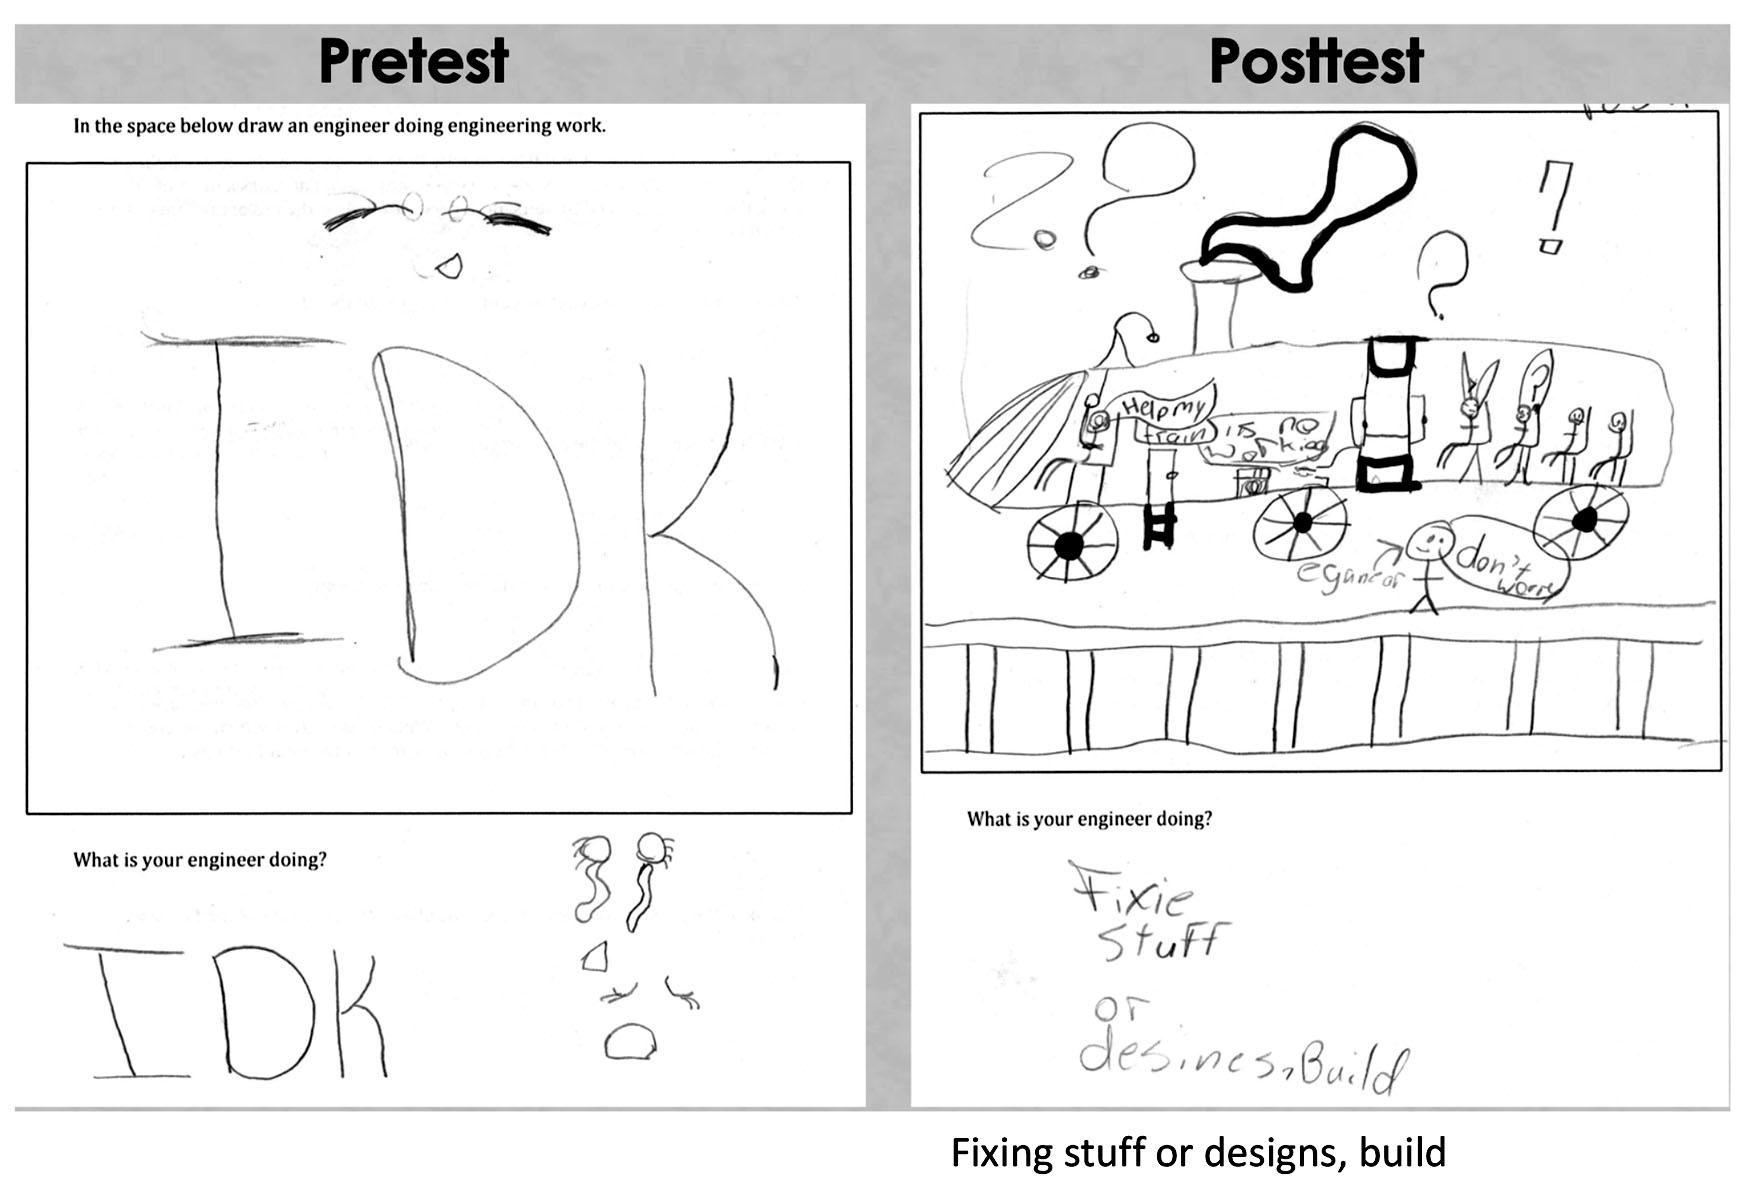
Pre- and posttest.
Redesign
The distance many of the galimotos traveled exceeded the length of one meterstick, so a meterstick needed to be put end to end several times to measure a long distance. Once again, several students used grid paper or calculators to add the distance on the metersticks together. Sporadic cheers erupted as galimotos traveled far beyond the required 20 centimeters. If a galimoto crashed into a wall without falling apart, that was another cause for celebration. Some of the conversations noted during this redesign stage demonstrated that students were beginning to understand the process:
Peyton: We added some rocks to our car to make it go farther (releases galimoto down the ramp to emphasize point).
Maddy: Someone needs to write down the centimeters in our table.
Juan: Who’s gonna make the bar graph?
Vernon: Our galimoto went 85 miles an hour!
Teacher: Where is your evidence for that? Does it have a speedometer on it?
Vernon: Oh yeah, I guess I can’t say that if I can’t prove it, huh?
Presentation of Solution
After the redesign and test session ended, we reviewed the terms claim, evidence, and justification and tasked each group to write an argument to persuade the racer company to choose their design. Students understood the data they collected would be used to link their evidence to their claim.
This writing activity provided another opportunity for differentiation. Many students with disabilities have poor fine motor skills making handwriting difficult for them. However, if given a chance to answer verbally, these students often rise to the challenge. Conversely, many English learners prefer to write information rather than verbally answer. Two group members chose each of these options.
Teachers posted groups’ arguments around the room for a gallery walk. One student stood by the poster and answered questions posed by the students and the racer representatives—the teachers. A group that stated that their galimoto looks very cool responded to questioning saying, “Kids would like our galimoto because it was made of candy and kids love candy.” When questioned about the title World’s Champion, the group that wrote the claim agreed they could not provide evidence for the title, but they thought it would sound good to the Racer people. One student noted, “Our scientific research shows that our galimoto travels farther than anyone else’s.” Another voice rang out, “But look how much it costs!”
Design Challenge Decision
After the Gallery Walk, students were reminded of the constraints of the design challenge. Their galimoto must:
- Move freely for at least 20 centimeters after traveling off a ramp (the farther the better)
- Cost less than $1 to make
- Look cool to kids
Teachers collected students’ Data Table and Graph sheet and their Cost of Engineering a Galimoto sheet (NSTA Connection) to determine which galimoto traveled the farthest and which galimoto was the most cost effective. To determine point values for distance traveled, the galimoto that traveled the farthest distance was awarded five points, second farthest distance traveled was awarded four points, and so on. The galimoto that traveled the shortest distance was given one point. Next, the galimoto that cost the least amount to design was awarded five points, the second least expensive galimoto received four points and so on. The most expensive galimoto design was awarded one point. As a math extension activity, students could be asked to determine the points awarded, but in the interest of time, the teachers chose to complete that task.
While the teachers were awarding points for cost and distance traveled, students had the opportunity to vote on which galimoto they thought looked the coolest. Students were given a ballot and asked to rank the galimotos in order from the least cool (1) to the most cool (5). Coolness ranking scores were added to the cost and distance scores to determine which galimoto the racer company would choose as their prototype.
Evaluation
We formatively assessed students’ understanding of engineering, friction, and mass using a checklist. Throughout the lesson, we circulated the room and monitored students’ learning by providing ongoing feedback, asking clarifying questions, listening to student explanations, and observing student body language. When teachers determined students were struggling, they stopped the activity, discussed the issue with students, then used thumbs up, middle, thumbs down to gauge students’ understanding before reconvening the activity. Learning was formatively assessed by conversations between teachers regarding their observations.
We administered the same pre/posttest (Figure 2) to gauge a change in students’ perceptions of an engineer as well as their understanding of math and science concepts presented during the lesson. The first part of the assessment was an adaptation of the Draw-an-Engineer-Test (DAET; Knight and Cunningham 2004). Students were asked to draw an engineer doing engineering work. We encouraged students to write I don’t know or IDK, rather than leave the box blank. The DAET was used as a means to assess students’ ideas about engineers and engineering. We reviewed the drawings and, based on student responses, identified students’ two conceptions of the actions performed by an engineer: an engineer fixes things and an engineer builds things. As expected, some students held onto their initial misconceptions regarding the nature of engineering throughout and after this initial lesson involving an engineering design challenge. Thus, it was important that we returned to the anchor chart and explicitly addressed the nature of engineering for other lessons throughout the year that incorporated engineering design challenges. It should be noted that while some students held onto their misconceptions regarding engineers, throughout the lesson the groups met the essential characteristics of engineering by demonstrating creativity, teamwork, and communication.
The remaining pre/posttest included nine questions related to math and science. Each question received a score of one or zero. Students were asked questions about measurement (i.e., centimeters, mass), data collection, interpretation of a graph, vocabulary (i.e., constant), and what makes a strong argument.
Conclusion
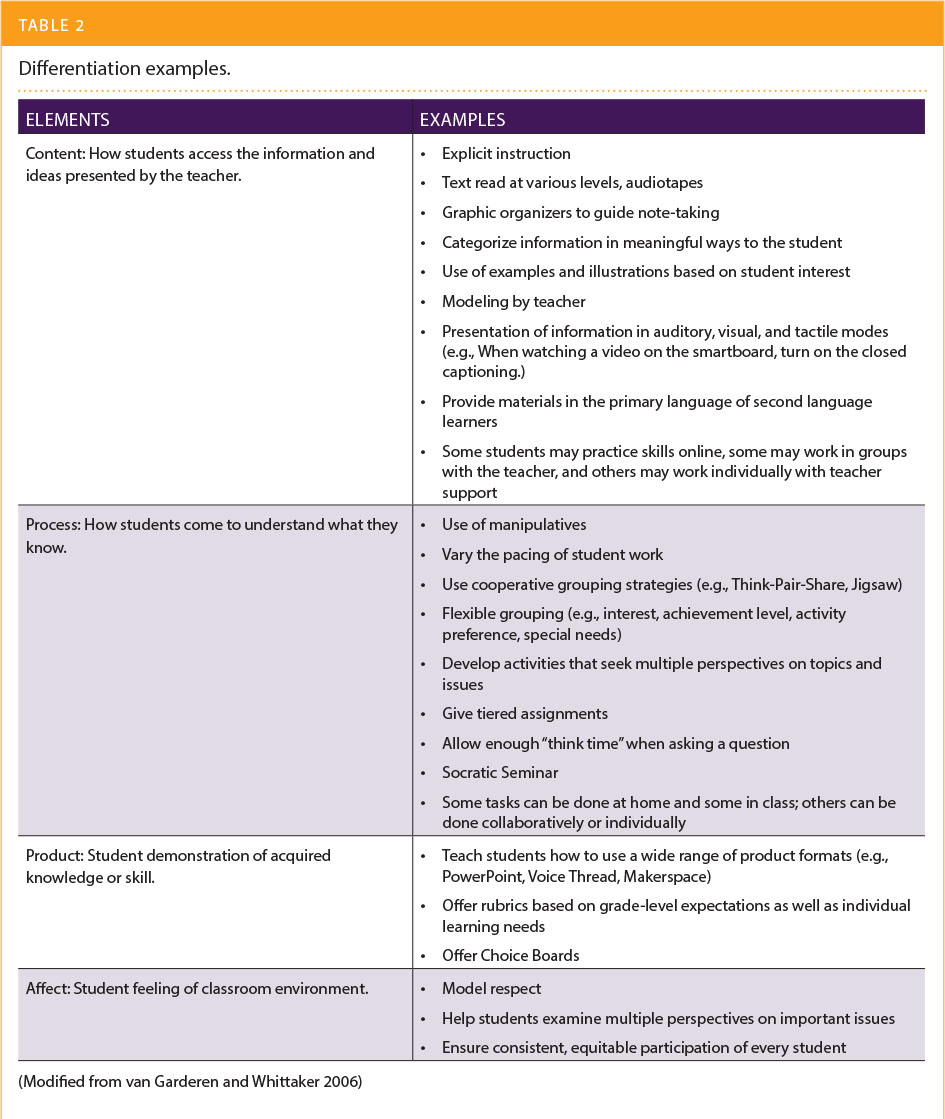
In a diverse classroom like ours, we have found that addressing multiple modalities and abilities of students through differentiation is paramount for a successful engineering design-based activity. See Table 2 for the different differentiation strategies we employed throughout the unit. Supports for inquiry-based science instruction are necessary for students with disabilities to demonstrate progress on science achievement measures (Rizzo and Taylor 2016). Unfortunately, many of these students tend to shy away from participating in inquiry-based activities for fear of failure. It is important to note that the iterative nature of engineering design provided us an opportunity to encourage students to view failure as a part of learning and to highlight the importance of using multiple perspectives to solve problems. Although it took a while for some students, the enthusiasm by which all students participated and the countless aha moments they experienced made this lesson a class favorite.
INTERNET RESOURCES
Ampe-An African game
https://youtu.be/wZPeon377mM
Gravity and Friction
http://www.mtritter.org/pwd/weight.html