
Research and Teaching
The Efficacy of Flipped Laboratory Multiperspective Videos in Skill Acquisition
This article describes a a multiperspective video approach.
In both traditional (K–12, collegiate, vocational) and nontraditional (e.g., job skills training), education, great strides have been made in understanding how to effectively teach concepts, details, and approaches (in other words, typical classroom skills) via video lessons. At their most basic, these video lessons are simply recorded lecture snippets or demonstrations of a laboratory technique; students report a higher comfort in laboratory settings after watching these videos. (Gregory & Di Trapani, 2012). Research has shown that the perspective (first person, third person over the shoulder, third person side view, etc.) of the video has a significant impact on skill acquisition and how the learner maintains their perceived orientation (Ishikura, 2012; Ishikura & Inomata, 1995; Katsioloudis & Fantz, 2013; Klatzky, 1998; Lorey et al., 2009; Lynch, Barr, & Oprescu, 2012; Madan & Singhal, 2012; Mason, Davis, Boles, & Goodwyn, 2013), though most research in the field focuses on one perspective at a time. These tasks are important in laboratory classrooms and other environments where a taught skill requires the learner to perform a physical task or tasks while monitoring the process and recording outcomes. Many tasks require the practitioner to simultaneously monitor multiple sources of information (speedometer, turn signals, rearview mirror) while manipulating various controls (steering wheel, turn signal). These tasks present further difficulty in presenting via video instruction, because they require the video to show the observation and the action; further complicating these approaches is a need to aid the learner in correctly adjusting their attention between these subtasks (Brunvand, 2010). We are aware of one other study in chemistry that considered multiple video perspectives in teaching a laboratory skill; however, that report did not contain any data regarding the efficacy of the videos in teaching the skill, nor was there a simultaneous use of multiple perspectives (Fung, 2015). Here, we present an approach that uses multiple perspectives of first person and third person) and guides viewer attention between them to teach college students how to perform a titration.
Titration—the skill
Titrations use a specialized piece of glassware, called a burette, which contains one chemical (generally at a well-known concentration). This glassware has a series of markings that allow the volume to be measured to 0.01 mL and typically can contain up to 50.00 mL of solution. This burette has a stopcock at the bottom that allows the user to dispense solution into another vessel (generally a flask); manipulating this stopcock requires concentration to monitor its on/off and flow rate conditions. The flask contains: (a) a second chemical that can react with the one in the burette; (b) enough water to dissolve the sample, if it is not already dissolved; and (c) an indicator dye that changes color once all of the second chemical has been reacted with. (Conceptually, this is similar to a pool or water-testing kit where a dye is added to the water, and then a dropper bottle is used to count drops until a color change occurs.)
Though this setup is straightforward, it requires many simultaneous and sequential actions to complete a high-quality measurement. When filling the burette, the stopcock and spout must be bled to remove any bubbles that are present (otherwise the first portion of the chemical drained from the burette will be used to fill the bubble, rather than actually reacting with the chemical in the flask), resulting in an erroneous measurement. While manipulating this glassware, the student must immediately spot a crisp color change in the flask once it occurs. However, because the solution is not instantly well mixed, the color change appears for a moment after each drop and fades with continuous mixing. As such, the student must now monitor the stopcock position, the flow rate of the drops being dispensed, how well the solutions are mixing, and how quickly the color change is appearing and disappearing in anticipation of the final crisp and permanent color change—not to mention the need to periodically check to see if the burette is at risk of running out of solution! The resulting cognitive load can decrease the learner’s success at any of these subtasks, undermining the overall goal, which requires all these simultaneous simple tasks to be correctly and consistently applied (Sweller, 1994; Sweller, Ayres, & Kalyuga, 2011).
Immediately before and after the process just mentioned, the student needs to read the volume in the burette correctly (like a measuring cup at home, reading the volume from an angle above or below the line causes an effect called parallax and leads to significant error in the measurement). In a traditional classroom, we would put a burette in front of each student and one in front of the class, and then talk them through each step of the process. We would either sketch the water level and the glassware markings on a board, use a document camera to show a burette, or show a static photo of the glassware to show the glassware from an expert’s correct perspective. For a video to teach a student how to perform a titration, it is important that we show all of these steps, minimize the cognitive load experienced, and guide the viewer through each subskill as it would realistically be performed by an expert. Existing literature supports that students will be able to learn and retain the individual steps needed between viewing the video and performing the experiment (Dubrowski & Xeroulis, 2005; Hammond, Whatley, Ayres, & Gast, 2010; Sigafoos et al., 2005).
Creation of a multiperspective video
To better demonstrate these aspects simultaneously, we developed a multiperspective video approach. Using a split-screen format, a first and third person perspective is shown side by side (Figure 1). The left side of the video was recorded by a tripod-mounted camera and was placed such that it would include the demonstrator’s body to communicate where objects are in relation to each other, and it includes the presenter’s face to ensure that viewers know where the first person view (right side) is looking. The first person view was made using a commercially available pair of sunglasses with a video camera in the bridge of the glasses (Eye Of Mine Eye-View 1080p Video Sunglasses); the sunglass lenses were removed, and “dummy” lenses were made from overhead transparency film so that the glasses appear to be laboratory safety glasses. (These lenses would have provided splash protection for a limited accident, and concentrations of the chemicals were chosen to provide a safe environment for the professional making the videos. However, they would not be safe for a student to use, and these glasses were used with caution by a safety-conscious professional). To aid in filming the first-person perspective videos, we placed a small erasable dot onto the right lens (away from the tripod camera) and iteratively adjusted this dot by looking at an object, checking the recording’s angle, and adjusting the dot until it served as a visual indicator of the camera’s line of sight. Before filming, the task (titration) was divided into discrete steps to plan what individual subtasks need to be performed, how they are done, where the student’s attention should be focused, and the purpose of each action.
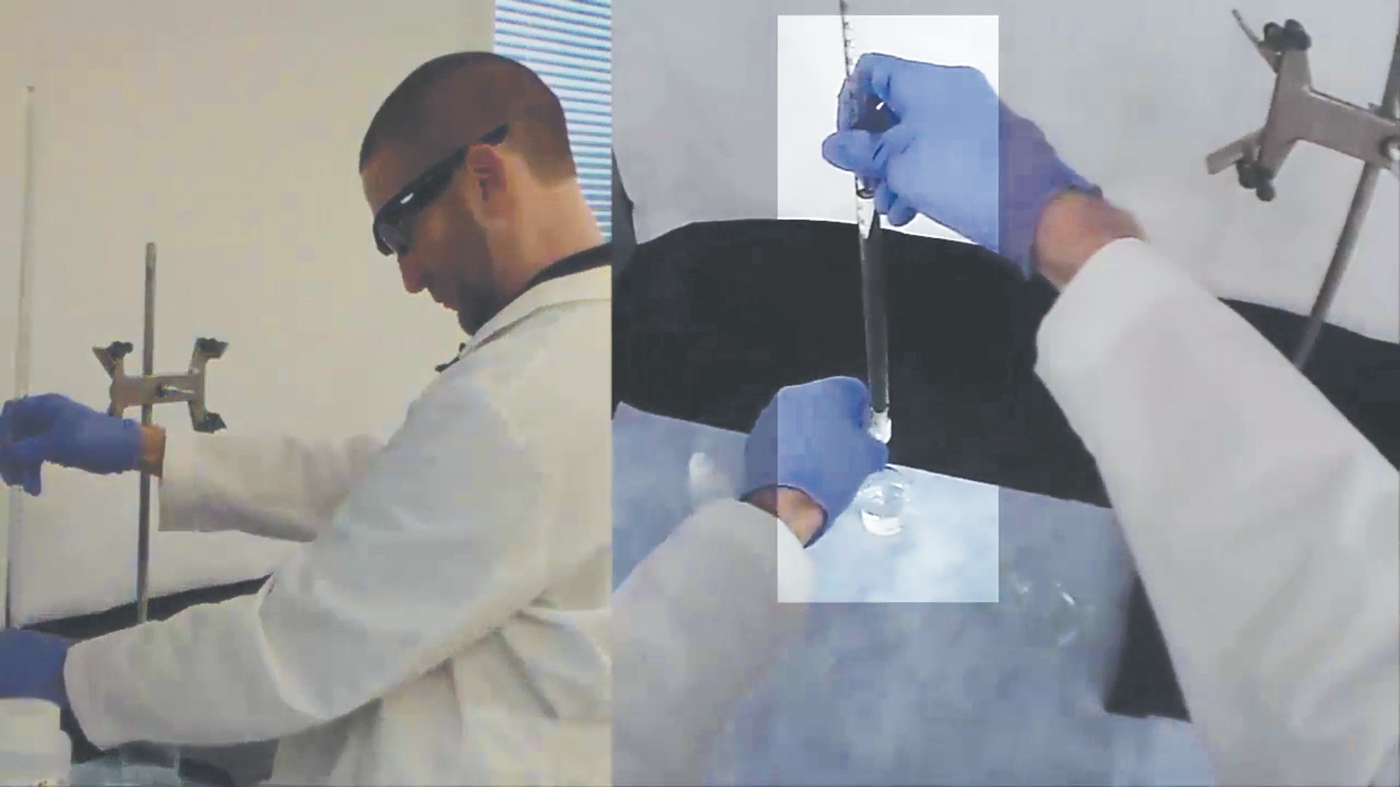
To synchronize the videos, a loud sound was made before the demonstration began; the resulting audio spike was used to synchronize both tracks in the video editing program (Camtasia). If longer distances were involved in the skill demonstration, a camera flash could also have been used as a sync signal that would prevent a temporal mismatch due to delayed sound arrival. While recording, we did not speak on camera, and instead recorded all audio as a voiceover to minimize distraction to the viewer. During the editing process, we added visual cuing to guide the viewer’s eye to the relevant activity that is being discussed on-screen; we did this by dimming the video except in the specified location (see Figure 1). This guided the viewer’s eye, while avoiding disorientation by keeping the rest of the video visible for spatial reference. At times, text layovers were also used to show numeric data or important reminders co-located with the observation at hand (Mayer, 1997, 2005; Moreno & Mayer, 1999; Mayer & Moreno, 2003).
Study oversight
The study was designed by the author, and prior to implementation the study was reviewed and approved by our institution’s Internal Review Board (methodology, a student informed consent letter, the titration video, data reporting and anonymization scheme, and data security considerations). Participating faculty voluntarily opted-in for their section. Each student specified their opt-in/out status (as well as if they were a minor—minors were excluded from data collection for this study) so that values were saved alongside the consent record. Students that opted out of research still were required to enter their titration results for in-course assessment purposes, though their information was culled from the set before each instructor anonymized and submitted the section’s data. No harm was anticipated to either the treatment or control cohort; the lecture (control) group received typical instruction, and the literature suggests that the video (treatment) cohort might in fact make fewer mistakes while taking less total time (benefit rather than harm; Burewicz & Miranowicz, 2006). Existing literature also supports the use of video instruction within chemistry laboratories more broadly, focused on the conceptual and procedural side rather than the skill-building side (D’Angelo, 2014; Jordan et al., 2016; Nadelson, Scaggs, Sheffield, & McDougal, 2015; Pan et al., 2012; Powell & Mason, 2013). After the students had submitted their measurements via our learning management system (Canvas), both cohorts had access to the video used in the instruction.
Assessment of titration quality
We chose to probe the efficacy of multiperspective videos in teaching a skill for titration, in part because the measurement being performed yields straightforward quantitative data. In our study, the students weigh out an easily measured mass of an “unknown solid” (known to the instructors to be oxalic acid). This solid is an acid; each molecule of acid requires two molecules of base in its reaction (i.e., oxalic acid is diprotic; the base used is NaOH). We had the students report the mass of solid acid measured out and the volume of the base used to complete the titration. The concentration of the base is well-known (0.1000 M NaOH, Fisher Chemical SS276-20), and the mass of the solid acid was measured to 0.0001 g. Because these values are all well-known to us, we are able to trivially compare the actual titrant amount needed to the volume used by the student. Additionally, because each student completed three titrations, we can also assess whether the student improved on subsequent titrations and the consistency of their measurements. The student-reported values were submitted via a required but nongraded quiz in our learning management system (Canvas), and at the end of the semester the anonymized data (student index number, and mass and volume data for each of the three trials) was sent to the author for compilation and analysis.
Teaching style cohorts: Assignment and reporting
To compare the difference in efficacy for the video- and classroom-based teaching approaches, we divided the sections of the course into two cohorts and taught the skill (titration) using only the prescribed teaching approach. In addition, we aimed to ensure that both cohorts were cross-sections of our student body by having each instructor teach a class in each cohort, with a mix in which cohort was taught first, and with day/time slots evenly distributed (minimizing the possibility of differentiation from other factors; e.g., seniors aggregating in desirable times due to earlier scheduling). At the end of the semester, each instructor downloaded the student-reported titration data and pasted these results into an anonymization spreadsheet that randomized student order and replaced names with unique index numbers (e.g., CRN12345stud03, for the third randomized student in section number 12345). For the author’s classes, the results were visible as part of normal grading, but no information regarding opt-in/out status was available until after the semester graded had been reported. This data was compiled by the author after all grades were reported. Fifty-five students from traditional lecture sections and 99 from flipped video sections were submitted (based on faculty and student opt-in). From these, five traditional and 14 video students’ data were rejected due to gross data input errors (values off by 1 or more order of magnitude, or obvious typos; e.g., volumes of greater than 100 mL reported as dispensed from a 50 mL burette, or students reporting the molecular mass [≈ 130 g/mol] instead of the mass used [≈ 0.150 g]) where the error was clearly unrelated to the quality of the measurement; no statistical tests were used to justify exclusion of data points. No student self-reported previous experience in performing titrations.
Results
In our analysis, we were interested to see if there were differences in how well each cohort performed as a whole, as well as whether there were differences at the student level (e.g., did one approach yield particularly good/bad student outliers?). To determine the quality of each titration, we calculated the mL of titrant used/grams of sample; a perfect titration would require 158.6 mL/g sample to reach the endpoint. If a student used less titrant than a perfect titration measurement would require, this could be an indication that they made a minor error in reading the volume used (perhaps by reading the volume on an angle), and would show as a negative % error. A positive % error likely stems from accidentally overshooting the needed volume by a few drops, or not observing the color change and closing the stopcock quickly enough.
| Comparison of Titration Results. | ||||||||||||||||||||||||||||||||||||||||||||||||||||||||||||||||||||||
|---|---|---|---|---|---|---|---|---|---|---|---|---|---|---|---|---|---|---|---|---|---|---|---|---|---|---|---|---|---|---|---|---|---|---|---|---|---|---|---|---|---|---|---|---|---|---|---|---|---|---|---|---|---|---|---|---|---|---|---|---|---|---|---|---|---|---|---|---|---|---|
|
||||||||||||||||||||||||||||||||||||||||||||||||||||||||||||||||||||||
Overall, both cohorts had indistinguishable outcomes (Table 1, Figure 2). In Table 1, we show the average % error for both cohorts as well as how it changed with practice. The results are shown both in the context of % error and the magnitude of the % error; the average retains information about whether the measurement was high/low but the errors are offsetting, whereas the magnitude % error takes the absolute value and removes the offsetting errors effect. On the first attempt, the video cohort did worse than the cohort that experienced direct instruction. This is anticipated, because there was likely a delay between the video cohort’s viewing of the video and performance of the task (potentially compounded by the fact that they did not see the burette in person during instruction). However, both cohorts quickly become comparable; note the close match in median percent error (the median would deemphasize outlier values). On the basis of these results, we find that the two instructional approaches led to equivalent skill development quality.
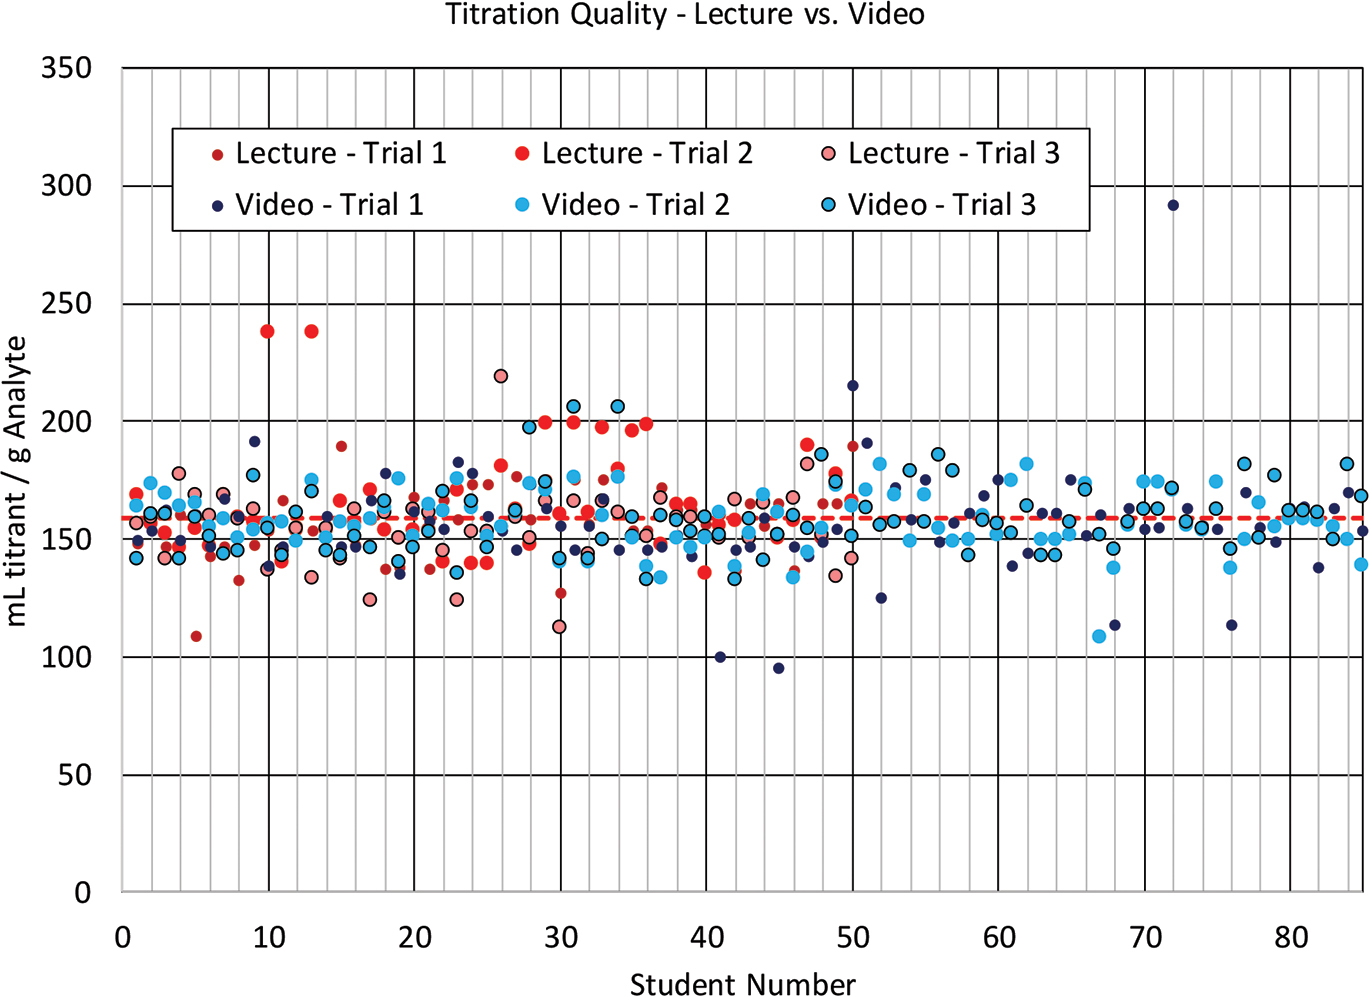
We also were interested in whether there was a difference between the two approaches in the number of low-quality measurements (potentially a sign that an approach results in less careful or skillful measurements). On the basis of the differences between the mean and median error magnitudes, there are outliers resulting from poor measurements; however, there does not appear to be a difference between how errant either group was at performing the measurements (standard deviation of student averages: 11.0 lecture cohort, 11.6 video cohort; Fcalc = 1.13, Fcrit = 1.545).
Conclusion
This study demonstrates that adult learners can develop a skill equally well when taught either via in-person demonstration and lecture or by a video that takes care to show where an expert would be paying attention and how they would be performing the task. The video achieves these ends by showing a wide view of the task being performed, a point-of-view perspective of what an expert would be looking at, and a visual callout to guide a student’s attention to the key action that should be observed.
The video approach studied here was demonstrated in a college chemistry laboratory course, but should be applicable more broadly. Florida Gulf Coast University is a suburban public university (15,000 students, 36% minority, 57% female, 65% acceptance rate) with a broad swath of incoming student achievement levels. As such, these results should be applicable to a wide range of student types, including noncollegiate learners (e.g., machinists that need to learn a skill like titrating a chemical process bath to passivate parts). At its core, this approach is intended to allow learners to self-visualize their movements and observations, and how they coincide. This could have broad applicability; some examples include (a) allowing dancers to visualize their movements in a mirror, audience perspective, and side view simultaneously; (b) demonstrating the use of a microscope by showing the view of the slide concurrent with the control manipulations; and (c) a host of other combinations of movements and observations. Within academic circles, this sort of approach might assist with distance education and can help to “flip” the laboratory classroom by allowing students to prelearn fundamentals before class (allowing more in-class time to address problem-solving, make connections to the lecture course, etc.). Additionally, the ability to repeatedly view the training video will allow learners to revisit the task for greater learning gains than observed during the single class session for each learner monitored in this study. One avenue for further research and refinement would be to prompt the learner to perform measurements during the video and check them via a feedback system in the moment (Brunvand, 2010).