
Two-Year Community
Guided Inquiry-Based Activities Positively Impact Learning in Community College Courses
Guided Inquiry-Based Activities Positively Impact Learning in Community College Courses
By Farshad Tamari and Ivan Shun Ho
This article seeks to determine whether inquiry-based learning positively impacts undergraduate student learning and performance.
Inquiry-based activities (IBA) facilitate learning (Beck, Butler, & da Silva, 2014), increase confidence, and evoke positive attitudes toward science in student learners (Jeffrey, Nomme, Deane, Pollock, & Birol, 2016; Londraville, Niewiarowski, Shauver, & Spencer, 2003) and teacher learners (Tessier, 2010) alike, and enhance graduate student teaching success (Hughes & Ellefson, 2013). Inquiry-based learning (IBL) using IBA emphasizes asking questions, performing experiments, collecting and analyzing data (using the data for higher order thinking), and communicating the results (Furtak et al., 2012). IBL has received much attention in the biological sciences, including microbiology (Furlong & McFarlane, 2014), genetics (Berkmen, Murthy, & Broulidakis, 2014), molecular biology (Benskin & Chen, 2012), evolution (Bayer & Luberda, 2016), and biochemistry (Spiegelberg, 2013), and it can be used in an interdisciplinary context. In a meta-analysis of studies that encourage active teaching and learning strategies, Beck et al. (2014) found that from 2005 to 2012, there were 142 inquiry-based lab exercises published. This translates to some 20 articles each year, albeit most focused on upper division courses.
In this article, we asked and researched whether incorporation of an IBA using a teacher-guided (Furlak, 2012) instruction model (Kirschner, Sweller, & Clark, 2006), appropriate for both introductory-level (Gormally, Brickman, Hallar, & Armstrong, 2011) and upper division science courses, would improve student performance. This model emphasizes the role of instructors as facilitators of learning through the use of pedagogical tools with the overall goal of fostering development of the ability to ask meaningful questions and construct hypotheses, perform experiments, analyze data, and interpret results. Our rationale is that a lab-specific, assignment-based and guided inquiry-based approach enhances learning (Spiegelberg, 2013) by allowing students to prepare better before and during the lab (Suchman, 2015). We were interested in whether this incorporation benefitted students of upper and lower level courses differentially using the same activity. Our justification was that the benefit from the incorporation in upper level compared with lower level courses is due to different reasons. We hypothesized that this approach will facilitate learning as measured by student performance on assessments compared with a component of the course with similar activities (Tables 1 and 2) not involving a guided IBA nor lab-specific assignments.
| Summary of the inquiry-based activities and learning objectives. | |||||||||||||||
|---|---|---|---|---|---|---|---|---|---|---|---|---|---|---|---|
|
| Sample test questions in BIO 13, BIO 14, and BIO 59 to assess performance on IBA and NIBA. | |||||||||||||||||||||||||||||
|---|---|---|---|---|---|---|---|---|---|---|---|---|---|---|---|---|---|---|---|---|---|---|---|---|---|---|---|---|---|
|
|||||||||||||||||||||||||||||
Methods
We conducted this study at the Department of Biological Sciences, Kingsborough Community College (KCC), in Brooklyn, New York. KCC, with a student population of approximately 11,000, is part of the City University of New York serving >250,000 students. Of the 677 biology majors, 176 were freshman and the rest continuing (2017). KCC has atypical scheduling compared with other CUNY campuses. It offers courses during a 12-week fall and spring semester and a 6-week winter and summer “module.” The courses in which this study was conducted are two sequential introductory multisection biology courses (BIO13 and BIO14), offered during 12-week semesters and 6-week modules, and an upper level genetics course (BIO 59), offered only during the fall. IBA and NIBA were used in each of the courses.
Assignments
We chose the Bradford assay, a spectrophotometric technique used to quantify proteins and common at this level, as an IBA (Gormally et al., 2011). Currently detection, but not quantification, of macromolecules is a formal part of our curriculum. Incorporation of this IBA added a second layer of complexity that may promote the development of analytical and critical thinking skills. Although our approach used the Bradford assay as one IBA, the use of IBA is applicable to different experimental procedures and scientific disciplines for reasons noted below and in the introduction. We created literature for students focusing on the Bradford assay. It contained information on the purpose of the experiment and the proposed learning objectives (Table 1). The background information portion explained the Central Dogma of Genetics and the Bradford assay. It also included a prelab activity (preassignment), which prompted the students to use hypothetical data to manually construct a graph as well as an activity that instructed students to determine the volume needed for the experiments in a guided manner. The protocol and an example of how hypothetical data can be applied to do calculations of unknown proteins were also included. Finally, the literature contained a postexperiment activity (postassignment), which prompted students to use their own data to graph, describe, interpret, and perform calculations (Table 2)—all elements of an IBA (Furtak, Seidel, Iverson, & Briggs, 2012). The literature was distributed to students at least 1 week in advance of the IBA to allow students to complete the preassignment, and the postassignment was completed 1 week after the experiment (total 2-week lapse). The activity was performed in groups of no more than four students. The literature is accessible at .
Data collection and analysis
We collected data based on student performance using typical grading. Students were assessed on whether they can use data to construct an appropriate graph with axes correctly labeled, describe and interpret the graph (Table 1), and use information from the graph (equation of trend line) to apply their acquired knowledge (calculate protein concentration for an unknown; Table 2). The same strategy was used for the NIBA portions of the course as a comparison. We also administered a brief anonymous survey at the end of each course to identify, based on a 5-point Likert scale, whether students felt the IBA helped them learn and remember the concepts and whether they shared the sentiment that the activities promoted the development of critical, problem-solving, and analytical skills. Between 99 and 102 students responded to the survey for each question. The self-reported survey consisted of eight questions. Six questions centered on the facilitation of learning through writing and assignments, and two questions on the development of analytical and critical thinking skills through the use of IBA.
We used student’s T-test for comparison of means across all courses, comparing IBA with NIBA. A one-way analysis of variance (ANOVA) was used for all comparisons where multiple means were being compared. For multiple comparisons of means, to determine which means were different from others, a post hoc (Tukey’s) test was performed following each one-way ANOVA. We also assessed whether there existed an interaction between study level and IBA versus NIBA using a two-way ANOVA. We used Chi-square (χ2) statistics for the analysis of all survey data. All data compilation and graph production used Microsoft Excel (2016). All statistical tests were performed using SPSS for Windows (V. 24, IBM Analytics).
Results
Comparison of overall means
We assessed performance on questions directly related to the IBA and NIBA topics. The elements of the IBA and NIBA were similar in nature revolving around learning objectives of plotting graphs, describing graphs, and calculations (Tables 1 and 2). To determine whether there is an overall statistical difference between the average students’ performances on IBA (X̄IBA) compared with NIBA (X̄NIBA), a T-test was performed using pooled data across all activities and all courses. However, as is also mentioned in the discussion, we acknowledge that our analysis does not take into account students’ background due to course effect (see following analysis of disaggregated data). The mean for activities that were inquiry based was statistically significantly higher (p < .001) than that of activities that were not inquiry based (X̄IBA = 80.2, SDIBA = 33.4, NIBA = 379 cf. X̄NIBA = 44.1, SDNIBA = 38.0, NNIBA = 389; Figure 1A). This indicates that students performed better on assessments when learning involved IBA, compared with similar activities for NIBA.
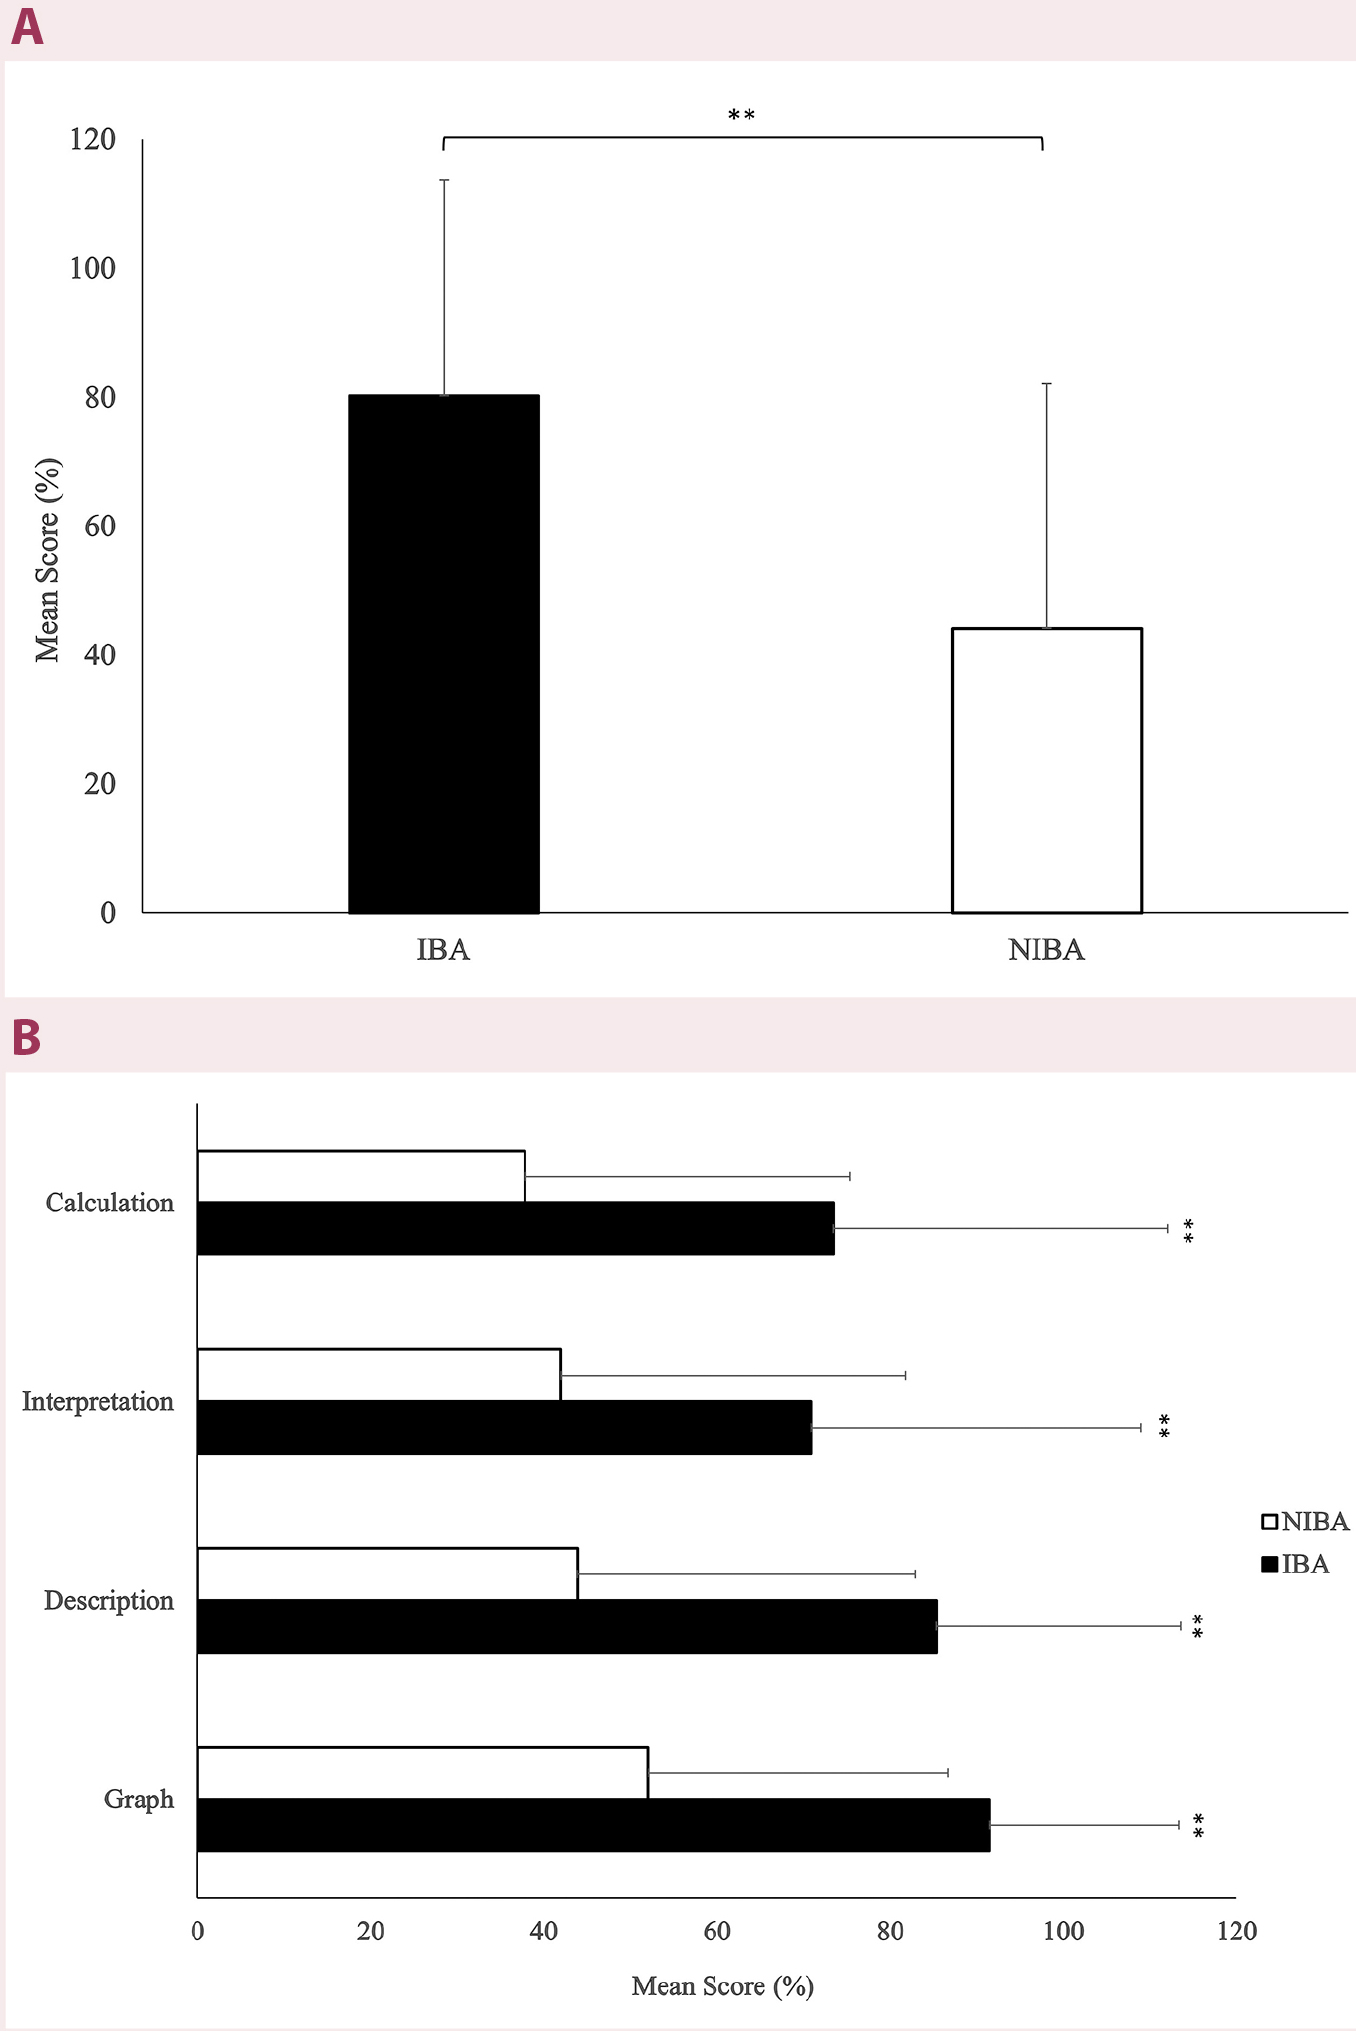
Comparison of student performance for IBA and NIBA questions. (A) Data for all learning aspects across all courses pooled together are shown. (B) Data for each learning aspect across all courses are shown.
**indicates a statistically significant difference (p < .001). IBA = inquirybased activity questions; NIBA = noninquiry-based activity questions.
Comparison of performance for each learning aspect of IBA with NIBA across all courses
To determine whether students performed better when IBA was used, a one-way ANOVA was performed comparing means for each IBA learning aspect versus NIBA. For example, graph construction when learned as an IBA across all courses was compared with graph construction when learned as a NIBA across all courses. As predicted, the students performed better for all learning aspects on IBA versus NIBA (p < .001 in all cases, Figure 1B, Tables 1 and 2). We observed the greatest differences for graphing (X̄difference >39%, X̄IBA = 91.3, SDIBA = 21.8, NIBA = 95 cf. X̄NIBA = 52.0, SDNIBA = 34.6, NNIBA = 103) and describing graphs (X̄difference > 41%, X̄IBA = 85.3, SDIBA = 28.2, NIBA = 95 cf. X̄NIBA = 43.9, SDNIBA = 38.9, NNIBA = 99). We observed the smallest mean difference for results interpretation (X̄difference > 29%, X̄IBA = 70.9, SDIBA = 38.0, NIBA = 95 cf. X̄NIBA = 41.9, SDNIBA = 39.9, NNIBA = 99).
Comparison of performance on IBA and NIBA assessments in individual courses
To determine whether IBA resulted in better student performance compared with NIBA in each course, the data was disaggregated based on course alone (Table 3). It appears that regardless of course, students performed statistically better using IBA compared with NIBA. In BIO 13 the difference (p < .001) between performance was >36% (X̄IBA = 75.4, SDIBA = 35.2, NIBA = 152 cf. X̄NIBA = 39.3, SDNIBA = 38.0, NNIBA = 153). This difference was slightly less (~31.5%), but still statistically significant (p < .001) for BIO 14 (X̄IBA = 79.8, SDIBA = 34.0, NIBA = 179 cf. X̄NIBA = 48.3, SDNIBA = 35.3, NNIBA = 181). The greatest difference (53%) between the averages was observed in the upper level BIO 59 (X̄IBA = 96.9, SDIBA = 16.0, NIBA = 48 cf. X̄NIBA = 43.9, SDNIBA = 45.1, NNIBA = 55), which was also statistically significant (p < .001). It is important to note that the study was conducted in only one section of BIO 59, explaining the great variability observed in the NIBA results (see Discussion).
| Comparison of student performance on IBA and NIBA questions in different courses. | ||||||||||||||||||||||||||||||||
|---|---|---|---|---|---|---|---|---|---|---|---|---|---|---|---|---|---|---|---|---|---|---|---|---|---|---|---|---|---|---|---|---|
|
Comparison of performance using each learning aspect of IBA with NIBA in each course
To determine whether each learning aspect (graph construction, description, interpretation, and knowledge application through calculations) of IBA and NIBA resulted in better learning, the data was further disaggregated based on the learning aspects. Figure 2a shows a comparison of students’ performance on IBA versus NIBA for each learning aspect for BIO 13. Students’ mean performance was better on all four learning aspects when they learned using IBA, although statistical significance was only observed in three of the four learning aspects. Statistical significance was observed for graphing (p < .001), describing graphs (p < .001), and interpreting results (p < .05), but surprisingly not for knowledge application (p = .946), even though the mean difference was over 17% (X̄IBA-Graph = 49.6 cf. X̄NIBA-Graph = 67.1).
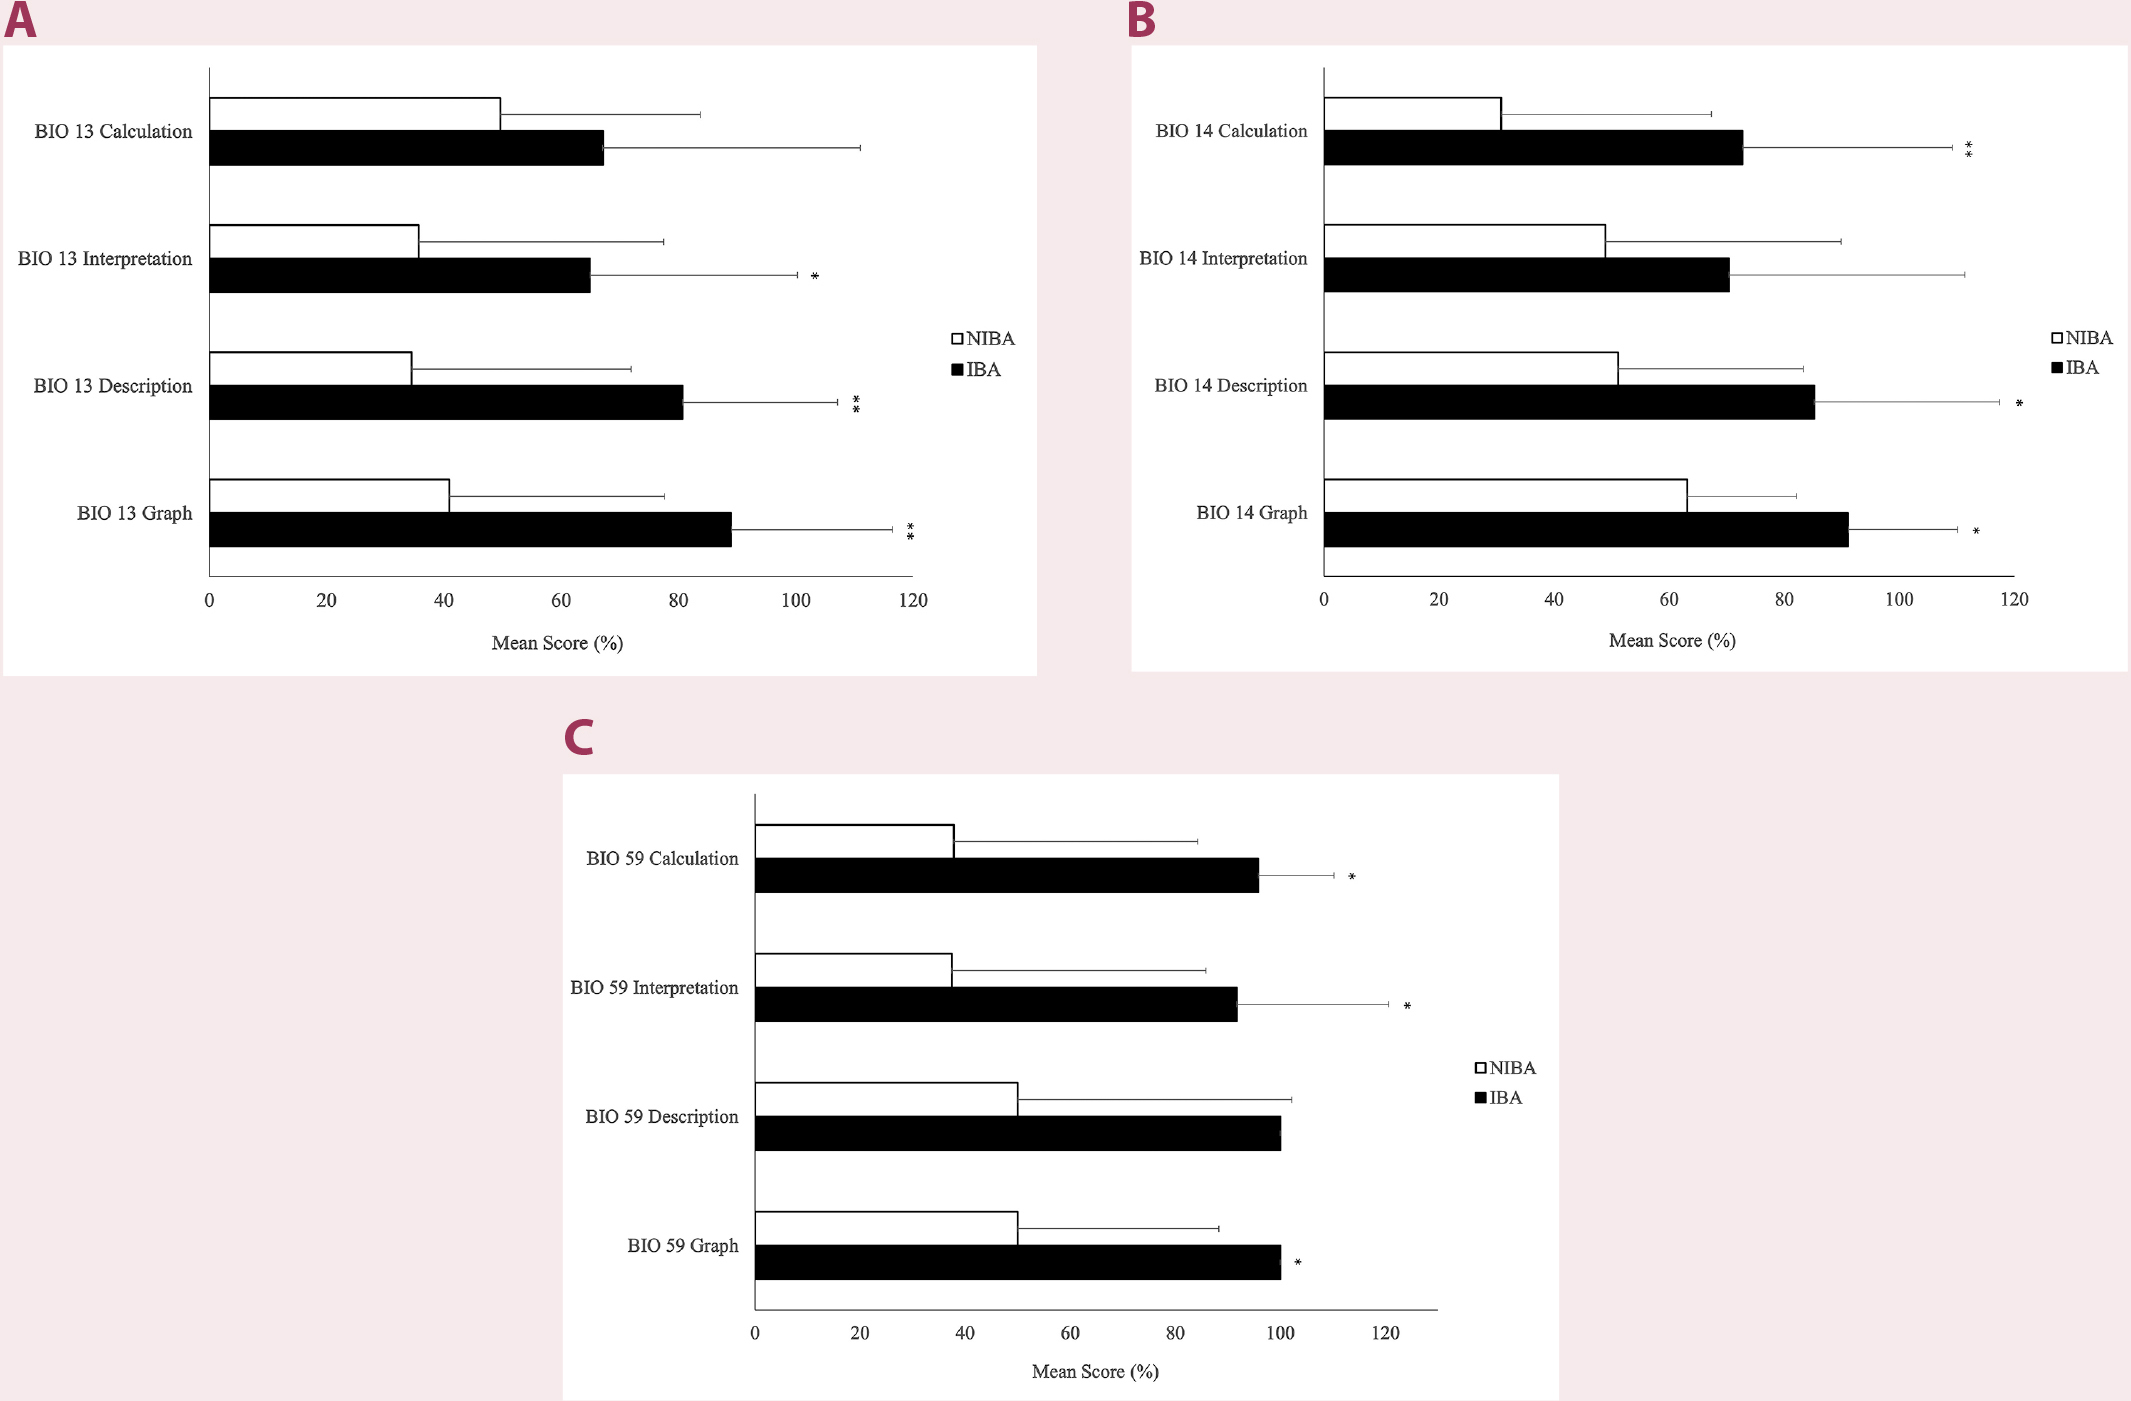
Comparisons of IBA and NIBA questions in BIO 13, BIO 14, and BIO 59. Mean scores for each learning aspect and its comparison are shown. (A) Data for different learning aspects for BIO 13 are shown. p values for each comparison are as follows: graph (p < .001), description (p < .001), interpretation (p = .035), calculation (p = .946). (B) Data of different learning aspects for BIO 14 are shown. p values for each comparison are as follows: graph (p = .028), description (p = .001), interpretation (p = .341), calculation (p < .001). (C) Data of different learning aspects for BIO 59 are shown. p values for each comparison are as follows: graph (p = .034), description (p = .075), interpretation (p = .028), calculation (p = .004). **(p < .001) and *(p < .05) indicate a statistically significant difference. IBA = inquiry-based activity questions; NIBA = noninquiry-based activity questions.
Figure 2B shows student grade comparisons on each learning aspect of IBA versus NIBA for BIO 14. Similar to BIO 13, in all learning aspects the students performed better using IBA. Statistical significance was observed for graphing (p < .05), describing graphs (p < .05), and knowledge application (p < .001), but not for interpretation of the graphs (p = .341) albeit, the mean difference was over 21% (X̄IBA-Interpretation = 48.8 cf. X̄NIBA-Interpretation = 70.3). The same assessment was performed for the upper level course BIO 59 (Figure 2c). Much like the introductory level courses, BIO 59 students learn more in all learning aspects investigated through IBA. Statistically, the differences for graphing, interpretation of graphs, and knowledge application learning aspects were significant (p < .05 for all three), and although the means for describing the graphs (X̄IBA-Graph description = 100.0 cf. X̄NIBA-Graph description = 50.0) were higher for IBA with a 50% difference, the differences were not statistically significant (p = .075).
Comparison of performance of IBA versus NIBA learning in 12- versus 6-week modules.
Student performance for IBA and NIBA was compared between 12- and 6-week modules to determine whether the scheduling of courses impacted the results (Figure 3A). As expected, students performed statistically better in IBA assessments compared with NIBA for both 12-week semesters and 6-week modules (X̄IBA 12-week = 79.2, SDIBA = 34.6, NIBA = 259 cf. X̄NIBA 12-week = 40.1, SDNIBA = 37.8, NNIBA = 268 and X̄IBA 6-week = 82.4, SDIBA = 30.6, NIBA = 120 cf. X̄NIBA 6-week = 53.2, SDNIBA = 37.0, NNIBA = 121). A post hoc test showed that there was no statistical difference between the 12-week semesters and the 6-week modules for IBA assessments (p = .847). However, student NIBA assessments (p < .001) were better in 6-week modules than those in the 12-week semesters.
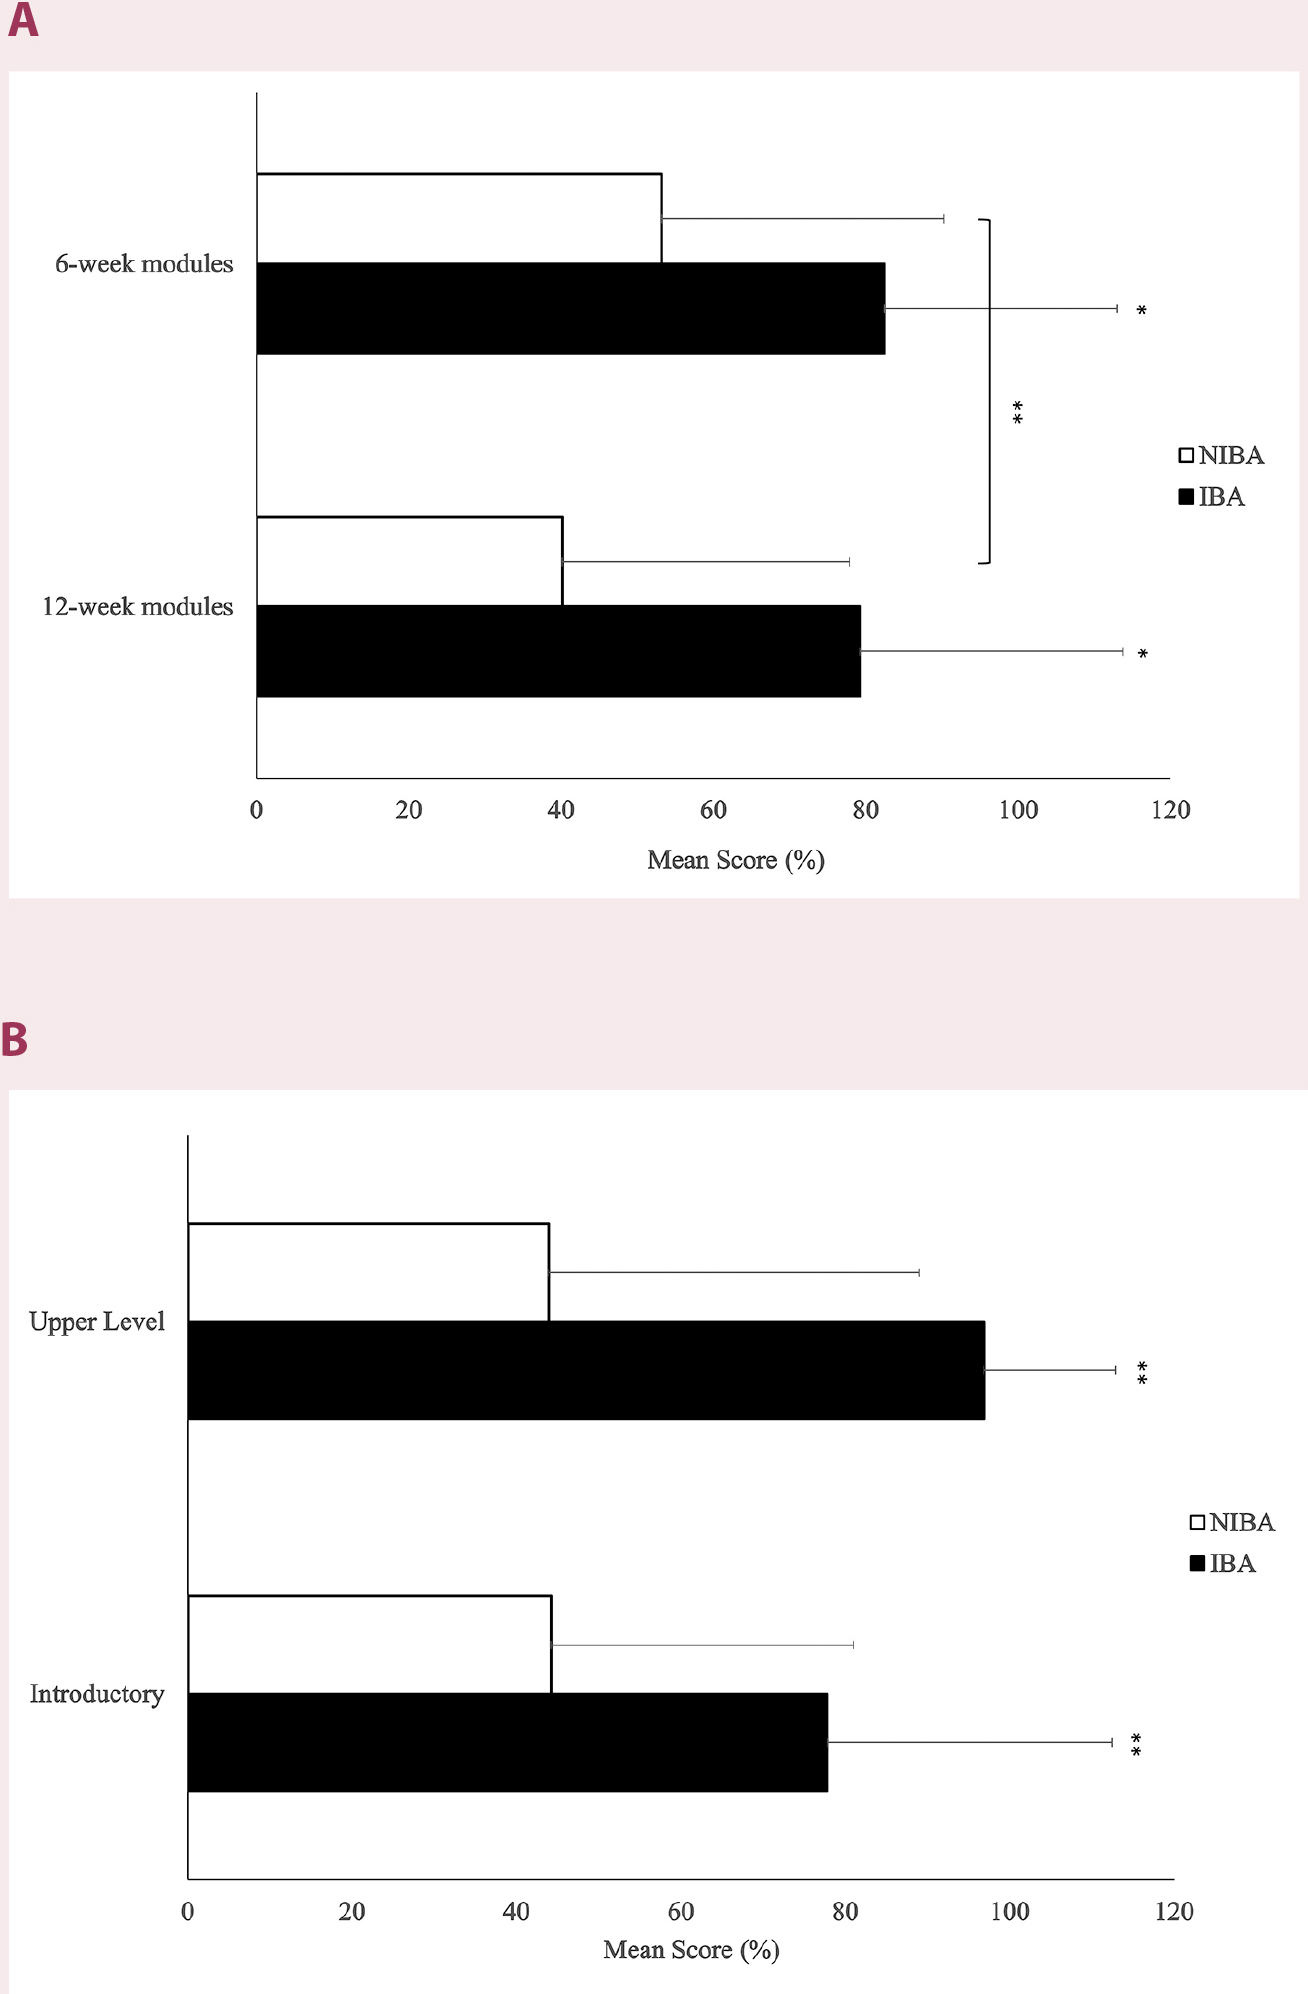
Comparison of IBA and NIBA in 6-week versus 12-week semesters, and in introductory biology courses (BIO 13 and BIO 14) versus upper level course (BIO 59). (A) Data for 6-week compared with 12-week semesters. (B) Data for introductory versus upper level courses are shown. *p < .05 and ** p < .001 indicate a statistically significant difference. IBA = inquiry-based activity questions; NIBA = noninquiry-based activity questions.
Comparison of performance of IBA versus NIBA learning in introductory versus upper level courses
To determine whether there was a difference in student performance in introductory versus an upper level course, we performed a one-way ANOVA on pooled BIO 13 and BIO 14 data and compared it with BIO 59. As expected, students consistently performed better on IBA assessments compared with NIBA assessments regardless of course level (Figure 3B). Also, as expected, there is no statistically significant difference between the NIBA assessment for the pooled BIO 13 and 14 data compared with BIO 59. Surprisingly, however, there is a statistically significant difference (p < .05) between IBA activities for the pooled BIO 13 and 14 data compared to BIO 59 (X̄IBA BIO13+14 = 77.8, SDIBA = 34.6, NIBA = 331 cf. X̄IBA BIO59 = 96.9, SDIBA = 16.0, NIBA = 48) (see Discussion). A two-way ANOVA on the combined data for IBA and NIBA student performance for introductory versus upper level courses shows that there is an interaction effect (p < .05, Table 4).
| Comparison of student performance on IBA and NIBA questions in introductory level and upper division biology courses. | ||||||||||||||||||||||||||||||||||||||||
|---|---|---|---|---|---|---|---|---|---|---|---|---|---|---|---|---|---|---|---|---|---|---|---|---|---|---|---|---|---|---|---|---|---|---|---|---|---|---|---|---|
|
Student self-reported assessment
A self-reported assessment was conducted to determine whether students felt the components of the IBA (prelab and postlab assignments, the critical thinking, problem-solving and analytical skills) helped them remember and grasp the contents more readily. Not surprisingly, student self-reports show that they strongly agree/agree with statements that the IBA components allowed them to grasp and remember the content better. The same was true for how they felt about the development of critical, problem-solving and analytical skills (Figure 4). A nonparametric (Kruskal-Wallis) test comparing the overall student self-reports shows that there is statistical difference (p < .001). Individual χ2 statistics, which compared students’ self-reported sentiment for each question, showed a statistical difference for all eight questions administered. Chi-square values ranged from χ2α = 0.05, = 4 = 46.7 to 80.6, which were all greatly higher than the critical value of χ2expected = 7.81. We pooled the strongly agree with agree, and strongly disagree with disagree responses for each question and expressed them for each question as a percentage of the total responses. Strongly agree/agree responses ranged from 70.3%–88.0% of all responses, while strongly disagree/disagree responses only ranged from 1.0%–7.0% (data not shown). In all cases, the students overwhelmingly self-reported, either strongly agreeing or agreeing, that the components of the IBA helped them grasp and remember the content or helped them develop a higher level learning skill.
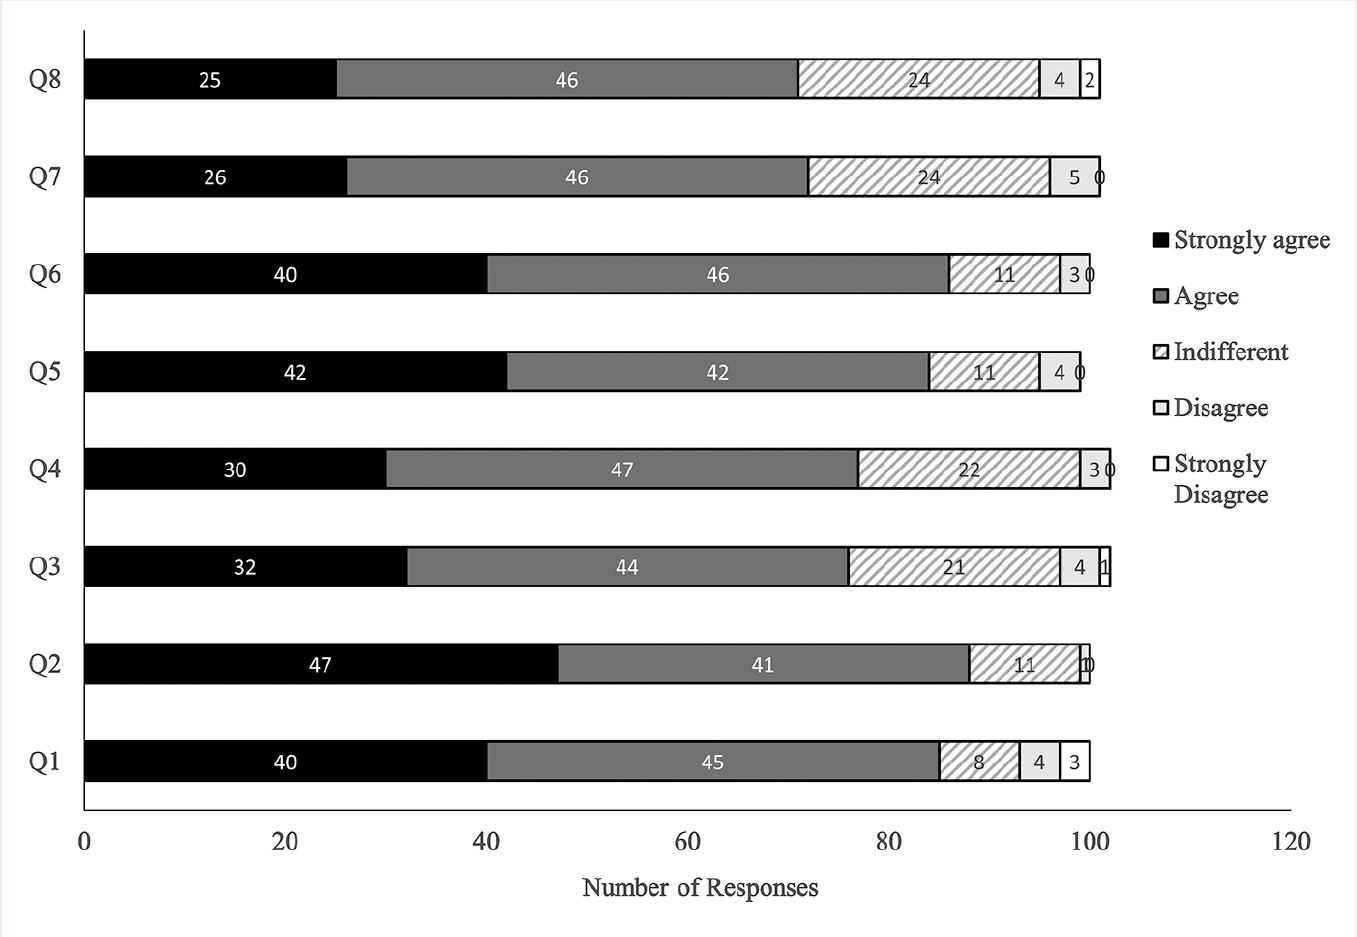
Students’ sentiments about whether inquiry-based activities did or did not help them learn the material (concept) and remember the material (memory) that had an inquiry-based component. Data compiled for BIO 13, BIO 14, and BIO 59. Number of responses for each question in the anonymous survey are shown. Q1 = IB activities helped me grasp concepts better; Q2 = IB activities helped me remember concepts better; Q3 = Write-up helped me grasp concepts better; Q4 = Write-up helped me remember concepts better; Q5 = Pre- and postassignments helped me grasp concepts better; Q6 = Pre- and postassignments helped me remember concepts better; Q7 = Write-up helped me learn to analyze data using computer; Q8 = Write-up helped me develop critical/problem-solving/analytical skills. IB = inquiry-based.
Discussion
A number of investigations show that nontraditional methodologies, such as kinesthetic learning in lectures and IBA in labs, benefit students. For example, in a lecture setting, the use of kinesthetic approaches through incorporation of props increased student learning and performance (Polizzotto & Tamari, 2015; Tamari, Bonney, & Polizzotto, 2015). In a lab setting, the report Vision and Change: A Call to Action (American Association for the Advancement of Science, 2011) encourages the use of inquiry-driven activities. Furthermore, it has been argued that the use of IBA should be the common way labs are conducted (Thalluci & Galembeck, 2016). With this goal in mind, our investigation focused on the use of one teacher-guided IBA.
Our data show increased student performance on all aspects of student learning or “cognitive learning domains” (Bayer & Luberda, 2016) including recalling concepts, describing results, applying acquired knowledge, and— to an extent—applying gains in analytical competencies, the latter two being important as they suggest higher order learning and the development of critical thinking skills. Interestingly, student learning was higher without exception when IBA was used, regardless of type of activity, course, module, and course level (Table 4). Furthermore, our results indicate a difference between the comparison group and treatments in the upper level course compared with lower level courses (Figure 3B). This is likely due to facilitation of learning because of different reasons. We argue that lower level students benefit from IBA because of knowledge priming, whereas upper level students benefit via reinforcement. This is evident in significantly higher performance and lower SD in IBA for upper level courses compared with that for lower level courses. However, we acknowledge that the difference might be, at least in part, due to students’ background variation, supported by a lack of difference found in description of a graph for BIO 59 (Figure 2C) as well as for some nonscience students taking majors introductory biology courses. This is consistent with previous findings (Beck et al., 2014), which mainly focused on upper level courses. Because the gains are small in lower level courses, we offer an alternative interpretation: It is more critical to offer and investigate teacher-guided-IBA in introductory-level courses. This approach will result in earlier development and further reinforcement of scientific thinking in students, which will benefit them in upper level courses and beyond.
Although we have achieved statistical significance in our analyses, we have noticed a great deal of variability in the data (as shown by SD on the graphs). We predict that variability in introductory-level courses and the upper level course have different causes. In introductory courses at KCC, there is a dichotomy in student performance in general, which explains the variability in the data for BIO 13 and 14. For the upper level course BIO 59, the variability is due to a significantly smaller sample size because of limitations in course offerings. Although our data suggest that all of the outcomes we set forth are being met through the use of IBA (see the supplementary document, page 2, at ), a larger number of samples from multiple upper level courses need to be tested to confirm these results. Of particular interest for future scholarship of teaching and learning projects is when to incorporate IBA into the curriculum.
Our students overwhelmingly reported that they grasped and remembered the concepts better and that the inquiry-based assignments and lab activities helped them develop competencies, such as critical thinking, problem-solving, and analytical skills. Similar to other published work, we argue that students who show a positive attitude (confidence) will evaluate science more meaningfully (Jeffrey et al., 2016).