
research & teaching
An Exam Wrapper Intervention in Organic Chemistry I
Impact on Course Performance and Study Behavior
Journal of College Science Teaching—November/December 2019 (Volume 49, Issue 2)
By Edith Rosales, Alla Chavarga, Evan Grandoit, Shoshana Mayer, Natasha Hackman, Milushka Elbulok-Charcape, Alison C. Domzalski and Gail Horowitz
This article describes a quasi-experimental study conducted in two Organic Chemistry I classrooms at a diverse, urban, public university. The treatment group received an exam wrapper intervention, a series of four written exercises administered throughout the semester designed to enhance students’ academic self-regulation by promoting self-reflection and study strategy planning. Treatment students were found to significantly outperform control students in the course overall, as well as on a common final exam question. Additionally, data indicated that the exam wrappers may have triggered weaker students to consider their performance and withdraw at significantly higher rates than control students. Exam wrappers show excellent promise as an interventional method for other gateway science, technology, engineering, and mathematics (STEM) courses in addition to Organic Chemistry. They can be easily administered using course management software, they involve no cost, and they require negligible curricular modification and minimal instructor effort.
Despite efforts toward improving the retention of underrepresented minorities in STEM (science, technology, engineering, and mathematics), the rates at which underrepresented minorities (UREMs) persist in the STEM pipeline do not match those of White students (Chen & Weko, 2009). Often it is introductory, so called “gatekeeping” courses taught in large lecture, instructor-centered, and weed-out modes that are blamed for this phenomenon (Hunter, 2016). However, research has shown that STEM students who are effective self-regulated learners (Zimmerman, 1990) are more successful than ineffective ones (Karabenick, 2003; Nandagopal & Ericsson, 2012; Szu et al., 2011; VanderStoep, Pintrich, & Fagerlin, 1996; Zimmerman & Martinez-Pons, 1990) and that self-regulation is a learnable, trainable skill (Hudesman et al., 2014). Self-regulated learners are self-aware and reflective learners: They actively choose the study behaviors and strategies they deem appropriate, monitor their own learning, and modify their behaviors in response to positive or negative feedback (Zimmerman, 1990).
Exam wrappers are an interventional tool designed to encourage students to reflect on their study habits and performance, with the overall goal of helping students improve their self-regulated learning abilities (Lovett, 2013). Exam wrappers are typically written exercises that students complete after receiving formative feedback. They have most frequently been utilized in STEM classrooms (Lovett, 2013; Nilson, 2013). Exam wrapper interventions have resulted in statistically significant performance improvements in a wide variety of courses. A postexam reflection intervention conducted in an undergraduate statistics class (N = 361) resulted in significant improvement in final course grades (Chen, Chavez, Ong, & Gunderson, 2017). Similarly, in an engineering course, student-identified mistakes reported in a reflective exam wrapper predicted improvement scores from one exam to the next (N = 70; Chew, Chen, Rieken, Turpin, & Sheppard, 2016). Similar improvements in final exam and course grades have been documented after incentivizing student-corrected missed exam questions in undergraduate physiology (N = 999), physics (N = 64), and mathematics (n = 125) courses (Brown, Mason, & Singh, 2016; Hudesman et al., 2014; Rozell, Johnson, Sexten, & Rhodes, 2017). Furthermore, the quality of student postexam reflective work—the extent to which students understand why their initial answer was incorrect—has been related to subsequent exam performance (Andaya, Hrabak, Reyes, Diaz, & McDonald, 2017).
In the study described here, we examined the following research question: How does an exam wrapper intervention impact the academic performance and study behaviors of a diverse group of Organic Chemistry I students enrolled in a midsized, public institution? Exam wrappers were chosen as the method of intervention in part because of their proven efficacy, but also because of their ease of implementation, their minimal interference on the established curriculum, and their lack of demand on the course instructor.
Method
Participants and course context
This IRB-approved study was conducted at an urban, public university located in the Northeastern United States. The undergraduate population at this institution is diverse; approximately 40% of students are UREM, 50% are low income, 30% are first-generation college students (neither parent has any college education), and 40% speak English as a second or third language (CUNY Office of Institutional Research, 2014).
This quasi-experimental study involved two Organic Chemistry I courses, one taught in summer 2016 (n = 83) and one taught in summer 2017 (n = 71). The summer 2016 class served as the control group and the summer 2017 class as the treatment group. Because group assignments were not random (students self-enrolled), steps were taken (see pretest measures next) to ensure that the control and treatment populations were equivalent on entry into the course.
Both courses were taught by the same instructor (Domzalski) and followed similar schedules. Both met four times a week for 140 minutes per day, for a total of five and a half weeks. The teaching method utilized was primarily lecture, with approximately 15% of class time spent on problem solving. Students in both courses were assessed via five quizzes, two midterms, and one final exam. (See Table 1 for the scoring breakdowns in each course.) Students in the treatment group received an intervention of four short, in-class assignments (exam wrappers), which were completed immediately following the first, second, fourth, and fifth quizzes, respectively (see Figure 1). Students in the control group completed only the five quizzes.
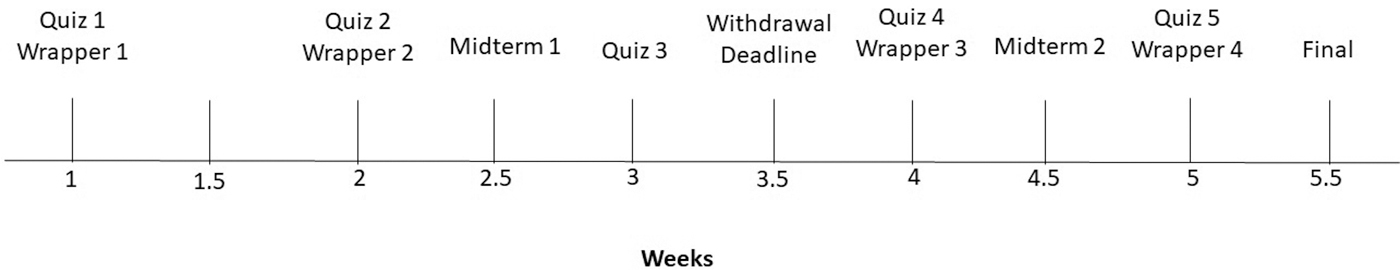
Timing of quizzes, exams, and exam wrappers for treatment group.
| Table 1. Percentage of course grade allotted to each method of assessment. | ||||||||||||||||||
|---|---|---|---|---|---|---|---|---|---|---|---|---|---|---|---|---|---|---|
|
Intervention
Exam wrappers
Exam wrappers 1 and 2 (see Appendix A available at ) were identical and were administered at the end of Weeks 1 and 2, respectively. The wrappers asked students how they felt about their competence in two areas: conceptual understanding and problem-solving ability. Students selected from among three choices (strong, ok, and weak) in two Likert-style questions. Students were also asked to select the extent to which they felt they could easily access help with the course when they needed it. Students selected from among three choices (agree, unsure, and disagree) in a Likert-style question. The questions in exam wrappers 1 and 2 were written with the intention of triggering reflection on the part of students, so that hopefully students who were struggling would be forced to confront their circumstances while it was still early in the semester.
Exam wrappers 3 and 4 (see Appendix B, available at ) were identical to one another and were administered at the end of Weeks 4 and 5, respectively. The wrappers asked students to report the extent to which they felt satisfied with their performance on their most recent assessment (quiz or midterm). Students selected from among five choices (strongly agree, agree, neither agree nor disagree, disagree, or strongly disagree) in a Likert-style question. Students were also asked to report how many hours per week they studied and how many hours they spent problem solving. Last, students were asked what they would do differently in the future to improve their performance.
The first few questions of exam wrappers 3 and 4 were intended to stimulate students to step back and think about how they were doing in the course and to consider whether they were putting in sufficient study time. The final question was intended to stimulate students to consider their study behaviors, to think what they might do differently, and to hopefully commit in writing to changing their behaviors.
Syllabus supplement
One significant modification was made to the course syllabus of the treatment group. An extra handout entitled “How to Study for this Course” was incorporated into the syllabus. It contained a graphic display of a recommended iterative process for students to follow and two subsections of guidance entitled, “Ways to Assess Yourself” and “Help Seeking Guide.” (See Appendix C, available at ). On the first day of lecture, the instructor reviewed and explained this handout.
Pretest measures
Previously, Horowitz and her colleagues (2013) demonstrated that for students at her college, the letter grades they obtained in General Chemistry II were a reliable predictor of their future performance in Organic Chemistry I. Specifically, if General Chemistry II was taken at her college, 49% of the variability in performance in Organic Chemistry I was explained by grades received in General Chemistry II. Therefore for the purposes of the current study, we obtained transcripts from all students and collected General Chemistry II letter grades for students who completed General Chemistry II at our college. (Letter grades for students who had taken General Chemistry II outside of our college were not collected.) Letter grades for General Chemistry II were combined with the exam wrapper data (described previously) and the course performance data described next and then stripped of all identifying information.
Outcome measures
Course performance
Student scores (treatment and control) on all assessments (quizzes, midterm examinations, and the final) were collected, stripped of identifying information, and utilized as data.
Common final exam question
For the purposes of comparison, one of the final exam questions given to the control students in summer 2016 was reused and administered to the treatment students on their final exam in summer 2017. Student scores (stripped of identifying information) for that particular question were collected for all students (control and treatment) who took the final exam.
End-of-semester survey
Students in both the treatment and control groups filled out a survey during Week 5 of the semester. The survey asked them to rank on a four-point Likert scale (frequently, occasionally, rarely, never) the frequency with which they utilized each of nine named study behaviors. These study behaviors were: memorizing reagents or reactions, creating flash cards, reviewing class notes, doing hw or practice problems, reading the textbook, watching online videos, underlining or highlighting, using mnemonics, using molecular models (see Note 1 at end of article).
Students were asked to provide certain information about themselves. They were asked to indicate the approximate letter grade they received in General Chemistry II (A, B, C, D, or F) and whether they had taken General Chemistry II at our institution. They were also asked to provide demographic information: their gender, whether they were a member of a group underrepresented in science, how much education each of their parents has, and whether they are a first-, second-, or third-generation American.
Analysis and results
Pretest measures
General Chemistry II grades
To evaluate if the two populations, treatment and control, were equivalent at their entry points into the Organic course, we ran two tests. First, we compared the performance of the treatment and control students in the prerequisite course, General Chemistry II. (We did this only for students who took General Chemistry II at our own institution; see Note 2 at end of article). Because Shapiro-Wilk tests for normality were significant for both the treatment and control groups, we used a Mann-Whitney U test to compare the two groups. We obtained a borderline p-value (U = 91, p = .05, with a low effect size: r = 0.207), indicating a possible significant difference between the treatment and control General Chemistry II scores (for the students who took General Chemistry II at our institution).
Organic Chemistry Quiz 1 grades
Because of the borderline result we obtained from our General Chemistry II comparison, we then compared that performance of all control and treatment students on the first Organic Chemistry I quiz (Table 2). Because Shapiro-Wilk tests for non-normality were significant, a Mann-Whitney U test was conducted. Notably, no significant difference between the control and treatment groups was found (U = 2104.5, p = .515).
| Table 2. Comparison of treatment and control groups at entry into Organic Chemistry I. | ||||||||||||||||||
|---|---|---|---|---|---|---|---|---|---|---|---|---|---|---|---|---|---|---|
|
Outcome measure: Course performance
Final exam scores
To examine the impact that the intervention may have had on the treatment group, we compared the final exam performance (on a cumulative final) of the control and treatment groups. Because Shapiro-Wilk tests for normality were significant, a Mann-Whitney U test was used to compare the treatment and control groups. It was found significant (U = 125, p2-tailed < .001) with a medium effect size (r = 0.321). The median final exam score for the treatment group was 63.75, whereas the median final exam score for the control group was 41.0. See Table 3.
| Table 3. Comparing final exam performance of treatment and control groups. | ||||||||||||||||||
|---|---|---|---|---|---|---|---|---|---|---|---|---|---|---|---|---|---|---|
|
Common final exam question
We compared the treatment (n = 53) and control (n = 68) groups’ performances on the identical final exam question. Again, because the Shapiro-Wilk test for normality was significant (p < .001), a Mann-Whitney U test was conducted and was found to be significant (U = 121, p2-tailed < .001) with a medium effect size (r = 0.338). The median score on the exam question for the treatment group was 4.0, whereas the median score for the control group was 1.75. (The question was worth 5 points.)
Course grades
Because the course grades of the control and treatment students were determined using different weights (see Table 1), the weighting method utilized for the control students was applied to the raw scores (quizzes, midterms, finals) of the treatment students, and recalculated final grades were determined for the treatment students (see Figure 2). Shapiro-Wilk tests were run on the final grades of the control and treatment students and determined that final grades of control and treatment students were normally distributed. An independent samples t-test was found to be significant: t(134) =—2.34, p < .05, with the treatment mean = 59.16 and the control mean = 50.84.
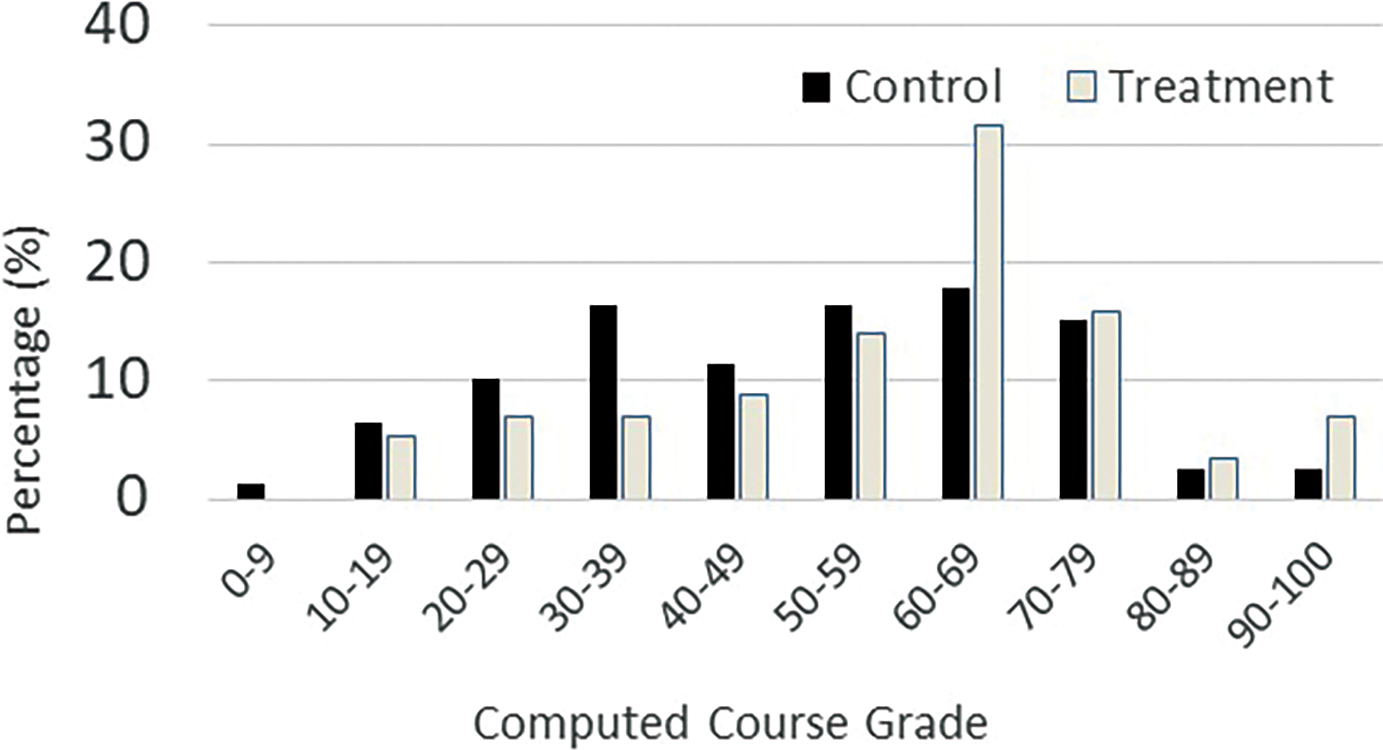
Distribution of course grades for treatment and control students where attendance = 5%, midterms = 35%, final = 35%, quizzes = 25%.
F to W Ratio
We examined whether there was a difference in how many students withdrew from the course versus failed for the treatment and control groups. We observed a large difference between the control and treatment groups (see Figure 3; Table 4). We found that the ratio of failing to withdrawal students in the control group was 4:1, whereas the ratio for treatment students was 1:1. A chi-squared test for independence showed that this difference was significant, χ2(1) = 49, p < .05.
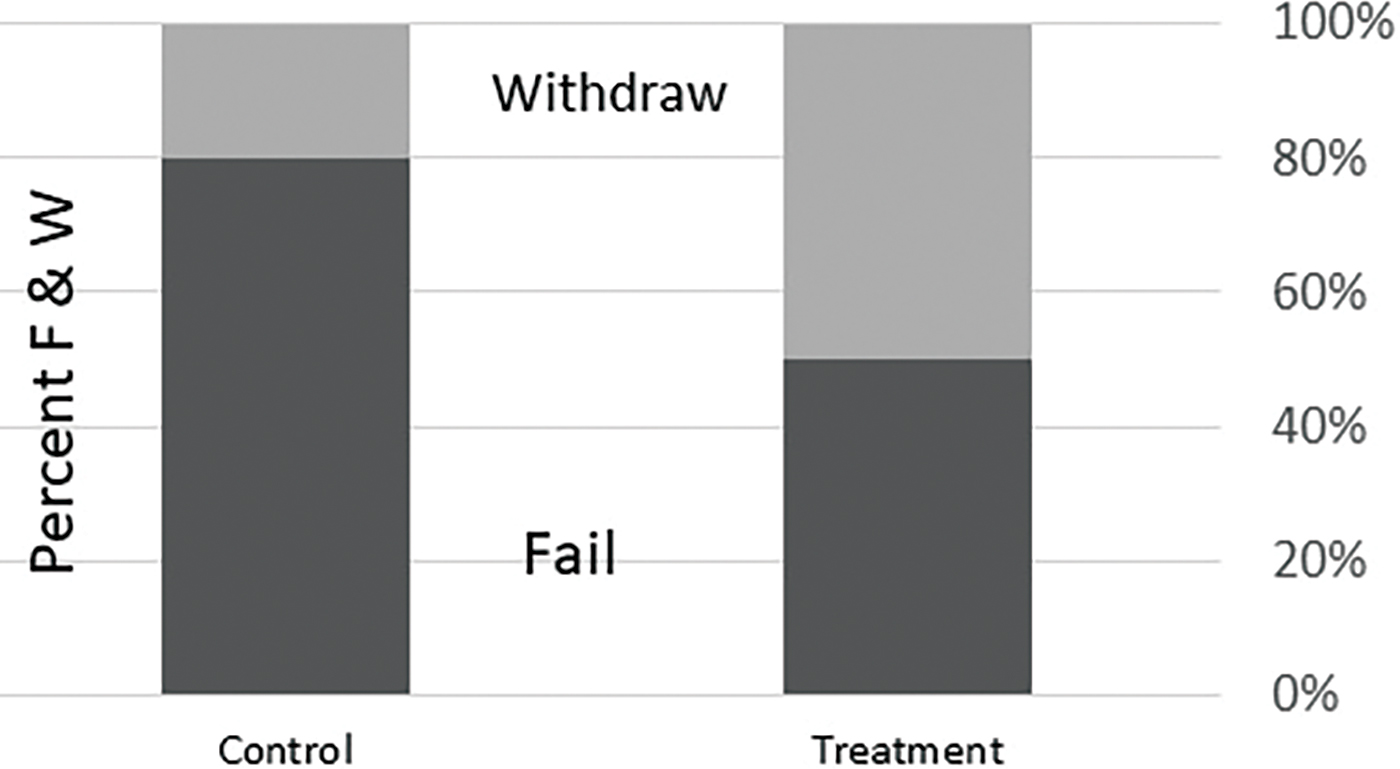
Differing distributions of W & F grades across treatment and control groups.
| Table 4. Numbers of W and F students in control and treatment groups. | |||||||||||||||
|---|---|---|---|---|---|---|---|---|---|---|---|---|---|---|---|
|
Trajectories of F and W students
We examined the pathways that the withdrawal and failure students took in the first few weeks of the semester, specifically looking to see whether these students had taken the first two quizzes of the semester, and for the treatment students, to additionally see whether they had filled out the first two exam wrappers (which were administered immediately following quizzes 1 and 2, respectively). Figure 4 shows the predominant pathways that the W and F students took in the early parts of the two Organic courses.
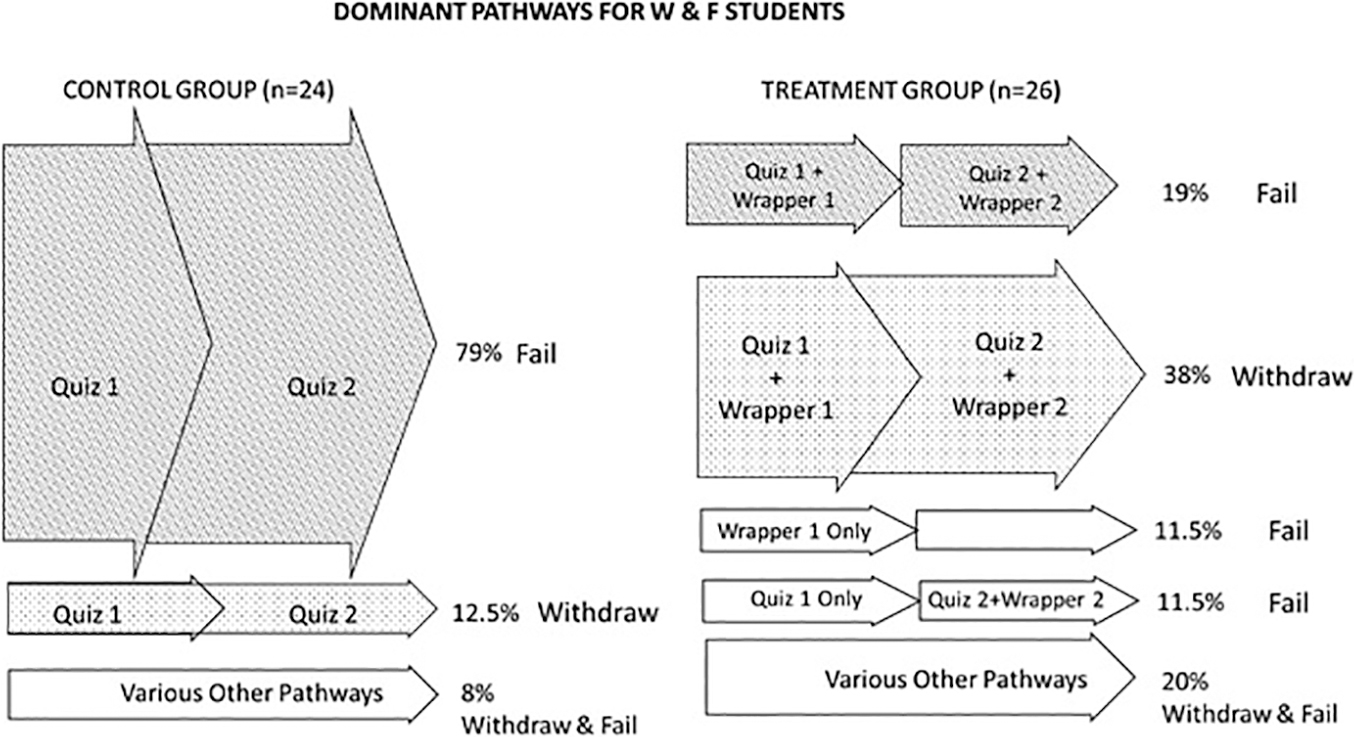
Pathways of the W and F students in the control and treatment groups.
In the control group, 79% of the (F+W) students who completed the first two quizzes went on to fail the course, while in the treatment group, only 19% of the (F+W) students who completed the first two quizzes along with the first two exam wrappers went on to fail the course. Instead, a large group of (F+W) treatment students (38%) who completed quizzes 1 and 2, along with their respective exam wrappers, chose to withdraw from the course.
Given these findings, we compared the Quiz 1 and 2 averages of the class as a whole to the Quiz 1 and 2 averages of the W and F students. Not surprisingly, we found that for both quizzes, and for both treatment and control groups, the W and F students averaged lower on their quizzes than did the class as a whole (see Table 5). However, among the control students, the F students on average, notably outperformed the W students, whereas among the treatment students, the W students noticeably outperformed the F students.
| Table 5. Averages for Quizzes 1 and 2. | |||||||||||||||||||||||||||||||||||
|---|---|---|---|---|---|---|---|---|---|---|---|---|---|---|---|---|---|---|---|---|---|---|---|---|---|---|---|---|---|---|---|---|---|---|---|
|
|||||||||||||||||||||||||||||||||||
Because it appeared that the combined experience of taking the quizzes along with the exam wrappers resulted in more withdrawals, we examined student exam attendance behavior at the end of the summer semesters. We observed that in the control group, 60% of students who went on to earn Fs in the course were absent from their final exam, whereas in the treatment group only 31% of students who earned an F were absent (see Figure 5).
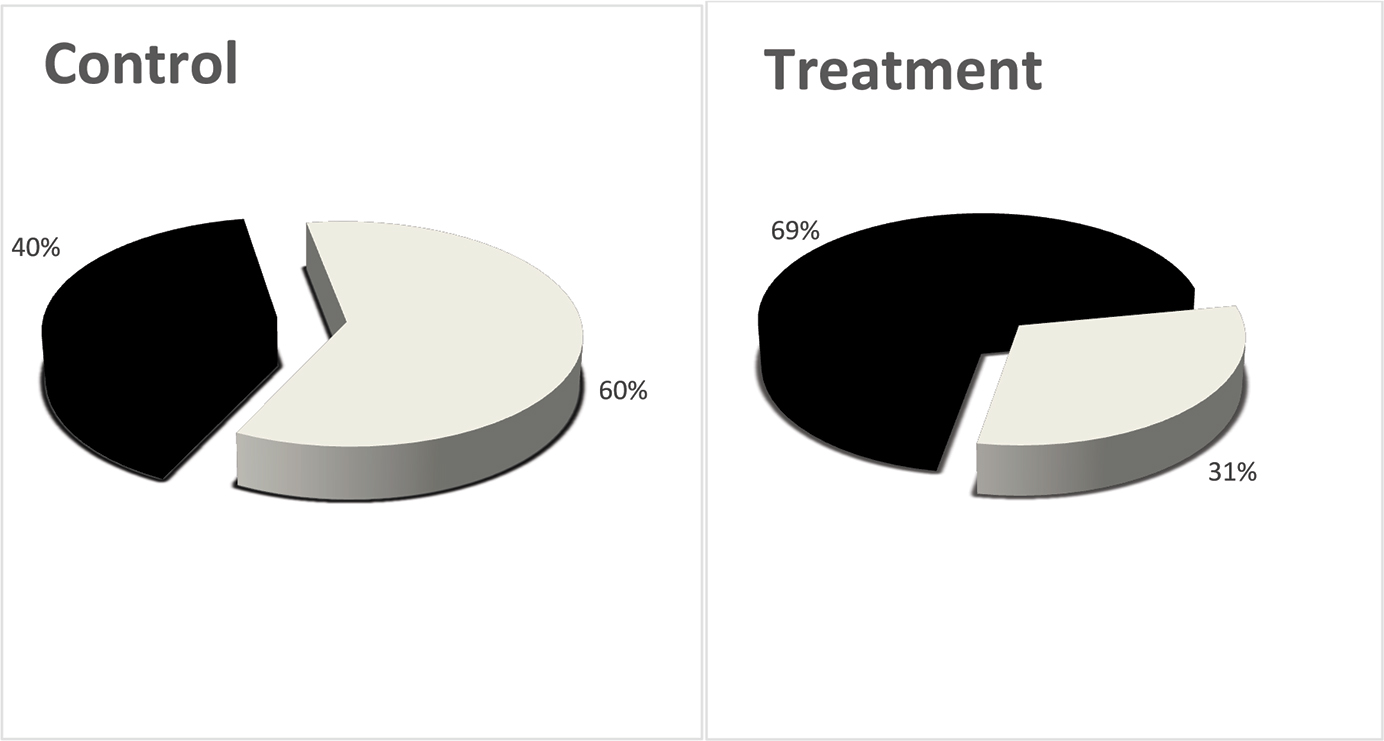
Percentage of F students who took the final exam.
Outcome measure: End-of-semester survey
We compared the end-of-semester responses of treatment and control group. Fifty-seven percent (n = 47) of the control group and 51% (n = 36) of the treatment group filled out the survey. (Demographic data of the respondents is shown in Table 6.)
| Table 6. Demographic makeup of the control and treatment survey respondents. | |||||||||||||||
|---|---|---|---|---|---|---|---|---|---|---|---|---|---|---|---|
|
Do survey respondents represent their overall populations?
To determine if the students who responded to the survey were representative of the overall control and treatment populations, we compared the General Chemistry II scores reported on the survey with the actual General Chemistry II grades found on student transcripts (in both cases only using scores from students who took General Chemistry II at our institution). We found that the 95% confidence interval of reported General Chemistry II grades for treatment students (n = 21, M = 3.14, [2.75, 3.53]) sufficiently overlapped with the actual General Chemistry II grades for treatment students (n = 45, M = 3.04, [2.74, 3.34]). Similarly, we found that the 95% confidence interval of reported General Chemistry II grades for control students (n = 27, M = 2.81, [2.48, 3.14]) sufficiently overlapped with the actual General Chemistry II grades for control students (n = 45, M = 2.64, [2.37, 2.91]).
Study behaviors, triggered recall
Students answered Likert-style questions regarding nine study behaviors. We compared the frequency with which the treatment and control groups reported engaging in these nine behaviors. Because the data of all nine categories were non-normally distributed (significant Shapiro-Wilk test in all cases, p < .05), we conducted separate Mann-Whitney U tests for each study behavior. We found a significant difference in the reported utilization of only one study behavior, this being the watching of online videos, where the treatment group reported a significantly greater utilization of this strategy (U = 78, p2-tailed < .05, effect size = 0.279).
We further examined students’ reported study behaviors by collapsing relevant strategies into two categories: active behaviors and passive behaviors, where active behaviors were defined the combination or sum of creating flashcards, doing hw, and using models, and where passive behaviors were defined as the combination of reading the textbook, watching videos and using mnemonics. Again, Shapiro-Wilk tests demonstrated non-normal distributions. Mann-Whitney U tests were run for the two variables (active and passive). However, neither was found to be significant.
Discussion
Overall performance
When comparing the performance of the treatment and control groups, the treatment group significantly outperformed the control group on three separate measures: final exam scores, a common final exam question, and computed course grades. These results are promising but must be interpreted with some caution as many F students and all W students did not take the final exam. However, it is likely that the impact of the absence of W treatment students from the final was offset by the absence of F control students from the final.
It should also be noted that although many presumably weaker treatment students withdrew from the course, successful students (whose computed course grades were 60% or greater; see Note 3 at end of article) were 1.5 times more likely to be treatment students rather than control students (see Figure 2).
F versus W
When examining the characteristics of students who received grades of F or W, we noted a number of differences between the treatment and control groups. In the control group, only students who performed very poorly on the first two quizzes chose to withdraw. In the treatment group, however, more students withdrew, and it was students whose performance was mediocre who chose to withdraw.
Figure 4 provides evidence that it may in fact have been the combined effect of completing exam wrappers 1 and 2 with quizzes 1 and 2 that led treatment students to realize they were in trouble and withdraw. Figure 5 provides additional evidence, demonstrating that by the time of the final exam, a larger percentage of failing control students had given up altogether, whereas only a smaller percentage of failing treatment students had done so. Perhaps students who did not show for the final did so because they realized it was mathematically impossible to pass, or because they decided they were too far behind to catch up. Regardless of their exact motivations, Figure 5 supports the idea that (due to the exam wrappers) treatment students were more likely to figure out that they were in trouble in time to withdraw, whereas control students were more likely to figure this out too late.
Study behaviors
Although only about half of the study participants filled out the end-of- semester survey, we have some, albeit limited, evidence that the treatment and control groups differed in their reported study behaviors. The treatment group was significantly more likely to utilize online videos.
Limitations
This study is limited in generalizability. The instructor of the course was one of the researchers and so her expectations may have inadvertently influenced the outcomes of this study. Because the study was conducted during a short summer session, it is not known how the pacing or intensity of the course may have influenced students’ experiences of the exam wrappers. Additionally, the demographics of the student population may have been somewhat different during the summer. There may have been fewer UREM and first-generation students and/or slightly higher numbers of visiting and transfer students. Additionally, because financial aid is not available during the summer sessions, it is likely that the percentage of low-income students in the summer session was lower as well.
Conclusions
The exam wrappers utilized in this study may have been effective at stimulating students to reflect on their performance and study behaviors, resulting in improved performance in Organic Chemistry I. The implementation of these wrappers was straightforward. In this study, wrappers were administered in class. In another study of Organic Chemistry students (under review), wrappers were administered online using course management software. Because exam wrappers can be administered online, they require only minimal instructor involvement and do not intrude onto the established curriculum. They also can complement and coincide with a variety of teaching methods and pedagogies. They therefore have excellent potential as an effective interventional strategy for a wide variety of gateway STEM courses. In particular, when utilized in a full 15-week, semester-long course, they have the potential to serve as an effective, early warning system to detect at-risk students.
Notes
Note 1: A mixture of study behaviors, some more active and some more passive, were deliberately chosen.
Note 2: We utilized only the General Chemistry II scores at our institution because we knew that these scores were reliably consistent across different semesters and different instructors.
Note 3: Because students’ grades were curved upward by approximately 20 points, students scoring in the 60%–69% range were roughly B students.
Acknowledgments
Support for this research was received from the National Science Foundation, Award #1461099.
Alla Chavarga is a postdoctoral researcher at Brooklyn College, City University of New York, in Brooklyn, New York; Evan Grandoit is a graduate student at Northwestern University in Evanston, Illinois; Shoshana Mayer is a graduate student at Rutgers University in New Brunswick, New Jersey; Milushka Elbulok-Charcape and Alison C. Domzalski are graduate students at the Graduate Center of the City University of New York in New York, New York; and Gail Horowitz (ghorowitz@polyprep.org) is a teacher in the Science Department at Poly Prep Country Day School in Brooklyn, New York. At the time this article was written, Gail Horowitz was a lecturer in the Department of Chemistry at Brooklyn College, Edith Rosales was a student at Brooklyn College, and Natasha Hackman was a student at Baruch College, City University of New York, in New York, New York.