
feature
Factors Associated With Students Graduating With STEM Degrees at a Military Academy: Improving Success by Identifying Early Obstacles
Journal of College Science Teaching—September/October 2020 (Volume 50, Issue 1)
By Jessica H. Dwyer, Wilson J. González-Espada, Kimberly de la Harpe, and David C. Meier
The United States is not graduating enough science, technology, engineering, and mathematics (STEM) majors for the increasing number of available employment opportunities and national security needs. The purpose of this study was to quantify the magnitude of STEM attrition at the United States Air Force Academy (USAFA), a military service academy and one of the three commissioning sources of officers for the United States Air Force. Also, the study identified factors associated with STEM attrition among students. Despite strong academic preparation, of the students who reported their intention to major in a STEM discipline as incoming freshmen, 36.4% switched and graduated with a nonSTEM degree. Two binary logistic regressions revealed that the best predictors associated with students graduating with a STEM major were their initial intention and motivation to major in these disciplines upon arrival at the USAFA and course grades in Calculus I, Calculus-based General Physics I, and Applications of Chemistry I. These findings suggest that, as in many other universities, students motivated to major in STEM may switch out if they struggle with prerequisite quantitative courses.
Graduates with science, technology, engineering, and mathematics (STEM) degrees are essential for a large number of professions, for a robust economy, and for a strong military (Fayer et al., 2017); however, the United States is not graduating enough STEM majors. It is expected that by the year 2020, there will be more than 600,000 new STEM job openings (Chen, 2015; Daugherty & Lane, 1999; NSB, 2018; PCAST, 2012; Sithole et al., 2017); therefore, increasing the number of STEM graduates remains a significant concern and a priority for action among researchers and policymakers (Atkinson & Mayo, 2010; King, 2015; NRC, 2010).
Regardless of their goals of becoming STEM majors, many underclassmen struggle with the transition from high school to college (Gonzalez & Napoleoni, 2006; Hrabowski & Maton, 1995). Factors such as passive, lecture-oriented teaching methods (Hake, 1998; Laws, 1997; Meltzer, 2002) and the fast pace of college courses (Salem et al., 1997; Seymour & Hewitt, 2000) can negatively affect the academic performance of even the academically strongest students (Schroeder, 2003).
Underclassmen may also need to improve one or more of the following “soft skills” considered critical to success in an academic environment, particularly in STEM: attending class regularly, maintaining concentration, using effective study techniques, applying metacognitive tools to recognize to what extent they are understanding the material, asking questions to faculty or peers, and recognizing when to seek academic assistance (Laskey & Hetzel, 2011).
jTinto’s 2012 study has a broader model of college student attrition. In it, he argues that the more socially and academically integrated students are into a college setting, the better chance they have of completing a degree. To what extent the social and academic integration is successful depends on a number of student characteristics, and systemic issues specific to institutional and programmatic cultures (Rendon et al., 2000).
STEM attrition occurs when a student who entered college with the goal of graduating with a STEM degree decides to switch into a nonSTEM major, or drops out of college altogether (Brewer et al., 2019; Green & Sanderson, 2017). Nationwide, of those first-time postsecondary students who declared STEM majors and began attending four-year colleges and universities in the academic year 2011–2012, 31% left STEM by the academic year 2013–2014 (NSB, 2018). In quantitative disciplines, such as mathematics, physics, chemistry, and engineering, recent national statistics state that STEM attrition can be as high as 50% (Chen & Wako, 2009; Fakcharoenphol et al., 2015; Mason & Singh, 2016; Nuñez-Peña et al., 2013; Perry, 2004). Many factors have been statistically associated with STEM attrition. Some of these include: High school background: Lower high school rank and low math ACT/SAT scores (Green & Sanderson, 2017). College academics: Lower college GPA, lower college mathematics grades, low-quality faculty-student interactions, lost interest in STEM, and poor grades in prerequisite classes (Aulck et al., 2017; Christe, 2013; Green & Sanderson, 2017; Seymour & Hewitt, 2000; Sithole et al., 2017). College “soft skills”: Poor time-management skills and study habits (Sithole et al., 2017). Intrapersonal: Perception of uncertainty about academic ability, low tolerance for failure, diminished personal commitment to attaining a STEM degree, and low self-efficacy and motivation (Ackerman et al., 2013; Braxton, et al., 2004; Shedlosky-Shoemaker & Fautch, 2015). Course structure: Enrollment in fast-paced courses where small group work and attendance are not emphasized (Mervis, 2010). Gender, race, ethnicity, and socioeconomic status: Being an underrepresented minority (except for Asian or Asian American), a female student, or coming from a low socioeconomic status (Chen, 2013; Gayles & Ampaw, 2016; Griffith, 2010; Mervis, 2010; Seymour & Hewitt, 2000). Student perceptions of institutional conditions: Lower quality of teaching and academic programs, dull classroom presentations, larger faculty-student ratios, and poor accessibility to faculty for help and support (Braxton, et al., 2004; Watkins & Mazur, 2013; Xu, 2018).
The purpose of this study was to quantify the magnitude of STEM attrition at USAFA and to statistically identify factors that may be associated with this attrition. The research questions that guided this study were: (a) What precollegiate and collegiate factors were associated with students completing a bachelor’s degree in a STEM discipline? and (b) What factors were associated with students undecided about their major completing a bachelor’s degree in a STEM discipline? Because the interest of the authors is not on cause/effect model testing or theory building, and is focused more on starting to identify trends, patterns, and potential relationships emerging from a dataset that has not been analyzed before, this study was conducted within the framework of exploratory research.
The USAFA is an institution accredited by the Higher Learning Commission to grant bachelor’s degrees to qualified officers (see Table 1 for USAFA’s STEM and nonSTEM majors). It is worth mentioning that all USAFA students graduate with a Bachelor of Science degree, regardless of academic major, because the core curriculum heavily leans toward technical coursework (NRC, 2010). Normally, students do not declare a major until their third semester at the USAFA.
| Table 1. United States Air Force Academy majors classified as STEM or nonSTEM (USAFA, 2016). | ||||
|---|---|---|---|---|
|
Methodology
For this study, the population of interest was college students who earned a bachelor’s degree. Our convenience sample consisted of 4,498 students who graduated from the USAFA between 2015 and 2019. Datasets from the Office of the Registrar and the Department of Mathematics were obtained, and variables of interest were classified as “precollegiate” and “collegiate.” Precollegiate variables were quantified before the start of students’ first semester and included: Standardized college admission test scores: ACT combined scores (SAT combined scores were converted into the equivalent ACT score based on a concordance table provided by ACT, Inc.) Intended major: As part of the orientation activities for new students, they were asked to complete a survey. One of the questions asked students to select one of these three options: “I intend to pursue a major in the social sciences, or humanities (i.e., political science, behavioral science, foreign area studies, management, history, English, or economics),” “I am undecided about my major at this time,” or “I intend to pursue a major in science or engineering (i.e., I plan to major in physics, chemistry, computer science, or an engineering field like mechanical, electrical, aeronautical, etc.).” Math placement test (MPT) scores: This 63-point diagnostic assessment, administered by the Department of Mathematics, is completed by incoming students as a complementary tool to math ACT scores for placing students in the appropriate introductory math course in the sequence. The instrument included multiple-choice questions covering algebra (n = 31), trigonometry (n = 8), and calculus 1 (n = 24). Student gender, self-reported as male or female.
The collegiate variables were those quantified after the students started class, and included: Course grades in Applications of Chemistry I (C100), Introductory Composition and Research I (E111), Calculus I (M141), and General Physics I (P110): Grades at USAFA are labeled as follows: 4 = A, 3.7 = A-, 3.3 = B+, 3 = B, 2.7 = B-, 2.3 = C+, 2 = C, 1.7 = C-, 1 = D, and 0 = F. These core classes are typically completed during the students’ first year at the USAFA and are required for both STEM and nonSTEM majors. Number of students who failed and repeated classes in Engineering Mechanics 220 (EM220), Calculus I (M141), Calculus II (M142/152), General Physics I (P110), and General Physics II (P215). Number of students who validated C100, E111, M141, and P110: Validation is the process by which students complete an equivalent USAFA course prior to enrolling (usually through AP or dual credit), and receive credit so that they can move on to the next class in the course sequence.
The dependent variable in this study was the students’ majors at graduation, either STEM or nonSTEM.
Based on previous studies, the researchers expected that students who (a) earned better ACT/SAT combined scores, (b) earned better MPT scores, (c) intended to major in STEM as freshmen, (d) were male, (e) earned better grades in quantitative core courses, (f) did not fail or repeat a class, and (g) validated one or more quantitative core courses would be more likely to graduate in STEM disciplines.
The analyses consisted of descriptive and inferential statistics, including a Kruskal-Wallis test, a nonparametric version of ANOVA. This test was selected because some of the variables were nominal or ordinal, or did not meet other ANOVA test assumptions. Given the exploratory nature of this study and the importance of balancing the possibilities of Type I and II errors, the researchers set the significance level for all statistical tests at 0.05; a Bonferroni correction was applied to pairwise posthoc tests.
The main analysis consisted of two binary logistic regressions (BLR), one using independent precollegiate variables and graduation major, and the second using independent collegiate variables, where the same dependent variable was used in both BLRs. The BLR test is a variation of multivariate linear regression that is appropriate when the dependent variable is nominal and includes two options. In this case, student major at graduation was classified as nonSTEM or STEM (Hosmer et al., 2013; Osborne, 2015; Schroeder et al., 2017).
BLR works best when two main assumptions are met: a large sample size and low intercorrelation among predictors. For this study, a sample size of about 4,500 students is adequate for the analysis. To diagnose multicollinearity, a Pearson or Spearman correlation matrix was calculated. Following Evans (1996) classification of correlation coefficient strength, it was found that the majority of the correlations between independent variables were very weak or weak.
To minimize errors caused by the few moderate multicollinearities present in the data, the BLR analysis proceeded using a forward stepwise approach, where the independent variable that best predicts graduating with or without a STEM major enters the model first, followed by the second-best independent variable, and so on. Variance measurements determined whether adding extra independent variables made a significant difference or not.
The effect size of the contribution of each independent variable to the precollegiate and collegiate models was estimated using eB, the odds ratio. For this analysis, and because of the way the dependent variable was coded, an odds ratio larger than 1.00 means that an independent variable is associated with a higher probability of a student graduating with a STEM degree, and an odds ratio smaller than 1.00 means that an independent variable is associated with a higher probability of a student graduating with a nonSTEM degree.
Results
Descriptive statistics
Of the 4,498 students who graduated from the USAFA in the last five years, there were 3,434 male and 1,064 female students, for a male to female ratio of about 3:1. Before the first semester started, a total of 2,727 students (60.63%) reported that they intended to major in STEM, compared with 980 “undecided” students (21.79%) and 791 students (17.59%) who intended to major in nonSTEM. The average MPT score was 38.29 points or about 60.78%. The average ACT score was 28.71 points. As a way to contextualize the generalizability of this study, an average high school graduate has an ACT score of 20.8 points (ACT Inc., 2018).
In terms of coursework, the average grades of students who passed the STEM classes examined in this study were 2.83 for C100, 2.64 for M141, and 2.74 for P110. The average grade for E111, a nonSTEM class, was 3.12. Courses that were repeated most frequently included EM220 (n = 154 students, or 3.23%), M141 (n = 82 students, or 1.72%), M142/152 (n = 157 students, or 3.30%), P110 (n = 103 students, or 2.16%), and P215 (n = 92 students, or 1.93%). A total of 897 (18.84%), 697 (14.64%), 1,759 (36.95%), and 418 (8.78%) students validated C100, E111, M141, and P110, respectively. Of the graduates, 1,970 (43.79%) majored in STEM, compared with 2,528 students who majored in a nonSTEM discipline. The GPA obtained by STEM graduates was 3.19 points, compared with a GPA of 2.93 points for nonSTEM graduates (on a 0 to 4 point-scale).
To start exploring potential differences between students’ intended and completed majors, the sample was divided into six categories. Of particular interest is the category of STEM switchers, students with an intended STEM major but a nonSTEM graduation major. In addition, average values for selected independent variables were obtained and a Kruskal-Wallis test was performed to identify groups that were similar or statistically different from STEM switchers. These results are summarized in Table 2.
| Table 2. Categories of intended and graduation majors. | ||
|---|---|---|
|
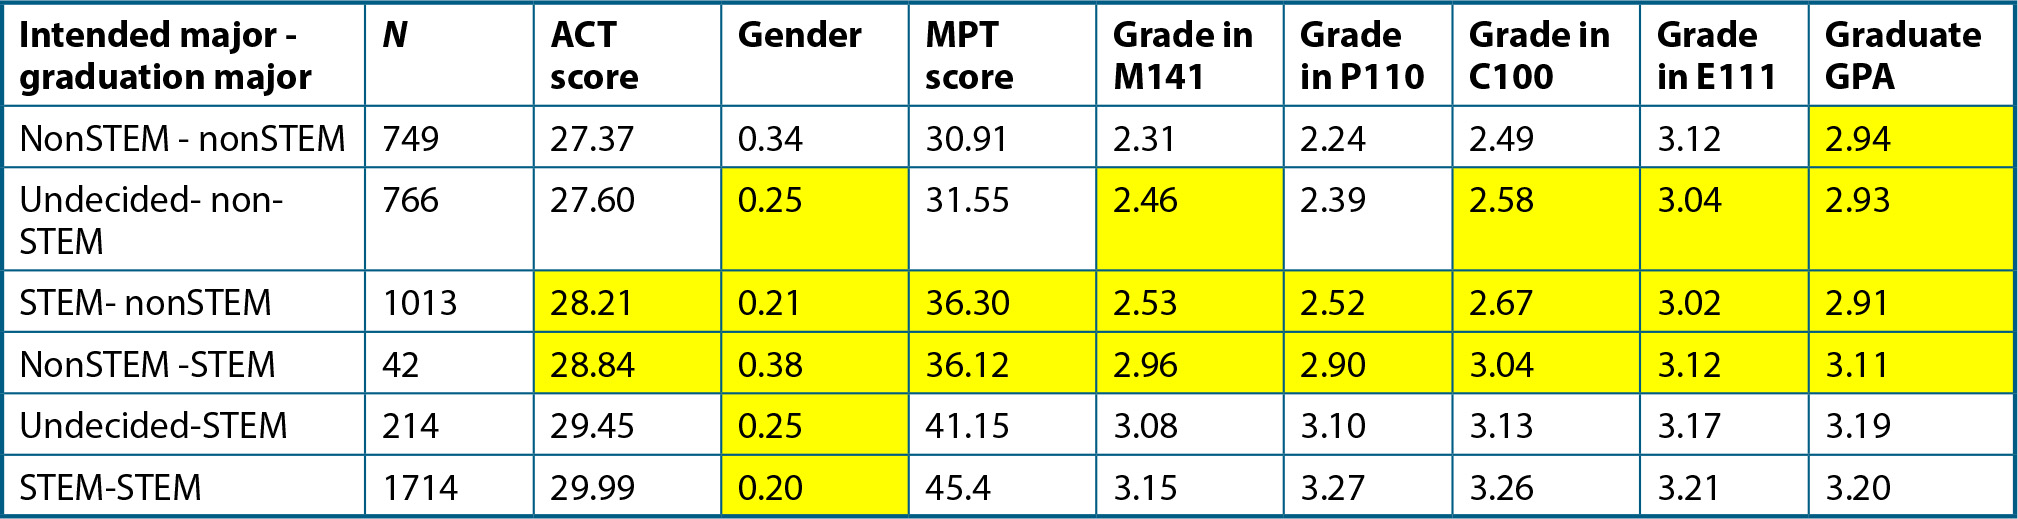
It can be noted that STEM switchers are the second largest group of students, representing about 22.5% of the sample or an average of 200 STEM switchers per graduating class. Students who switched majors either way seem to have very similar average values in the variables of interest, and have some similarities with initially undecided students who earned a nonSTEM degree. In contrast, students who remained in their intended major have quite different data averages.
Regression analysis
The BLR analyses were performed separately with precollegiate and collegiate variables and major upon graduation as the dependent variable. Gender, course repetition, and course validation were not statistically significantly associated with the students’ majors at graduation (p > 0.05); therefore, they were removed from the analyses, and they were performed again.
The best BLR model with precollegiate variables, which explained 44.2% of the variance in the data, revealed that the top predictor of students graduating with a STEM major was their intended major before their freshman year (Table 3). A student who intends to graduate in STEM is 3.34 times more likely to graduate within that major, compared with nonSTEM graduates. The second predictor was ACT scores, meaning that students with better ACT scores are 13% more likely to graduate with a STEM major. MPT scores loaded last in the model, and better scores were associated with a 6.1% increased likelihood of a student graduating in a STEM discipline.
| Table 3. Binary logistic regression results for the best precollegiate model and 2015–2019 data. | ||||||||||||||||||||
|---|---|---|---|---|---|---|---|---|---|---|---|---|---|---|---|---|---|---|---|---|
|
Table 4 results indicate that the best BLR model with postcollegiate variables (which explained 24% of the variance in the data) revealed that the top predictor of students graduating with a STEM major was M141 grades, meaning that students with better grades in this class are 98.1% more likely to graduate with a STEM degree. The second best predictor was grades in P110, with better grades associated with a 66.7% increase in the likelihood of graduating in STEM. The last variable associated with graduating in STEM was C100 grades, with an increased likelihood of 46.8%.
| Table 4. Binary logistic regression results for the best postcollegiate model and 2015–2019 data. | |||||||||||||||||||||||||
|---|---|---|---|---|---|---|---|---|---|---|---|---|---|---|---|---|---|---|---|---|---|---|---|---|---|
|
The variance of these BLR models explains, on average, about 34% of the variance in the yearly dataset, which means that other variables, possibly associated with college “soft skills,” interpersonal issues, or students’ perceptions of institutional conditions should be considered for further research and analysis.
From undecided to STEM graduate? Regression results
One way to offset the number of students who switch out of STEM and, possibly, to increase the total number of STEM graduates, is to identify variables associated with those students who were undecided about their intended major at the USAFA before their freshmen year, but who graduated with a STEM degree. Based on this information, an exploratory BLR analysis was used to identify factors associated with this sub-group. Because this analysis is exploratory, both precollegiate and collegiate variables were included in a single analysis, even though ACT/SAT scores, MPT scores, and course grades are moderately correlated, which may have an effect on the robustness of this BLR analysis.
Data from 2015–2019 revealed that 980 students did not know what major they wanted to complete as they started their first semester. Of these, 766 (78%) majored in a nonSTEM discipline and the remaining 214 students majored in STEM. The analysis showed that the best predictors of undecided students graduating with a STEM degree were grades in M141 and P110. Better grades in these classes were associated with a 60% and 51.5% increased likelihood of a student graduating with a STEM degree. MPT scores were weakly associated with major upon graduation. These predictors are intriguing; it is not clear whether success in M141 and P110 motivated students to declare a STEM major, or whether these predictors are simply identifying academically stronger students. Future research is needed to untangle exactly what is going on and how to support undecided students to do better in M141 and P110 so that they consider STEM majors. Table 5 summarizes these regression results.
| Table 5. Binary logistic regression results for a pre- and postcollegiate model, undecided students, and 2015–2019 data. | ||||||||||||||||||||
|---|---|---|---|---|---|---|---|---|---|---|---|---|---|---|---|---|---|---|---|---|
|
Conclusion
The purpose of this study was to find associations with students majoring in STEM versus nonSTEM disciplines at the USAFA. A student’s intention to major in a STEM field before their freshman year, and better grades in M141, P110, and C100 were strongly associated with graduating with a STEM degree. Importantly, struggling academically and repeating a course (associated with less-prepared students), validating a class (associated with better-prepared students), and gender were not related to students’ majors upon graduation. This result departs from other studies that have shown that female and less-prepared students have a lower probability of graduating with a STEM degree (Blickenstaff, 2005; Gayles & Ampaw, 2014; Hill et al., 2010).
More than 1,000 students, or 22.5% of the sampled population, intended to major in STEM disciplines upon entering the USAFA, but ended up graduating in a nonSTEM discipline. This is somewhat lower than the national average for STEM switchers, which is around 31% (NSB, 2018). One important aspect to consider is that STEM majors at the USAFA, with the exception of basic sciences, biology, and biochemistry, are quantitative in nature. Quantitative majors are the most likely to see students switch from STEM to nonSTEM.
The findings of this study must be examined in the context of its limitations. First, although the study examined a population of students who graduated from 2015–2019 (instead of using sampling), as a group, these students may not be representative of students in civilian universities and generalizability may be limited. For instance, nonacademic variables such as physical fitness, leadership, and requirement for congressional nomination are part of the admission criteria for the USAFA. Second, academic achievement in courses is reported as categories (letter grades) instead of overall (continuous) scores that have a finer differentiating ability. Also, it is not possible to identify what specific coursework features (instructor content and pedagogical knowledge, curriculum, types of assessments, etc.) led to their impact on STEM attrition and how they could be revised or improved to enhance STEM persistence. This will be an important topic for future research.
A third limitation is that students are not tracked with respect to their path toward graduation and that only start and end points are known. For example, it is possible that students changed majors more than once. Regardless of how many times they switch majors, there is no documentation from students justifying the switch. To address this issue and better understand why students decide to switch from STEM to nonSTEM majors, a follow-up mixed-methods research study is in the advanced planning stages. STEM switchers will be identified in near-real time and will be asked to complete a confidential online survey identifying academic and nonacademic factors that impacted their decision to switch out of STEM.
Many factors have been identified in the literature as associated with STEM attrition (Chen, 2013; Green & Sanderson, 2017; Seymour & Hewitt, 2000; Sithole et al., 2017). It needs to be addressed by providing rigorous academic support, better instructional strategies, tutoring, and review sessions, particularly to undecided students and those who have expressed an interest in becoming STEM majors but do not have the best grades in physics and mathematics.
Acknowledgments
This research was supported in part by the United States Air Force Academy, Center for Physics Education Research, through the Air Force Office of Scientific Research Summer Faculty Fellowship Program, Contract Numbers FA8750-15-3-6003 and FA9550-15-0001. Special thanks to Simon S. Ferrel and Samantha R. Howard for their assistance with data processing.
Jessica H. Dwyer is an assistant professor of physics and former director of the Center for Physics Education Research in the Department of Physics at the United States Air Force Academy in Colorado Springs, Colorado. Wilson J. González-Espada (w.gonzalez-espada@moreheadstate.edu) is a professor of physics and science education in the Department of Physics, Earth Science, and Space Systems Engineering at Morehead State University in Morehead, Kentucky. Kimberly de La Harpe is an associate professor in the Department of Physics and David C. Meier is an assistant professor in the Department of Physics, both at the United States Air Force Academy.