
Teacher's Toolkit
Jumping to Conclusions
Developing biomathematical predictive models
By Kylie S. Hoyle, Kristie S. Gutierrez, Lauren A. Harper, Brandon D. Hollingsworth, Margaret R. Blanchard
This article describes a “jump and reach” activity during which students make predictions, collect data, and work with teammates to mathematically predict how high their peers can jump and how far they can reach. To begin, we introduce students to the term predictive modeling, a technique used to forecast future outcomes based on collected data. Students are then asked to brainstorm a way to collect data that will allow them to mathematically predict someone’s ability to jump vertically. Students may suggest measuring physical attributes, such as height, weight, muscle size, and age to develop a mathematical model, based on these attributes, to predict how high an individual will be able to jump.
Students select the muscles or physical attributes they believe would affect jump height. For example, students may choose to measure calf or thigh circumference as a proxy for muscle size. It is important to note that students will be working in groups; thus, not everyone needs to volunteer to be measured. If students are not comfortable measuring or sharing their personal measurements, they should not be forced to do so.
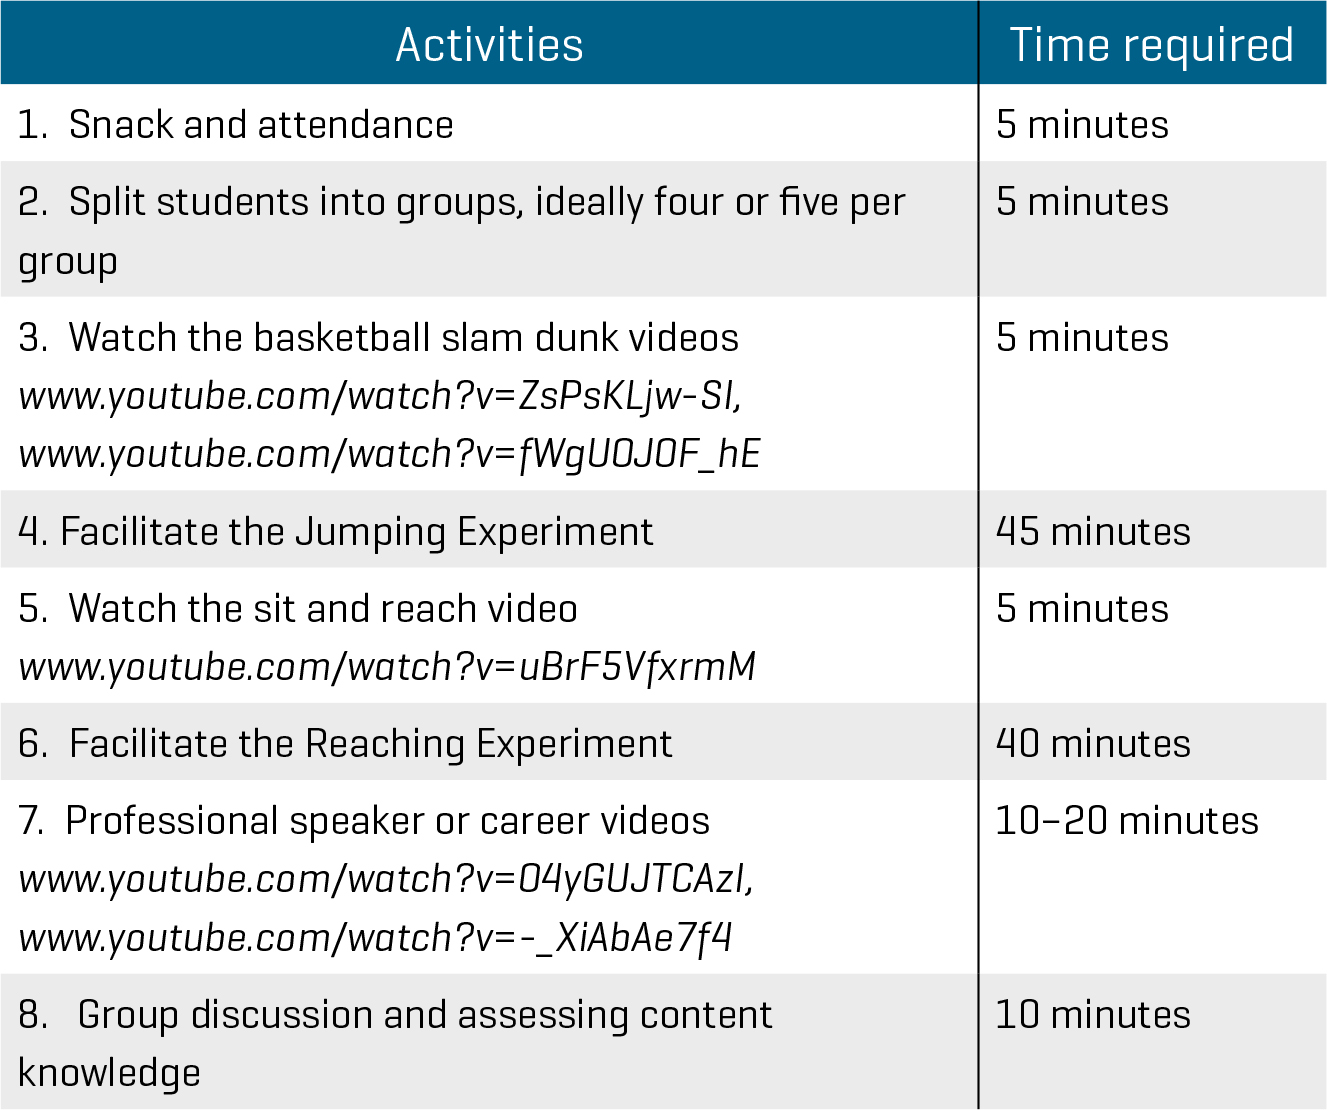
This activity was developed with a biostatistician to focus on mathematical modeling within a relevant context. This activity was first completed with middle school teachers who lead afterschool STEM clubs (Blanchard et al. 2017). The teachers then led the activity with approximately 50 students in grades 5 to 8 at four schools during two-hour afterschool STEM career clubs, held in a multipurpose room or gymnasium. Figure 1 displays the agenda of the club meeting, including the suggested time required for each activity. The activity could also be carried out during one to two class periods within the regular school day.
Agenda for the jump and reach activity
Getting started
Students were first divided into groups of three or four (either self-selected or organized by teachers), in preparation for the jump and reach activities. Teachers could group students based on grade level or gender, if the teacher believes it would minimize body image issues and make students feel more comfortable. Additionally, students can take their own measurements for most variables. Students were then shown a video clip (see Figure 1) of a seemingly “regular” guy from the audience who gets chosen to participate in a dunking showcase hosted by NBA legends. The slender, six-foot-one inch basketball player, Jordan Kilganon, who is actually a professional dunker, shocks everyone when he comes onto the court and slam dunks the ball. As the video continues, Kilganon performs difficult variations of the slam dunk that continue to amaze the NBA legends.
After the video, ask students, “Did you think the guy from the audience would be able to dunk the ball like he did? Why or why not?” and “What makes one person able to jump higher than another?” These questions help prompt students to think critically about different characteristics that affect vertical jumping ability.
Facilitate the jumping experiment
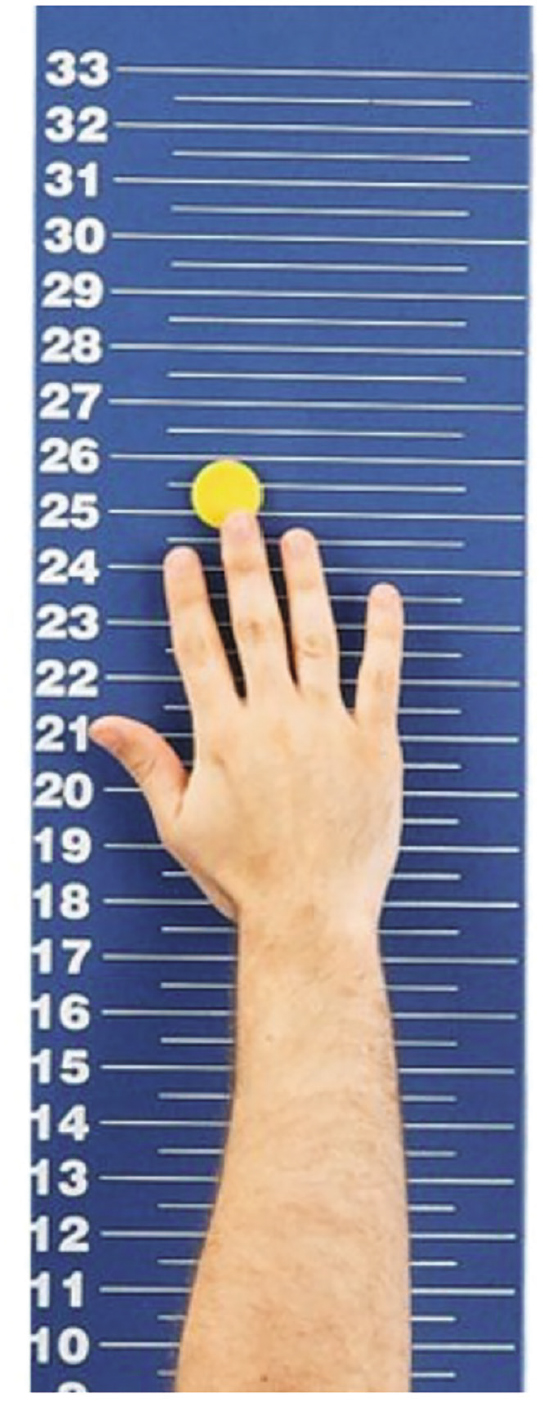
For this activity, a vertical jump board (Figure 2) will need to be secured to the wall, and students will need enough room to jump and land safely. (Note: The jumping experiment could be completed on a shoestring budget with taped lines at 2.5 cm [1 in.] increments and stickers or pieces of tape that students could affix to the wall as they jump.) We solicited volunteers from the class to participate. Students who are unable or uninterested in jumping can take active roles in the recording of data and making predictions and calculations. The teacher should state that students are not required to jump if they feel uncomfortable. For students with physical impairments, instructors should help assign roles within the group (e.g., data collector, measurement expert) where they will be able to participate and make meaningful team contributions. Note: Some students with physical disabilities who are unable to complete the vertical jump activity might be able to participate in the sit-and-reach activity.
A magnetic jump board with a person determining his standing reach height
Carrying out the vertical jump
Students should begin by standing perpendicular to the jump board with the side of their arm touching the wall. With their feet remaining flat on the ground, students stretch their arm up the jump board as high as possible with their hand closest to the wall. To determine their standing reach height, group members record how high the student can reach on the Jump Activity Data Sheet.
As a reminder, not every student is expected to volunteer as a jumper, and no student should be put in a position of embarrassment. To alleviate this concern, teachers could choose to divide students into groups after doing a quick poll about who would like to participate as jumpers. There will need to be two students in each group who are comfortable with being measured and completing the vertical jump trials.
Next, students develop an equation that relates the first jumper’s explanatory variables with their vertical jump height (see sidebar, Equation for predicting jump height). They use this equation and set of explanatory variables to predict the vertical jump height for the other students in their group.
Students then measure the same variables for a second jumper. Before the second student jumps, other students in the group use the same equation they developed for the first jumper to predict the vertical jump height of the second jumper. Once the group has a prediction, the second jumper will complete the jumping test three times to assess the value of the equation. (Note: The second jumper should not be told their predicted vertical jump height, as it might inadvertently skew the results if students attempt to jump lower than their potential maximum height to fit the prediction.)
After all groups have had a chance to go through the entire activity, the teacher should lead a group discussion. Probing questions include: “What variables did you choose to measure?” “Why did you choose those variables?” “Did your equation work with both jumpers? Why or why not?” and “What would you change if you were going to conduct the experiment again?”
The sit-and-reach experiment
Students were then directed to watch a short video clip (see Figure 1) on how to complete the sit-and-reach measurement. The video features a man completing the sit-and-reach test, which measures a person’s flexibility of their lower back and hamstring muscles. Following the video, teachers should ask students if they have any questions about how to complete the sit-and-reach activity.
Using the vertical height predictive activity as a model, students similarly create a predictive model for the sit-and-reach using the Sit and Reach! Data Sheet. The setup and cost for this activity is minimal; students can set up this activity or teachers could set it up beforehand. A yardstick or flexible tape measure should be secured to the ground by placing tape (12 in. long [30 cm]) across the 15 in. (38 cm) mark perpendicular to the yardstick. This activity could be done in a traditional classroom or in a more open space such as a hallway or gymnasium.
This is an example of one possible equation based on students’ explanatory variables.
Start with the first jumper’s vertical jump measurement (e.g., 12 in. [30 cm]). Set this number equal to a function of the explanatory variables that were measured (e.g., height = 60 in. [152 cm]; weight = 120 lbs. [54 kg]; female = 10; and male = 15) and attempt to arrange the function so that both sides are equal.
12 inches vertical jump = (120 lbs/60 inches tall) + 10 (for female jumper)
12 = 2 + 10
12 = 12
This will likely take multiple attempts, and students will have to manipulate the equation through addition, subtraction, multiplication, or division until their function equals, or is close to, the individual’s vertical jump height.
Next, students write the equation in words with vertical jump height on the left-hand side of the equation followed by the function using the jumper’s three explanatory variables.
Vertical jump height (in.) = (weight (lbs /height (in.) + gender (female is 10; male is 15)
Carrying out the sit-and-reach
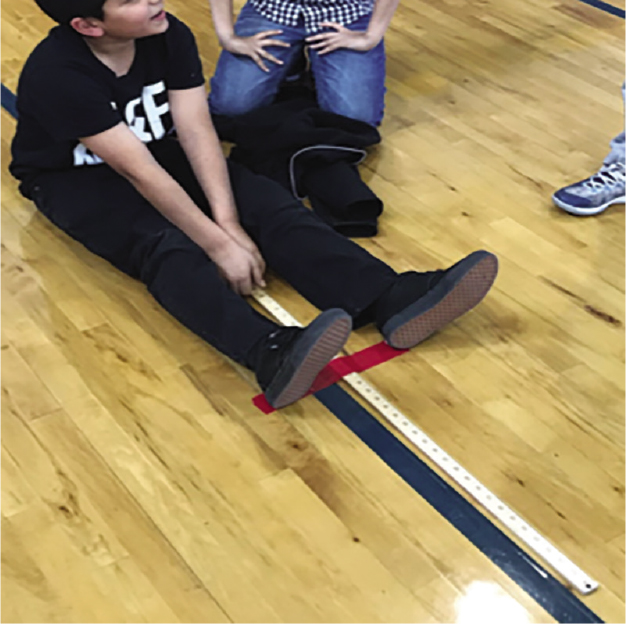
Students should brainstorm variables they think might affect someone’s ability to sit and reach long distances. Then, using a volunteer from the group, they will test the student’s ability to sit and reach. The student sits on the floor, straddling the yardstick with knees extended, and with the heels of their feet on the 15 in. (38 cm) mark (see tape as the guide) and 1 ft. apart (a ruler can be used, if desired). See Figure 3 for an example classroom setup.
Sit-and-reach classroom setup
The student reaches forward slowly, as far as possible, along the yardstick or meter stick. Group members should record the farthest reach (in cm/inches) of the first student, who must maintain contact with the yardstick for two seconds. The reach should be completed and recorded three times for each student and the average should be calculated afterward. The group chooses the variables they think will affect an individual’s sit-and-reach ability (e.g., leg length, arm length, age, athleticism, flexibility). For example, students could assign a 1 to someone who plays sports and a 0 to a person who does not participate in sports. They may even choose to assign a 1 for each of the sports that an individual plays (e.g., 1 [basketball] + 1 [soccer] + 1 [football] = 3 [all sports]).
The group then attempts to derive an equation that uses student measurements to predict their sit-and-reach ability, just as they did in the vertical jump experiment (see sidebar, Equation for predicting sit-and-reach length). Students then repeat the experiment with another volunteer to see how well the prediction works. After all groups have had a chance to go through the entire activity, the teacher should lead a group discussion using probing questions such as “What variables did you choose to measure?” “Why did you choose those variables?” “Did your equation work with both students one and two? Why or why not?” and “What would you change if you were going to conduct the experiment again?”
This is an example of one possible equation based on students’ explanatory variables
Start with the first student’s reach measurement (e.g,, 16 in. [40.64 cm]). Set this number equal to a function of the explanatory variables that were measured (e.g., age = 12 years old; arm length = 76 cm; female = 10; and male = 5) and attempt to arrange the function so that both sides are equal.
16 inches reach = 10 (for female student) + (76 (arm length in centimeters) / 12 (age in years))
16 = 10 + 6.33
16 = 16.33
This will likely take multiple attempts, and students will have to manipulate the equation through addition, subtraction, multiplication, or division until their function equals, or is close to, the individual’s sit-and-reach measurement.
Next, students write the equation in words with sit-and-reach measurement on the left-hand side of the equation followed by the function using the reacher’s three explanatory variables.
Sit-and-reach measurement (in.) = gender (female is 10; male is 5) + (arm length (cm) / age (years))
Bringing in a STEM speaker
Near the end of the lesson, a recreational sports manager spoke to the class to help connect students with a related career. A recreational sports manager works closely with athletes and team organizations to recruit and hire individuals who are both physically fit and skilled in specific sports fields. At some of the most competitive levels of athletics (e.g., Olympics, professional leagues), a recreational sports manager may use biomathematical probabilities to identify future athletes and promote their training early on. A quick online search will reveal individuals in your area (e.g., community leaders, local university contacts) with related careers such as sports statisticians, physical therapists, or medical researchers. We have found that students connect with speakers if they are able to talk in person; however, we have also had success with virtual meetings through Google Hangouts or Skype. Additionally, our experience with interactions of STEM professionals and middle school students seems to indicate that students are most interested in asking questions of the professionals and less interested in learning about the intricate details of the profession.
Assessment
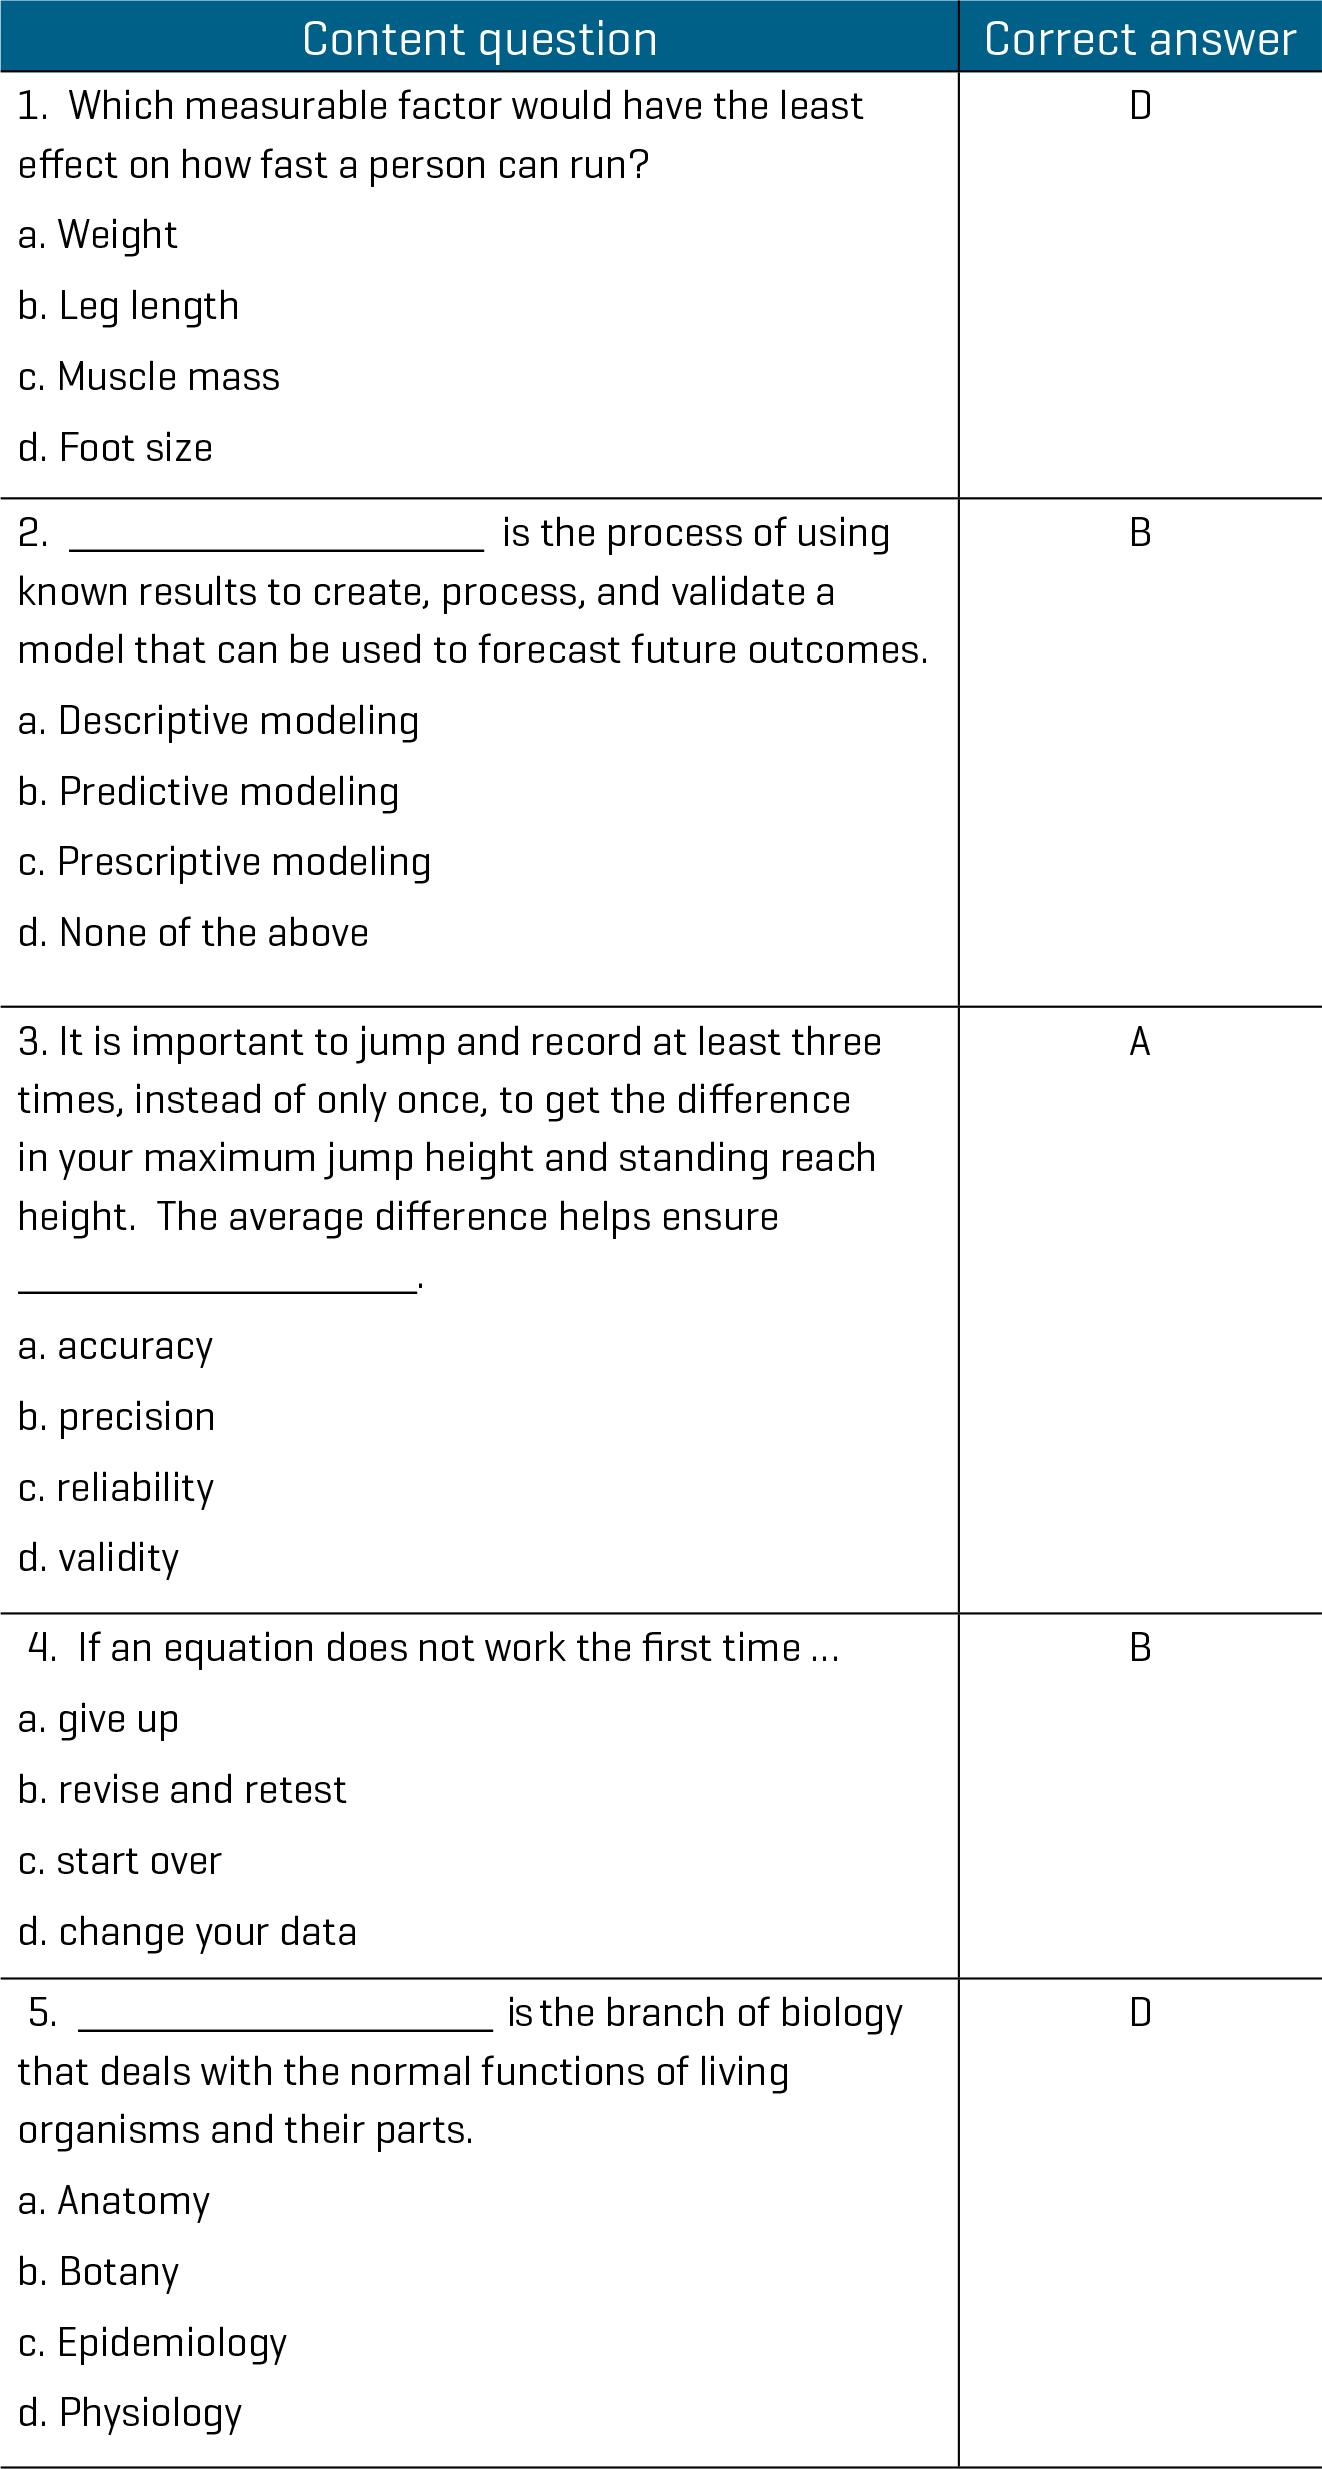
Student content knowledge can be quickly assessed individually via multiple choice questions (see Figure 4). Students took this assessment on paper as an exit ticket. However, a variety of assessment platforms could be used (e.g., Kahoot, Plickers, Socrative). Students were encouraged to help one another on their content question responses, talking through and justifying their correct answers with one another.
Multiple-choice questions
Extension
To extend the activity, add the following equation in the student data sheet for students to calculate the percent error of their calculation to determine how far off they were by using their equation to predict the actual measurements.
MS-LS4-4 in the Next Generation Science Standards asks students to “construct an explanation based on evidence that describes how genetic variations of traits in a population increase some individuals’ probability of surviving and reproducing in a specific environment.” While it may not be as essential or straightforward for humans, the concept of biomathematical probability works directly with populations of wild animals. Positive genetic traits for athleticism that are transmitted to offspring in the wild can lead to an increased ability to either catch prey or evade predators. This simplified model of natural selection based on individuals within a population supports the increased potential in reproductive success of the more athletic individuals in the wild. Using students’ bodies as a proxy, students will begin to understand ways to help model and predict links between genetic variations of traits and increased survival and reproductive probabilities.