
Elementary | Daily Do
How Can Maps Help Us?

Crosscutting Concepts Disciplinary Core Ideas Earth & Space Science Is Lesson Plan NGSS Science and Engineering Practices Elementary Grade 4
Introduction
In today's Daily Do, How Can Maps Help Us?, students engage in science and engineering practices and use both patterns and scale, proportion, and quantity as a lens to make sense of the phenomenon of changes in landscapes captured on a topographic map. Students have an opportunity to examine and use topographic maps in their respective locales. This task has been designed to be used by students, their families, and teachers in distance learning. While students could complete portions of this task independently, we encourage students to complete portions of this task under adult supervision.
What Is a Topographic Map? (Introduce the Phenomenon)
To introduce the phenomenon, prompt students to think about how they know where they are going, especially when going somewhere new. Many students will probably reply, "Google maps" or "Ask Siri," or reference some other tech device.
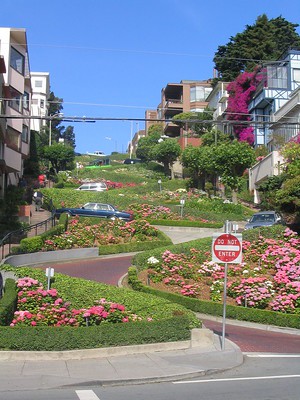
Acknowledge that all of those things are great ways to get directions, but ask, "What if you were walking or riding your bikes to somewhere new and wanted to avoid a lake, field, or a huge steep hill (like the one pictured)? What could you do?" Have students share their ideas, then share an experience with students in which you may have taken what you assumed was an easy walk and encountered an unexpected hill, and how hard that was to conquer! Wonder aloud, "What if I had a map that could've shown me where the hill was so I could've avoided it?"
Introduce the idea that we have specialized maps that can show us land features such as hills, valleys, and bodies of water.
Have students go to the U.S. Geological Survey TopoView website.
Type "Avon IL" in the Location, and hit the search icon. Click "Avon, IL" and scroll down until you get to Avon, IL 2018 (U.S. Topo) Scale 1:24000 as seen in the image below.
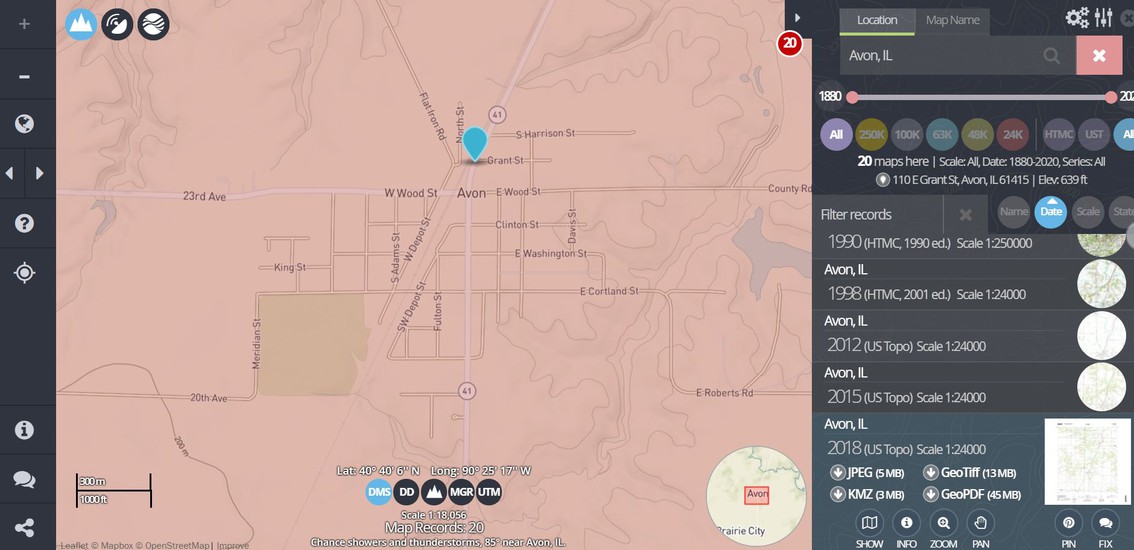
Choose the JPEG download to continue the activity (image below). Allow students to explore the image and record what they Notice and Wonder.
Lead a discussion using the following prompts:
- What do you notice as you look at the map?
- What do you wonder about as you look at the map?
Students may share that they notice the following:
- There are a lot of squiggly lines.
- The creeks and water are blue.
- Some roads are black lines and others are red lines.
- Some of the squiggly lines have numbers on them.
Students may share that they wonder:
- Why are some of the squiggly lines numbered?
- Why are roads different colors?
- What are the green areas?
- Why are some squiggly lines close together and others far apart?
Share with students, "We will examine what the symbols on the map mean so we can begin to make sense of what we are looking at next."
Teacher Guidance for Reading Topographic Maps
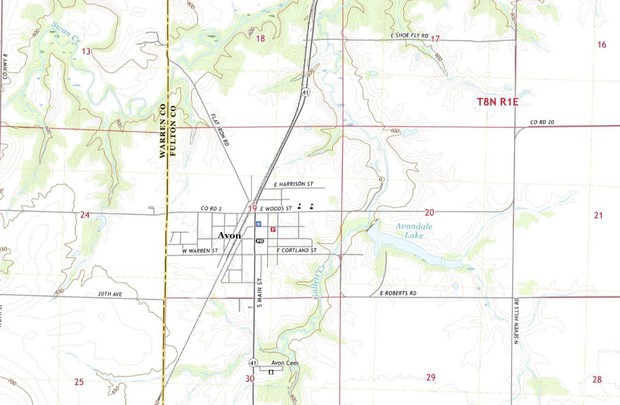
In the public land survey system, a grid divides the land into numbered townships, ranges, and sections. Each township represents 36 square miles (6 x 6 miles), and is divided into 36 sections (red numbers inside each box, 1–36). The ranges refer to how far east or west you are from a principal meridian. For the purposes of this Daily Do, it is helpful to know this so you can find a specific section (red number). For example, on the Avon topo map, the village of Avon is in Section 19 (red number 19) of Township 8 North, Range 1 East (red number abbreviated as T8N R1E).
What Do the Lines Mean on a Topographic Map?
Ask students what they think the lines on the map mean. There are different kinds of lines, so make sure students specify which lines they are talking about. Depending on the age of your students, you may want to show them the video; however, have older students figure out some things on their own or in small groups. Prompt students to look at both the dark lines and faint lines and the numbers. If needed, prompt students by asking them, "What do you notice between the two dark lines?" or "What is the difference in the numbers between the dark lines?" Using what is already on the map, have students figure out what they can. Productive struggle is good; however, there is also a video option.
Video showing how to read a Topo map by Seth Horowitz. https://www.youtube.com/watch?v=zqPMYGDxCr0&t=379s
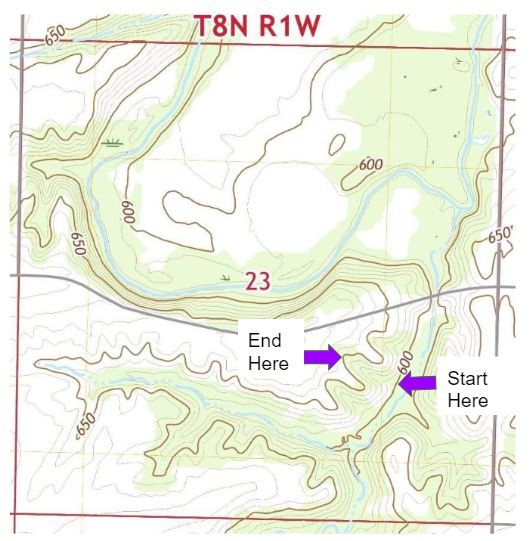
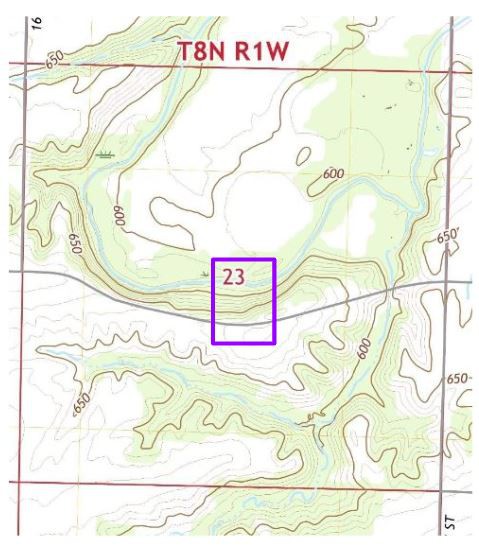
After students figure out how to read the lines on the map (via discussion or video), check for understanding by asking students to figure out what the change in elevation between contour lines is on the map of Avon, IL. Students should be able to figure out that there is a difference of 10 m between each contour line. If students struggle, have them look in the box with the red 23 (red numbers are section numbers) found in Warren Co. T8N R1W (image below). Students should be able to see two labeled contour lines, 600 and 650. As they count the contour lines between the two labeled contour lines, they should determine there are 4 lines. This means that each line needs to increase by 10 m to move from 600 to 650.
What Can the Contour Lines Tell Us? (Making Sense)
Say, "Now that we know what contour lines are on the map, I want you to find the following places on the map:
- Where is the highest point?
- Where is the lowest point?
- Use the scale on the map. Imagine that if you are going to walk a distance of 1,000 ft., where on the map would be the steepest climb or descent you would want to avoid? You may want to mark a line on a piece of paper representing 1,000 ft. using the scale on the bottom of the map for quicker reference.
*Note: We chose to use feet for this because meters were too long of a distance given the scale of the map and lack of elevation change.*
Allow students some time to work on finding the locations on the map. If students struggle, provide the following supports and use the images below:
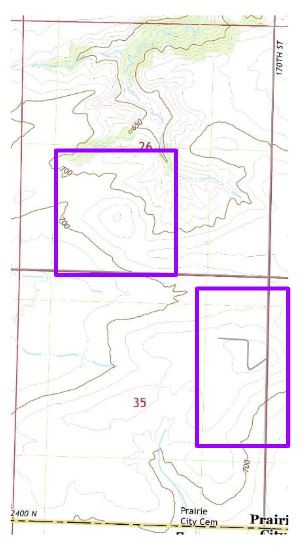
- The highest points, which are higher than 730 and less than 740, can be found in Warren Co. T8N R1W sections 26 and 35. We say it's between 730 and 740 because there is land inside the 730 line, but there is no 740 line.
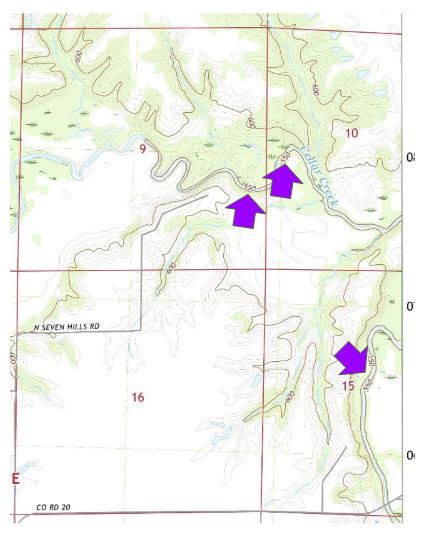
- The lowest points, which are below 550 and above 540, can be found in Fulton Co. sections 9, 10, and 15. We say it's between 550 and 540 because there is land inside the 550 line, but there is no 540 line.
- The steepest climb or descent is found in Warren Co. T8N R1W section 23 right below the section number. The 1,000 ft. measurement covers 10 contour lines, which is the most number of lines.
What Do the Other Symbols on the Map Mean?
Go to USGS Topographic Map Symbols.
Have students use the resource to answer the following questions:
- Where are there schools on the map?
- What creek does the railroad cross?
- Find the symbol "PO." What do you think it stands for? Where can you find them?
- Which direction does the intermittent stream in Knox Co. section 31 flow?
Allow students some time to work on finding the locations on the map. If students struggle, provide the following supports:
- The school symbol is very small on the resource, but looks like a building with a flag on the top. Direct students to look in the village of Avon. Students should locate two schools next to each other.
- The railroad runs through the middle of the map and is parallel to State Route 41. It is easiest to see it at the top of the map. It crosses Cedar Creek in Fulton Co. section 8.
- The symbol "PO" stands for Post Office. Students should find two of them, one in the village of Avon and one in the village of St. Augustine.
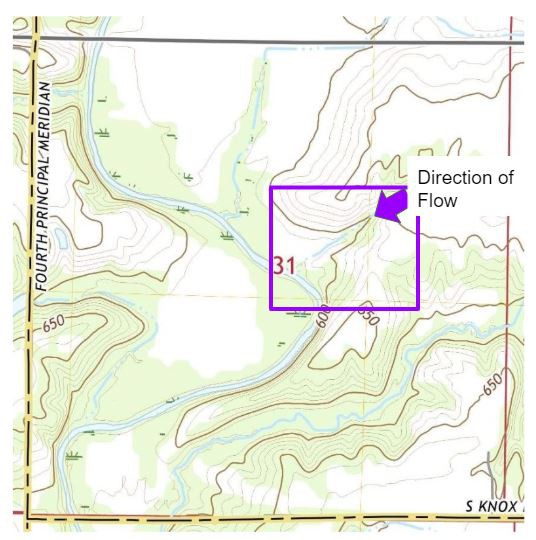
- Direct students to look in Knox Co. T9N R1E section 31. There are three intermittent streams flowing south or southwest; it will be easiest to look at the one near the red 31. Students need to remember from the video that they should look for a "V" set of contour lines to determine the direction of flow of a stream, creek, or river. The direction of flow of the intermittent stream near the red 31 is southwest. See the image below for guidance.
How Can We Use Topographic Maps Where We Live? (Solve a Problem)
Say, "Let's see if we can use topographic maps in our area to plan a trip!" Have students return to the U.S. Geological Survey TopoView website using the first link. Type the name of the city, town, or village where your students attend school or live. Decide as a group the starting point of your trip and what kind of trip you will take, by foot or by bicycle.
Have students map a trip on foot that would be the most direct route toward a creek or body of water. If students decide to go by bicycle, have them map a trip that would avoid hills.
Allow students to share the trips they have planned.
If students are able, with adult supervision, have them follow the trip they made and take pictures or video along the way to share.