
High School | Daily Do
How Do Population Shifts Affect the Ecosystem?
Is Lesson Plan Life Science High School Grades 9-12
Sensemaking Checklist


Introduction
In today's task, How do population shifts affect the ecosystem?, students engage in science and engineering practices and use the lens of cause and effect (crosscutting concept) to figure out how shifts in animal populations, specifically wildebeest, impact the ecosystem. This task has been modified from its original design to be used by high school students, families, and teachers in distance and home learning. While students could complete this task independently, we encourage students to work virtually with peers or in the home with family members.
Before you begin the task, you may want to access the accompanying How do population shifts affect the ecosystem? Google slide presentation.
Presentation of Phenomena (What am I exploring today?)
Guidance: Students experience the phenomenon of (an unexpected) change in the landscape due to the increase in population of buffalo and wildebeest. The goal is to get students to identify patterns in data to identify the cause and effect relationship between shifts in animal population and their effects on the larger ecosystem. Students then develop an ecosystem model to explain the changes in the landscape over time.
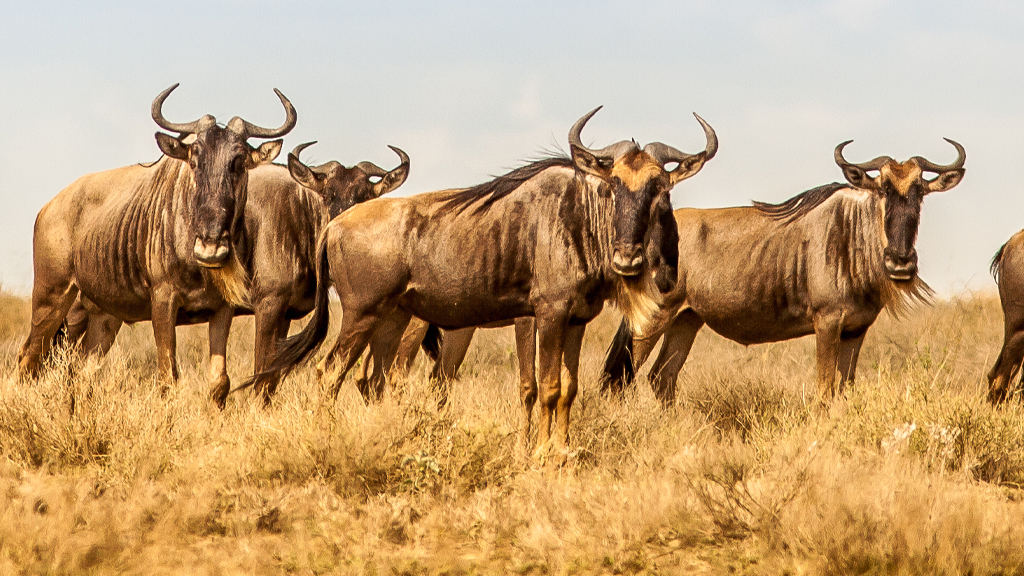
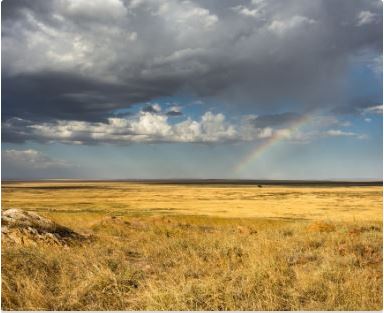
Experiencing the Phenomenon: Ask students to examine the landscape pictures of the Serengeti National Park in Africa (slide 3) and to record the changes they see occurring from year to year.
Next, show students the tree data (slide 4). Ask them to record any new observations along with any questions they have about the patterns they notice.
Suggested prompts:
- What did you notice in the images?
- What are you wondering?
- What data could we look at to get more information on what is going on with the landscape?
Examples of student noticings:
- They look like they were taken from the same spot.
- There are more trees in 1991 then in 1980.
- The vegetation looks like it gets thicker from year to year.
Investigative Questions (How can we use a simulation to investigate our questions?)
Guidance: If students have engaged in other Daily Dos about the Serengeti (How can vaccinating one population affect another? or Why does population size change?) prompt them to think about what they figured out about the buffalo and wildebeest populations. If students have not engaged in either of these Daily Dos, prompt them to think about what could cause the landscape to change over time.
Initial Investigation Questions: Have students work in small groups to discuss ideas about why they think the landscape is changing. As they discuss, ask them to write down any questions they have about the changing environment. Questions will vary based on student prior learning, but could include:
- Is the area getting more rain?
- What animals live there?
- Is there a change in the animal population?
- Do animals not eat those kind of plants?
- Can people go there or not?
- Is there a predator that keeps some animals away?
Tell students researchers have been studying the Serengeti for many years and you have some buffalo and wildebeest data you want to share with them (slide 8). Have students analyze the data and ask them what patterns they notice. They should notice that both the buffalo and wildebeest populations increased significantly from 1960 to 1975.
Have students discuss some ideas about how an increase in these populations could affect the landscape. Prompt students to think about what happened to the population after 1975 and allow them to share their ideas. Next, show students the data on slide 9.
Tell students the buffalo population seemed to level off but the wildebeest population continued to grow. It grew to over a million before it reached carrying capacity. Have students work in small groups to brainstorm ideas about how this change in the population could affect the landscape.
Many students come up with the idea that the increase of the wildebeest and buffalo populations could be related to the change in the landscape, but conclude that the data doesn't really make sense. With an increase in these herbivore populations, we would expect to see the vegetation decreasing, not increasing like the data shows. This leads to more questions:
- Could there be a change in the soil because of the poop from the animals?
- Do the wildebeest and buffalo not eat that kind of plant?
- Is that part of the Serengeti off-limits to the buffalo and wildebeest?
Additional Guidance: When looking at the graph on slide 8 of the buffalo and wildebeest, further explanation may be needed as the range of numbers has changed from a single population (buffalo) to representing 2 populations. Use this opportunity to allow students to analyze the graph first and have a discussion to see if they can explain why the buffalo population now looks like the increase in population was minimal. Explain to students that in order to show the increase in wildebeest population the parameters of the graph also needed to be adjusted. This adjustment still shows an increase in the buffalo population, however, the increased line is not as drastic.
Gathering Additional Information
Tell students that their questions are reasonable, but press on them to consider other factors that might affect ecosystem dynamics. Ask students, "What other natural occurrences (disasters) could affect the landscape?" Students will say flooding, drought, tornadoes, fires, etc. Guide the discussion to the idea of fires using prompts such as: What do you think is the most likely factor? What do we know about Africa's climate - how could that help us narrow down what we need to investigate? How could fires be a factor in changing the landscape?
Students have many ideas about how fires interact with an ecosystem and usually state that fires would destroy or "burn up" an ecosystem. Prompt them to think about what fires do to an area like the Savannah, which is mostly grass. Also, have them think about the animal populations we looked at earlier and what they eat. Have students brainstorm ideas about how buffalo, wildebeest, and fires might be connected. Have students work in small groups to develop a model of what might be going on in the ecosystem. Next, have students engage in a gallery walk to make observations of the other group models.
Student ideas that surface should include:
- A Savannah is mostly grass and would probably burn faster than a forest fire so it might not be as bad.
- Wildebeest and buffalo eat grass so maybe fires can't happen where these animals graze because there is no grass.
- Grass fires don't burn like wood fires so maybe trees don't burn up.
- The ash from the burnt grass goes back into the soil and helps new grass grow.
These ideas bring up new questions like:
- Where do buffalo and wildebeest graze?
- Where do Savanna fires occur?
- Can trees really survive a grass fire?
Display slide 11 and ask students what they notice. Agree that the buffalo remains mostly stationary and wildebeest migrate throughout the year. Next display the fire data (slide 12). Ask students, "What conclusions can you make based on these new data?"
Students should come to the conclusion that the wildfires have decreased based on the increasing number of wildebeests. Also, press on students to dig deeper into identifying specific interactions between the different components they have investigated throughout the lesson. Students should then use these ideas to revise their models to construct an explanation for how an increase in an animal's population can affect the landscape.
Additional Guidance: Depending on background knowledge some students may know that grasslands need to burn seasonally to keep the soil healthy. Grass fires and controlled burns are common in some places in the US, these fires are also a yearly occurrence on the African Savannah.
Creating Explanations
Have students revisit the models they developed in the last segment. Ask student groups to revise their models based on these new data. Encourage them to make sure their models include all the components and their interactions needed to answer the lesson question, "How do shifts in population affect the ecosystem?"
Models should include these ideas:
- More grass is eaten due to the increase in both the buffalo and wildebeest populations
- Since wildebeest migrate they consume grass in many different areas of the Savannah.
- Since there is less grass there are less fires
- Since there are less fires, more trees and other vegetation are able to grow.
- This new vegetation growth is what we are seeing in those pictures from the beginning of the lesson.
If students need more scaffolding to get to all of these ideas, engage students in a more detailed discussion around the data and outline their thoughts on the board. Elicit student ideas by asking probing questions such as: How would an increase in wildebeest and buffalo population affect the grassland? How do you think a decrease in grass affects the number of fires? After the discussion, have students revise their models based on the list that was created.
This lesson begins to build an understanding of the complex relationships that govern ecosystem dynamics. If you are interested in the storyline this task was excerpted from, see the Acknowledgements section below.
Note: If you want to learn more about engaging students with using models, visit STEM Teaching Tool 8: What is meant by engaging youth in scientific modeling?
Bringing the Serengeti Home
While the Serengeti isn't a place most students have personally experienced, they can connect the rules that govern this large ecosystem to the ecosystems around them. Families can expand on the ideas their students developed in this task by:
- Visiting parks or other outdoor areas
- Watching videos of other ecosystems
Another resource you could explore is The Serengeti Rules. or Serengeti: Nature's Living Laboratory, an HHMI Biointeractive Video.