
Let’s Be Litter Free
By Lara Smetana, Lauren Wisbrock, Micah Zaker, and Timothy Hoellein
Investigating anthropogenic litter in local ecosystems
Anthropogenic litter (AL), sometimes also referred to as “marine debris” or “urban litter,” is the accumulation of human-made materials (e.g., waste such as plastic, paper, Styrofoam, and metal) in the natural environment. Scientists have long been concerned about AL and the direct harm it has on animals, such as turtles and birds, who might mistake it for food, as well as indirect harm it has on the food chain. Because of the long time it takes for AL to decompose, the debris will persist in the environment with inevitable influences on freshwater and terrestrial ecosystems, many of which are just beginning to be studied. There are also concerns with dissolved pollutants (such as pesticides, solvents and pharmaceuticals) that move through freshwater systems, and also accumulate on the surface of plastic litter, including microplastics (tiny bits of plastic that have begun to break down).
We sought to develop a series of activities that would allow sixth- and seventh-grade students to develop an understanding of the occurrence and impact of litter in freshwater ecosystems (such as Lake Michigan and the Chicago River) and apply those understandings to evaluating various methods for monitoring AL in local environments. We also had the opportunity to collaborate with scientists and community partners who are actively engaged in research and education outreach around this issue.
Goals for the learning activities included having students develop an understanding of how pollution caused by human activities affects conditions in rivers, lakes, and other waterways as they analyze and interpret data around the accumulation of AL. Students evaluate methods for measuring and minimizing the impact of AL locally, and communicate action steps that they and their school community can take.
Enduring understandings
As we set out to design the learning activities, we met with ecologists who are studying AL locally to better understand the issue and their research. From there, we identified the following enduring understandings about AL that guided our curriculum planning: Litter is global, pervasive, increasing, and permanent. We are all collectively responsible for litter and the consumption culture we perpetuate. Litter affects our environment and us. Measuring litter (what, where, how much) is important because it helps determine future courses of action, policy, and management. Change is possible—laws, cultural shifts, and individual behaviors can be improved.
Introducing the problem
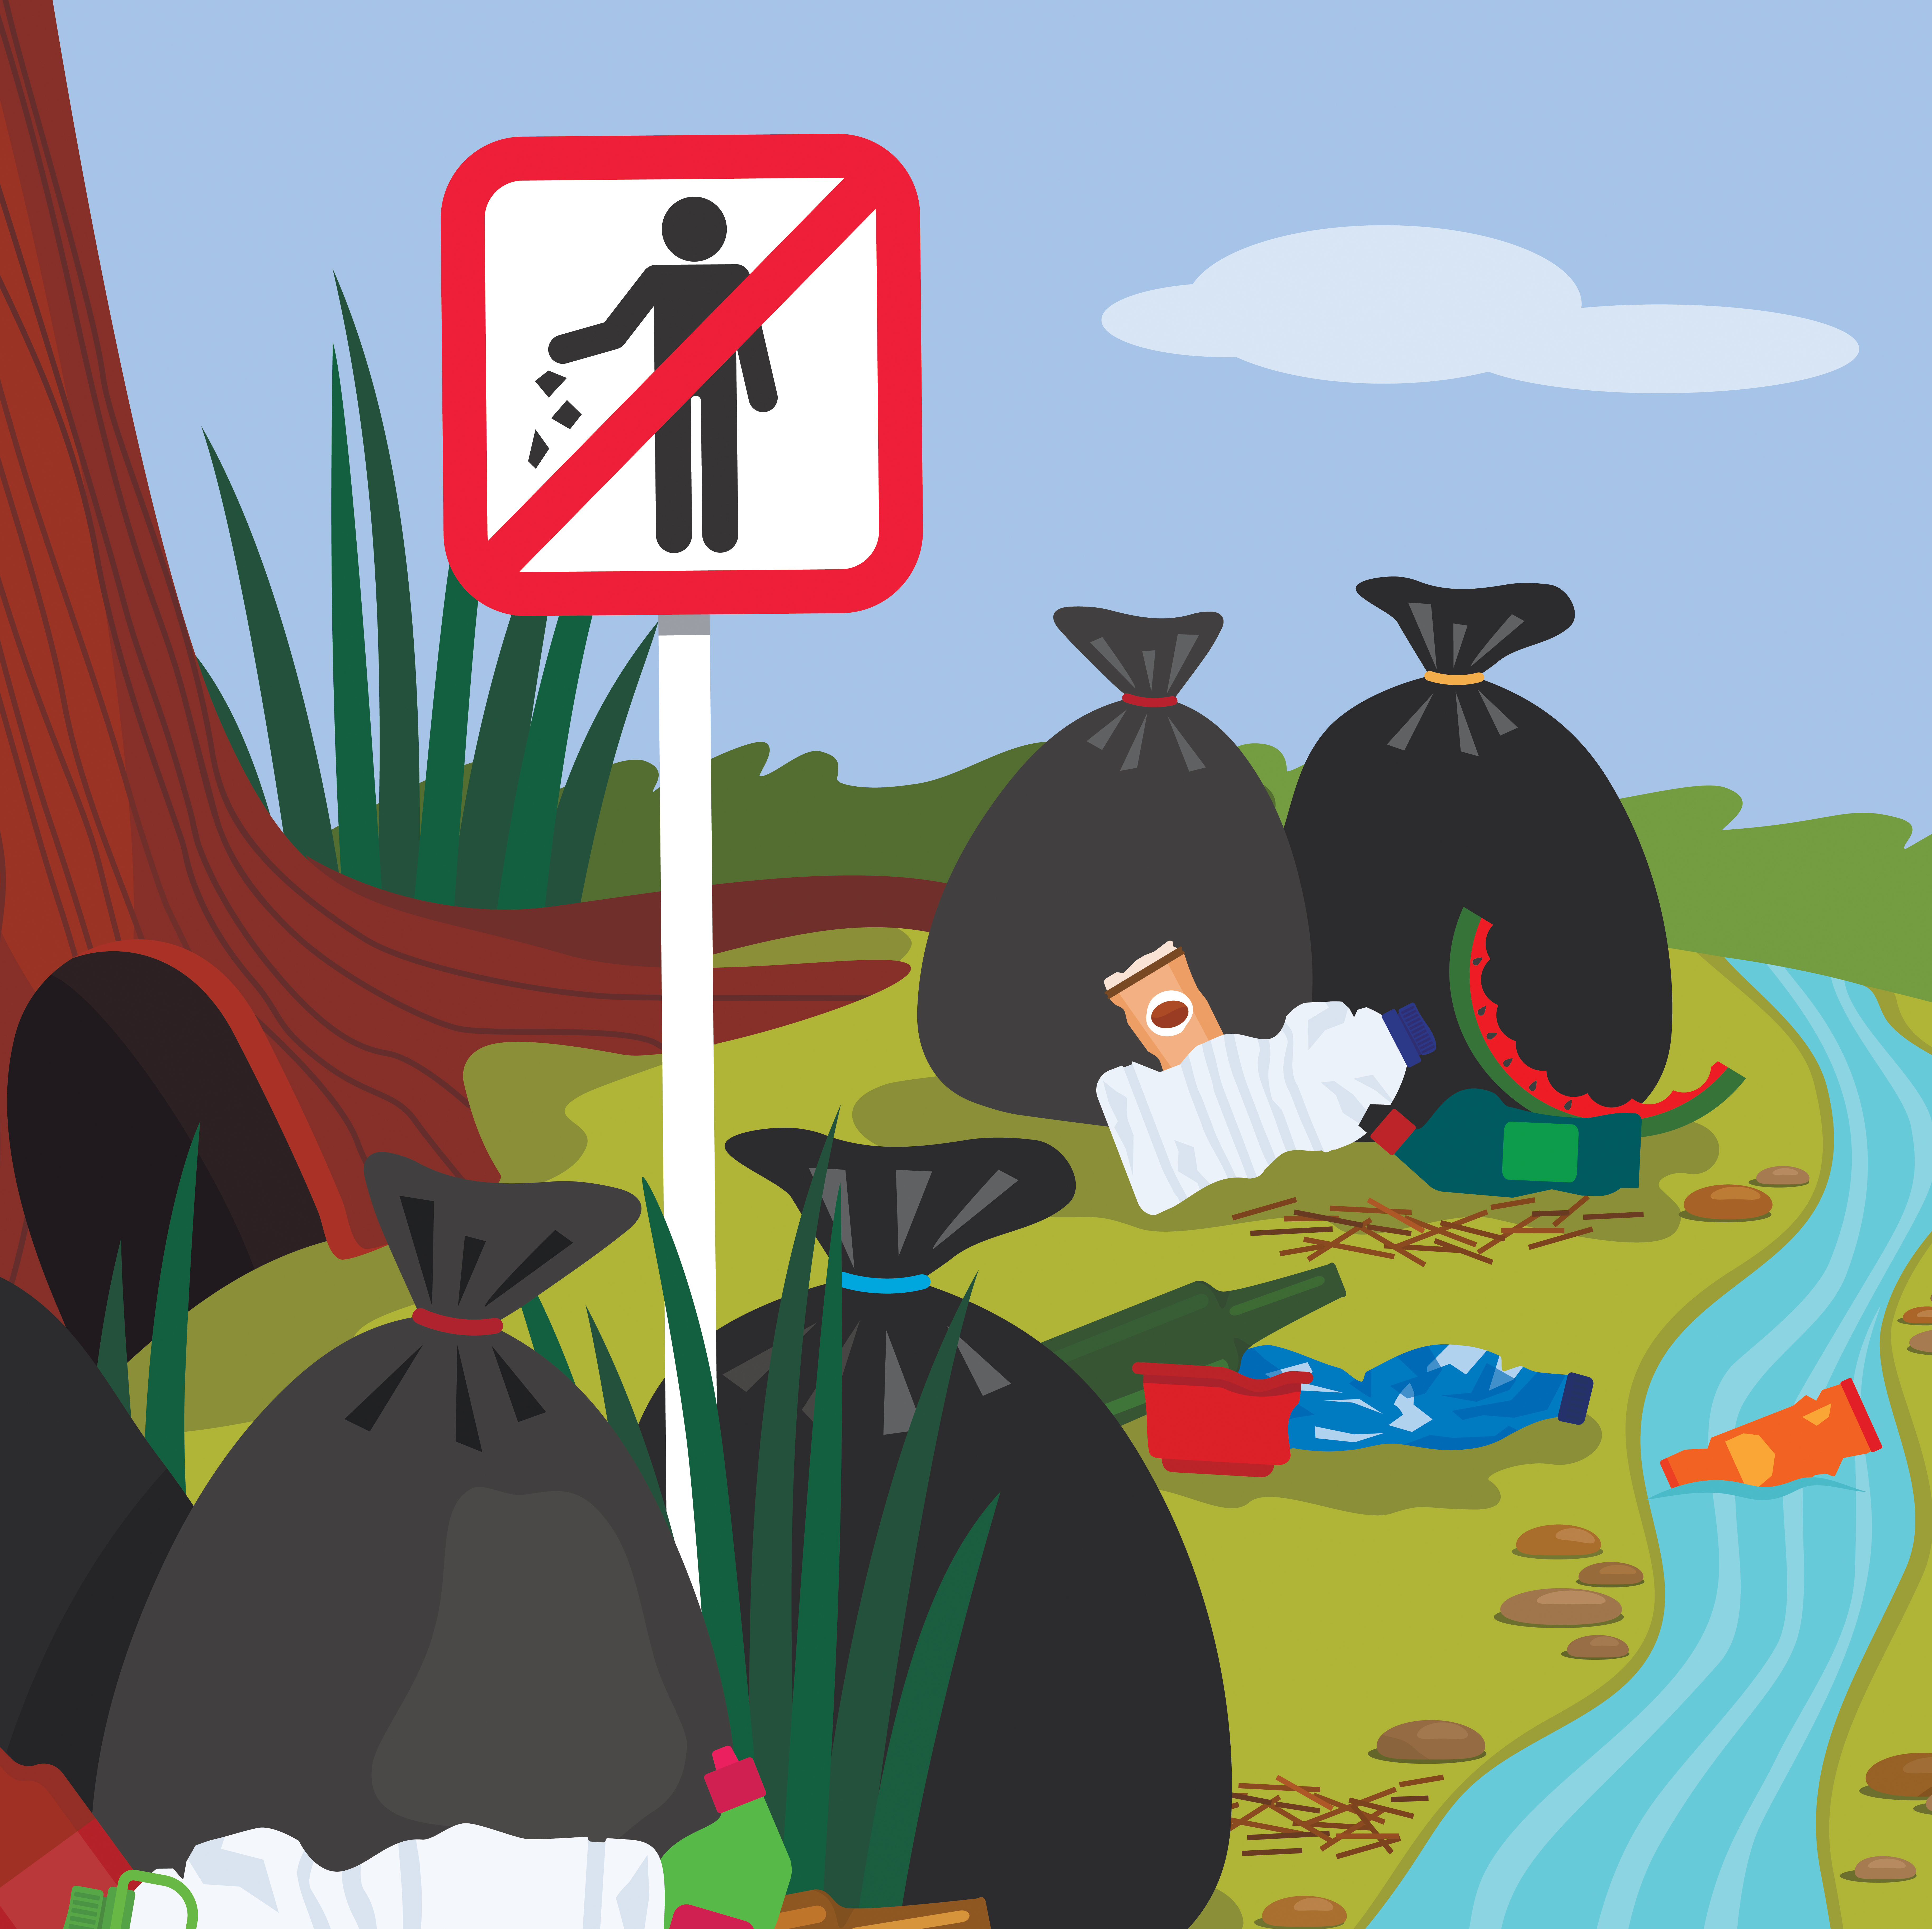
An intriguing anchoring phenomenon—litter accumulating in our schoolyard and in waterways—kicks off the learning. We take a walk around the school grounds and make a list of the litter we notice. Where do students suppose all this litter ends up? Students mostly think that it ends up in landfills or just keeps blowing around.
Then, we present images from the Washed Ashore exhibition (see Resource list) of creative wildlife sculptures made of plastic garbage collected from oceans. Students search for various materials embedded in the sculptures that were on their original list from the school grounds walk, as well as items they used in the past week. We also ask if any of the litter we found in our schoolyard might have made its way to the ocean? Do any of our local waterways have similar problems with accumulating litter? Students again mostly talk about AL blowing into waterways, but are unsure about how it then moves all the way to the center of the ocean.
We ask students what impacts they think the litter that collects in the oceans and other bodies of water has on waterways and the living things that depend on those waterways. Students record their initial ideas in their journals. We also look at images that depict two of the greatest impacts of AL: animals entangled in litter (such as nets, bags, six-pack drink holders) and animals ingesting litter mistaken for food (see Resources for examples). In pairs, students discuss and record what they notice from the images. As a class, we share out and add to students’ initial list of ideas about the impacts AL might have on wildlife, as well as on the environment more generally.
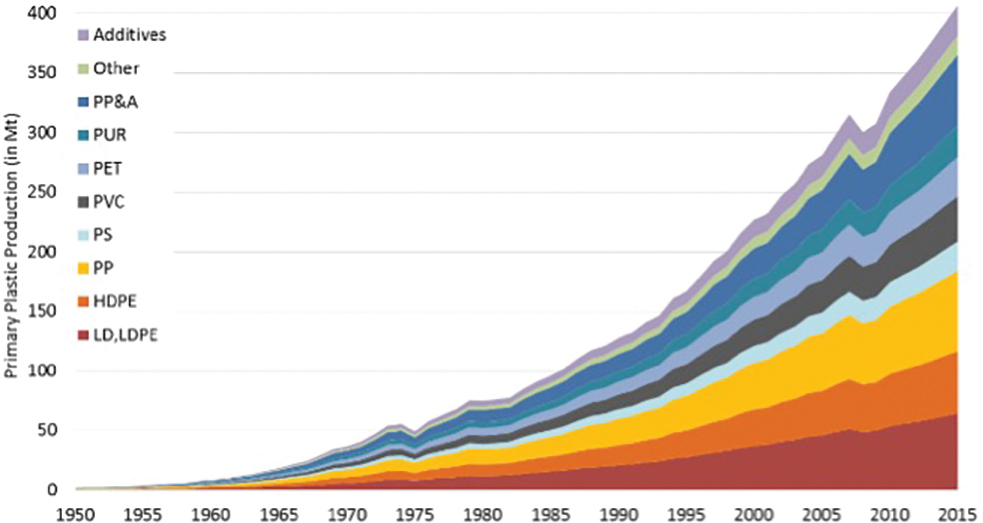
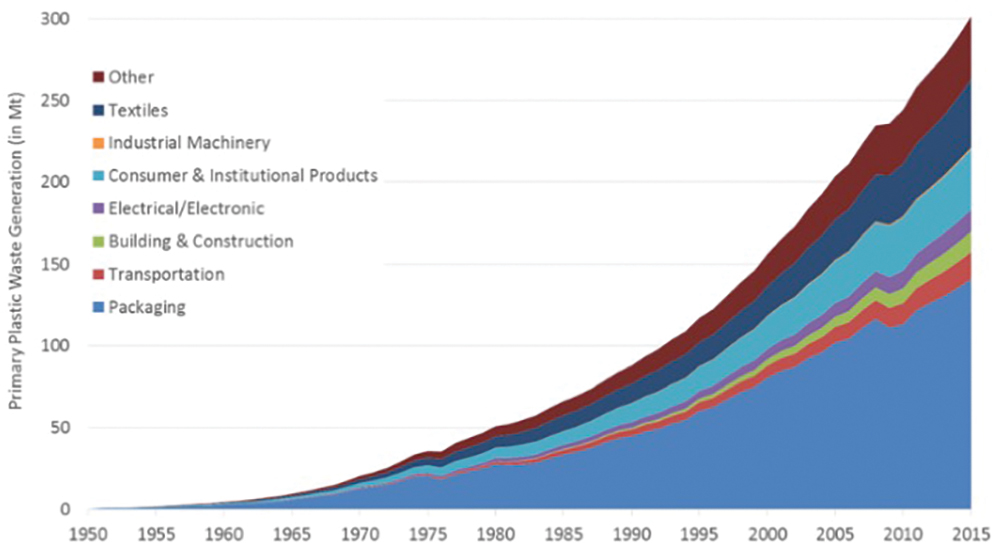
This is a good time to introduce the term anthropogenic litter, or AL for short. Anthropogenic is likely a new term, but we can help students to derive the understanding that it means originating in human activity. From here, we look at graphs depicting historical data reported by Geyer, Jambeck, and Law (2017) of plastic production rates and plastic waste generation over time (see Figures 1 and 2). Because these sorts of graphs may be new to students, it is helpful to pose questions such as, “What do you notice about the chart? What do you think the colors represent? Does it look like the amounts are increasing or decreasing over time? What do you think might be the reason for the increase?” We discuss what trends students notice. Specifically, students note that packaging and consumer products make up an increasingly large percentage of the total plastic waste. They infer that plastic waste is increasing because plastic production is also increasing. This is also an opportunity to practice writing evidence-based claims, independently or as a full class. Sentence frames can be helpful: Over time, as plastic production ________, plastic waste ________. As a result, we think that plastic litter has ________ over time.
Students also make predictions about what other sorts of AL, besides plastic, they think might wash ashore in area lakes and rivers. Referring back to the initial walk and what they noticed in the sculptures, students suggest things such as cans, shoes, basketballs, tires, etc. We encourage students’ thinking by saying that these are the sorts of things that scientists and community members are also thinking about!
Monitoring anthropogenic litter
Having identified the problem of AL accumulation, we begin to explore how and why we monitor the problem. Students offer initial ideas and then are introduced to local efforts.
Students use the online, interactive Beach Litter Data Exploration table (see Resources) to analyze and interpret actual data collected by Alliance for the Great Lakes volunteers at various cleanup events across the Midwest and Canada (see Figure 3.) The volunteers are asked to keep track of all the different types of litter picked up. At the end of the cleanup, they count the total number of items collected and the total number in each category. The data (going back to 2002) are saved in a public database, allowing for comparisons across sites and dates. It is important to share with students that the database and table are used by a variety of users for a variety of purposes, so there are features that the class will not need (such as total person hours spent at cleanup events).
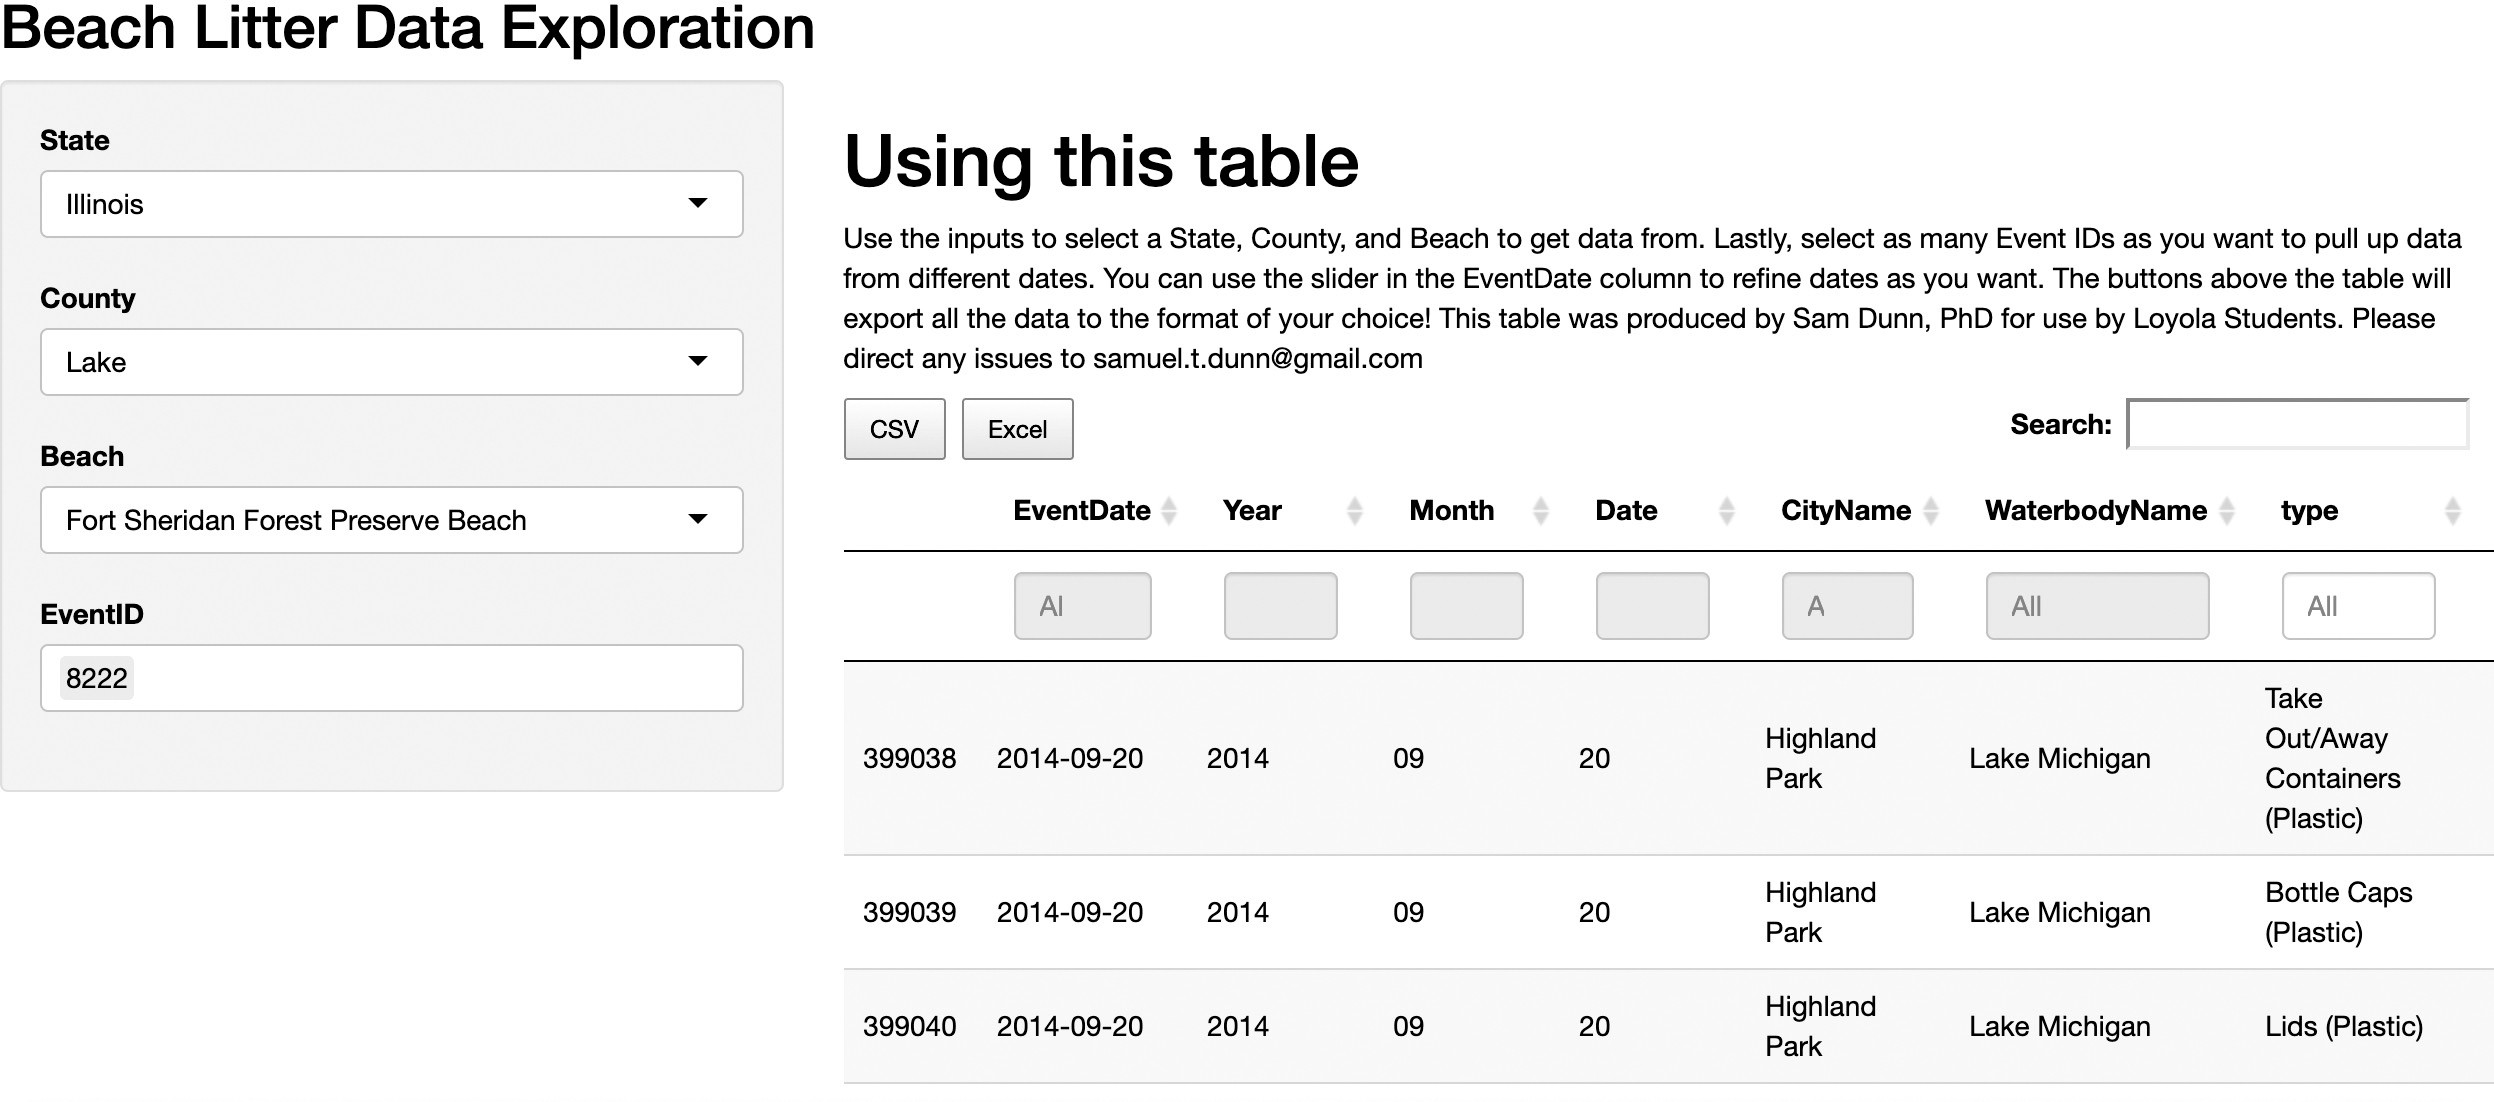
The Beach Litter Data Exploration table (Dunn 2018) allows users to retrieve data about specific cleanup events, such as the types of materials found and the quantity. The data can then be exported into an Excel file. Students can create charts in Excel to analyze the data visually.
We find it valuable for the teacher to demonstrate how to navigate the online tool by doing an example with the whole class (e.g., projecting the computer screen for all to see) before groups (of two or three students) get to work. The teacher can also create and print data files and charts ahead of time for the class to analyze in small groups or as a whole class.
If students will be selecting their own events to analyze, it can be helpful to provide a list of events for students to choose from. Look at the locations and event IDs and check the event locations and dates. Think about what would allow students to make the clearest comparisons between groups by controlling for variables such as month, the body of water, and beach.
A sample chart is shown in Figure 4 (p. 46). Figure 4 is from North Avenue Beach, one of the most visited beaches along Lake Michigan, in 2018. The other two charts we use (see Online Supplemental Materials) are from Wayne and Keweenaw counties, the most and least populated counties in Michigan in 2016 (so students can compare across population size and water body).
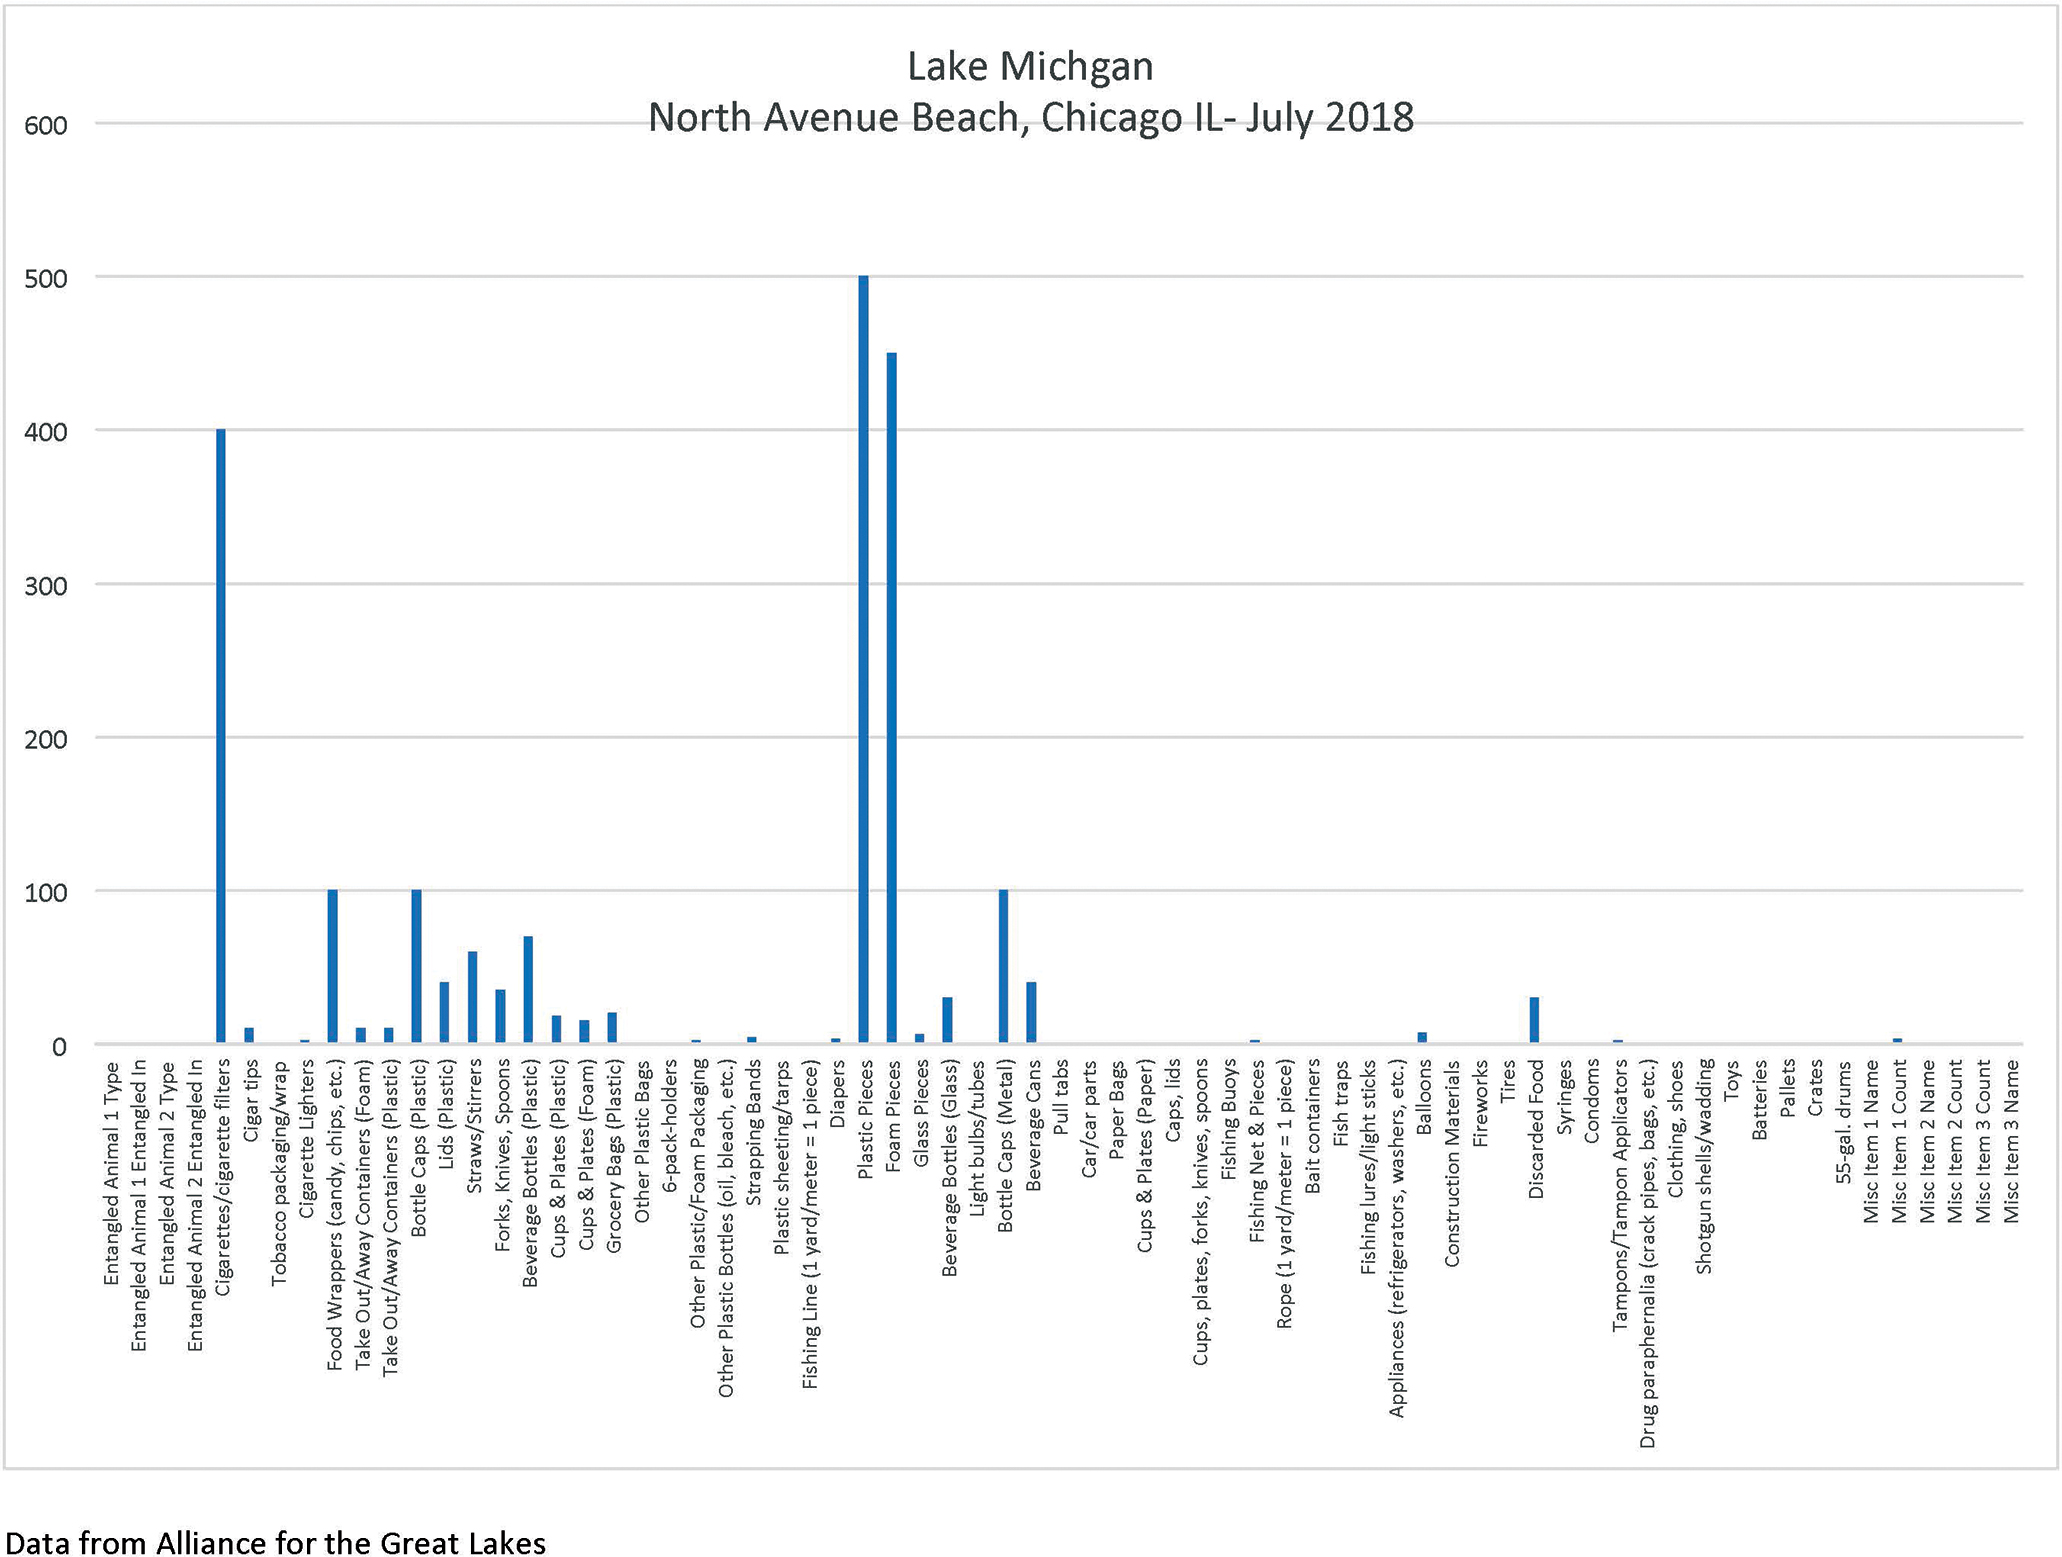
While analyzing the data depicted in the sample chart and/or in their own charts, students answer the following questions on a handout: What item is there the most of? Why do you think there would be so much of this item? At this site? On this date? What other patterns do you notice in these data? What else are you wondering about after looking at these data?
Once students interpret the findings from their group’s event, we discuss as a whole class the similarities and differences across cleanup events, as well as what questions the findings raise about the site and the timing of the cleanup. For instance, some students infer that a summer beach cleanup that took place on July 5, after a holiday, may have had an abundance of food containers because of people picnicking.
Analyzing data from an anthropogenic litter cleanup
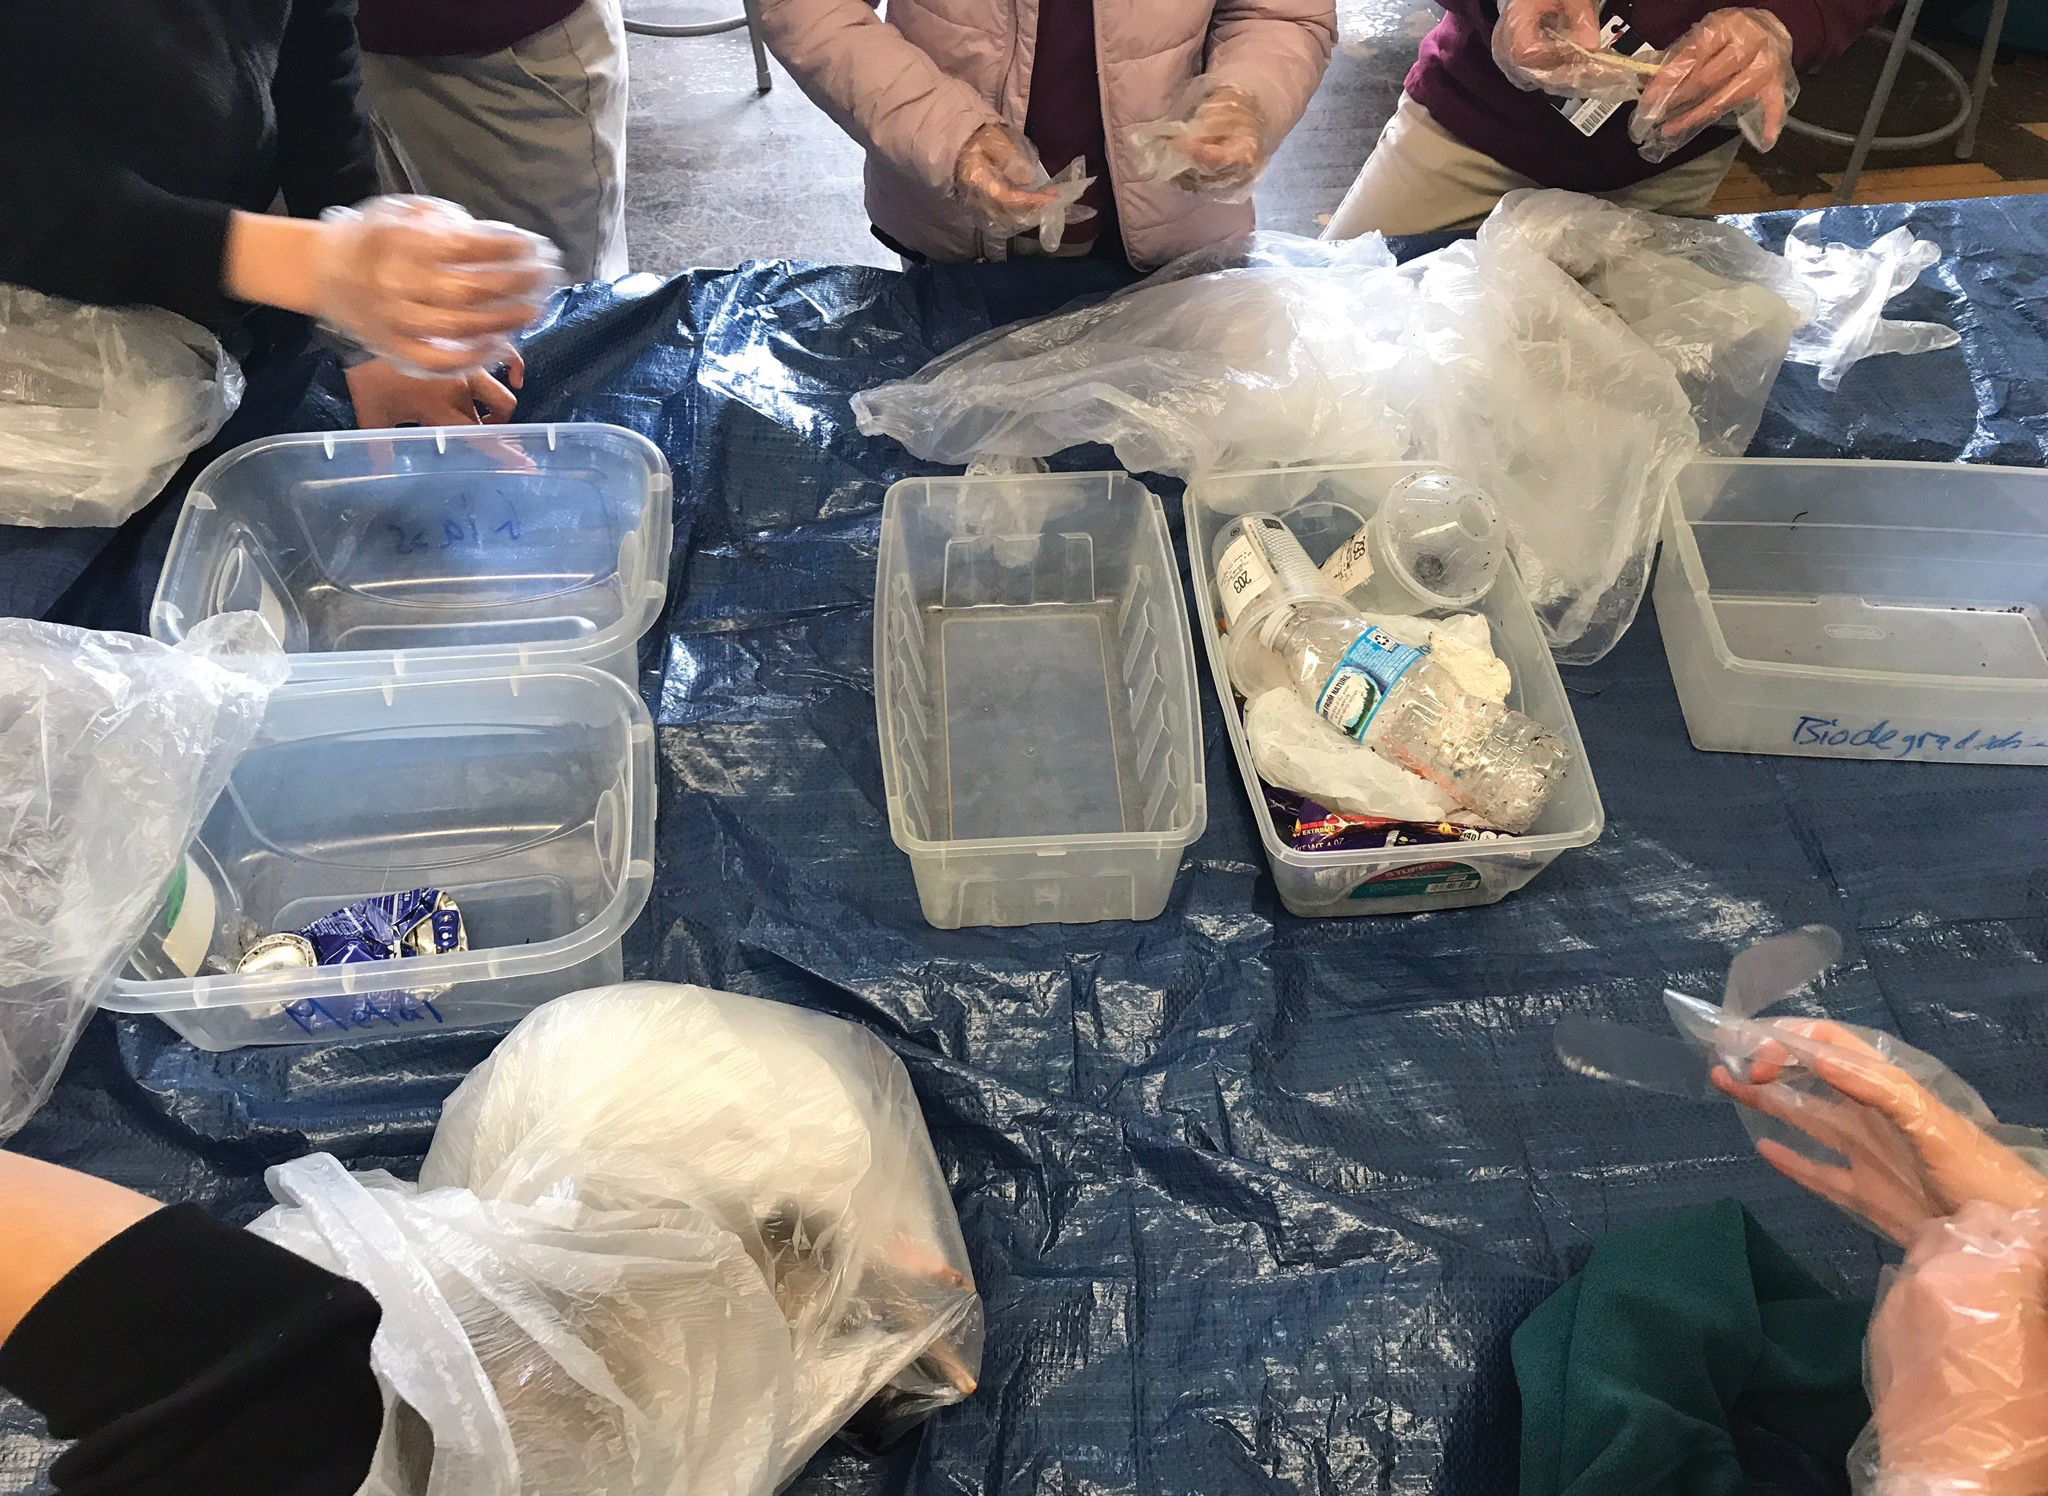
Now we are ready to tackle the question of how monitoring AL accumulation can inform efforts to minimize AL. This extension activity builds on students’ experience analyzing data and challenges students to think critically about how data are best used to support a scientific statement. This activity can be done using AL data from a cleanup of the schoolyard. Here are some recommendations to make sure it is a safe and rewarding experience for students: 1.Make sure you have the proper permission to perform the cleanup. Begin with asking the school principal about permissions specific to your school and class. It may also be beneficial to coordinate with the school maintenance staff. 2.Take proper safety precautions, including wearing protective gloves, closed-toe shoes and other protective clothing and sunscreen; bringing a first-aid kit; and not attempting to remove trash that is too big, sharp, suspicious, or otherwise dangerous. Depending on the site, students should also be warned about poison ivy, stinging nettle, ticks, and any other potential dangers. 3.The following activity requires the counting and sorting of trash in the classroom (see Figure 5), so bring the proper storage containers to bring the collected trash back. Large plastic bins with lids work well, as do large garbage bags, as long as there is nothing sharp that will break through the bag. Again, students should be reminded to wear protective gloves, closed-toe shoes and other protective clothing, and refrain from touching anything sharp, rusty, heavy, or suspicious.
Alternatively, images of trash from a cleanup of the Chicago River are included for students to use (see Online Supplemental Materials). The images are of trash collected for research in November of 2018 from the Bunker Hill Forest Preserve in Chicago. Multiple images are arranged on the pages, with multiple pieces of trash in each picture. If there is more than one picture of a given piece of trash, they are marked with arrows and the label “Same Items.” We recommend that each piece of AL be treated separately, even if they are in the same picture or on the same page together.
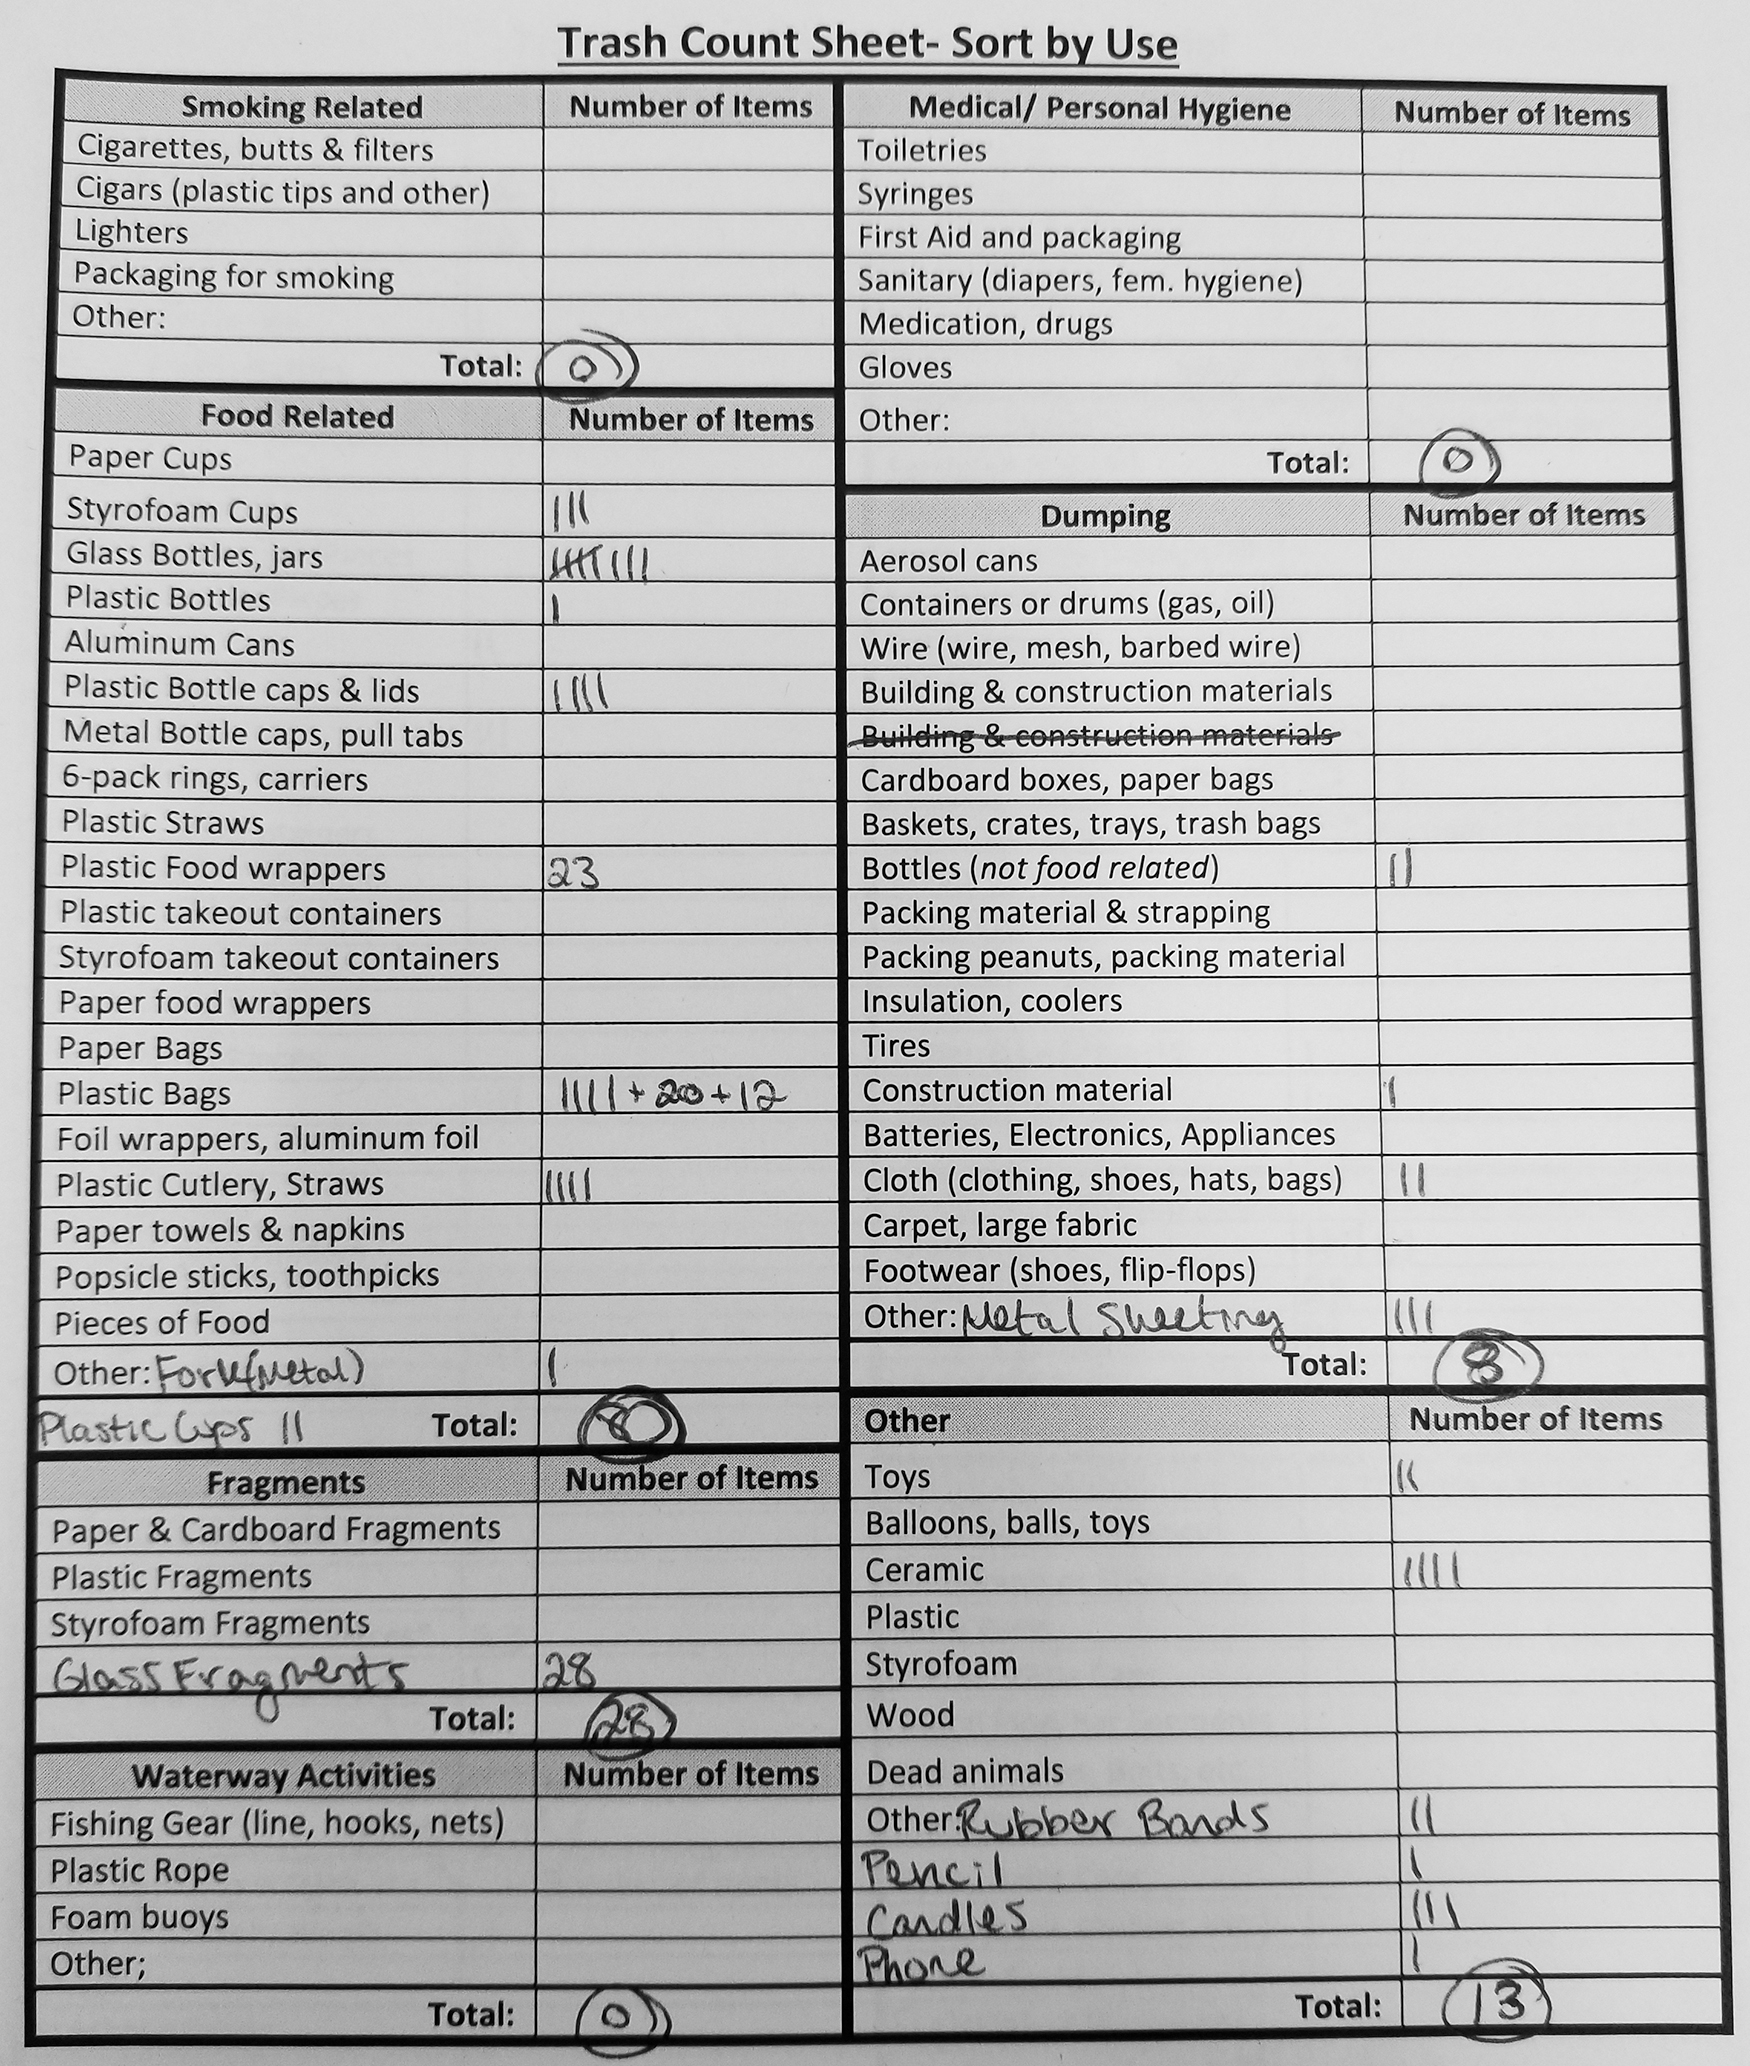
Once the trash is collected and sorted (or the trash pictures are prepared), the class splits up into small groups of four or five students each. Half of the groups are given Trash Count Sheets whose categories are organized by use (e.g., food related, dumping), and the other half is given Trash Count Sheets that are organized by material (e.g., plastic, metal). See Figure 6 (p. 48) for a long version. Each group sorts the available trash (physical trash or images depending on which version of the activity is being conducted) into the categories listed on their sheet and counts the pieces of trash in each category.
Next, students use that information to create a bar graph, by hand, of their group’s data. Depending on students’ familiarity with creating and reading bar graphs to communicate information, it can be helpful to review with questions such as, “Who can remind me what a bar graph, or bar chart, is? When are bar graphs useful? What do they show us?” It is also helpful to look at a blank graph template (see Online Supplemental Materials) and fill some of it in together. Students should write ‘Number of Pieces of Trash’ on the vertical axis and decide what scale would be most appropriate (“What should we count by?”). The categories should be written along the horizontal axis. Students can select a separate color to use for each different category and note this on the key.
Once all bar graphs are complete, students compare their bar graphs to another group’s bar graph with the same categories and answer the following questions: Even with the same categories, are the two graphs identical? Why do you think this is? (Likely they will not be identical because students could interpret the categories differently.)
Next, two student groups are assigned to come together, and combine and compare their bar graphs and answer the following questions: Even with different categories, what similarities do you see between your data? Where are the biggest differences? (In the datasheet shown in , note the connection between plastic and food-related objects, glass, and fragments.) Why might it be important to know about both the use of a piece of trash and the material it’s made of? (If we know what it’s used for, we can figure out how it got there and offer ideas for how to prevent it from becoming litter. If we know what it’s made of, we can predict how it will act in the environment.)
Groups report their findings in a whole-class discussion, and we record students’ ideas on the board or chart paper. If students do not bring it up themselves, they should be encouraged to make predictions about the hazards that particular materials present to the environment. For instance, fishing wire can be an entanglement hazard, biohazards might carry disease, and construction waste can leach harmful chemicals.
Using data to inform solutions
How can the data inform solutions in communities? Groups receive a list of hypothetical scenarios regarding trash (listed below). For these scenarios, students should have access to both a use-organized data sheet and a material-organized data sheet. Student groups work to decide whether or not their data can be used to answer the question presented in that scenario. If they can, students should answer the question; if not, students should explain why not or what other information would be needed to answer the question.
Sample scenarios:
- The local government has implemented a plastic bag tax to try and reduce plastic litter in the streams of their town. They want to know, according to your data: “Has the plastic bag ban reduced the number of plastic bags in local streams?”
- The organization that manages the park wants to implement a plan to reduce the amount of waste that gets into the stream. They want to know, according to your data: “What is the number one way people are using the trash before it gets into the stream?”
- A community group is collecting data from river cleanups all over the area. They want to know, according to your data: “What proportion of the trash in this stream is plastic?”
The first question cannot be answered using the given data. One would need additional information about how many plastic bags were in the streams before the bag tax to compare their data. The second question can be answered using the data organized by use. The third question can be answered using the data organized by material.
The above scenarios can also be edited to be specific to the context of a given classroom. For example, the first scenario can be changed to include an action taken by the school’s local government in place of a plastic bag ban. Scenario 2 could be framed as a question from the school’s administration wanting to reduce the amount of trash on school grounds instead of an organization that manages the park. Teachers can also add scenarios of their own, especially if the class completed their own trash cleanup.
Taking action
Finally, student groups are charged with making posters to hang in the school halls that serve as a public service announcement to their peers. The posters should explain: what AL is; how AL accumulates in local and distant waterways and who is responsible; why AL is a problem; how AL accumulation (what, where, how much) can be measured; and why measuring AL is of interest to scientists and communities. Posters should also include students’ suggestions for how to take action to reduce AL accumulation in local and global ecosystems.
Assessment
Both verbal and written questions posed by the teacher allow for regular assessment of students’ understanding of the concepts. Questioning also allows students to contribute their ideas, giving the teacher a sense of students’ concerns. Ideas can be recorded in student journals and on the class summary table, which also provides a reference point for students to refer back to throughout the lesson.
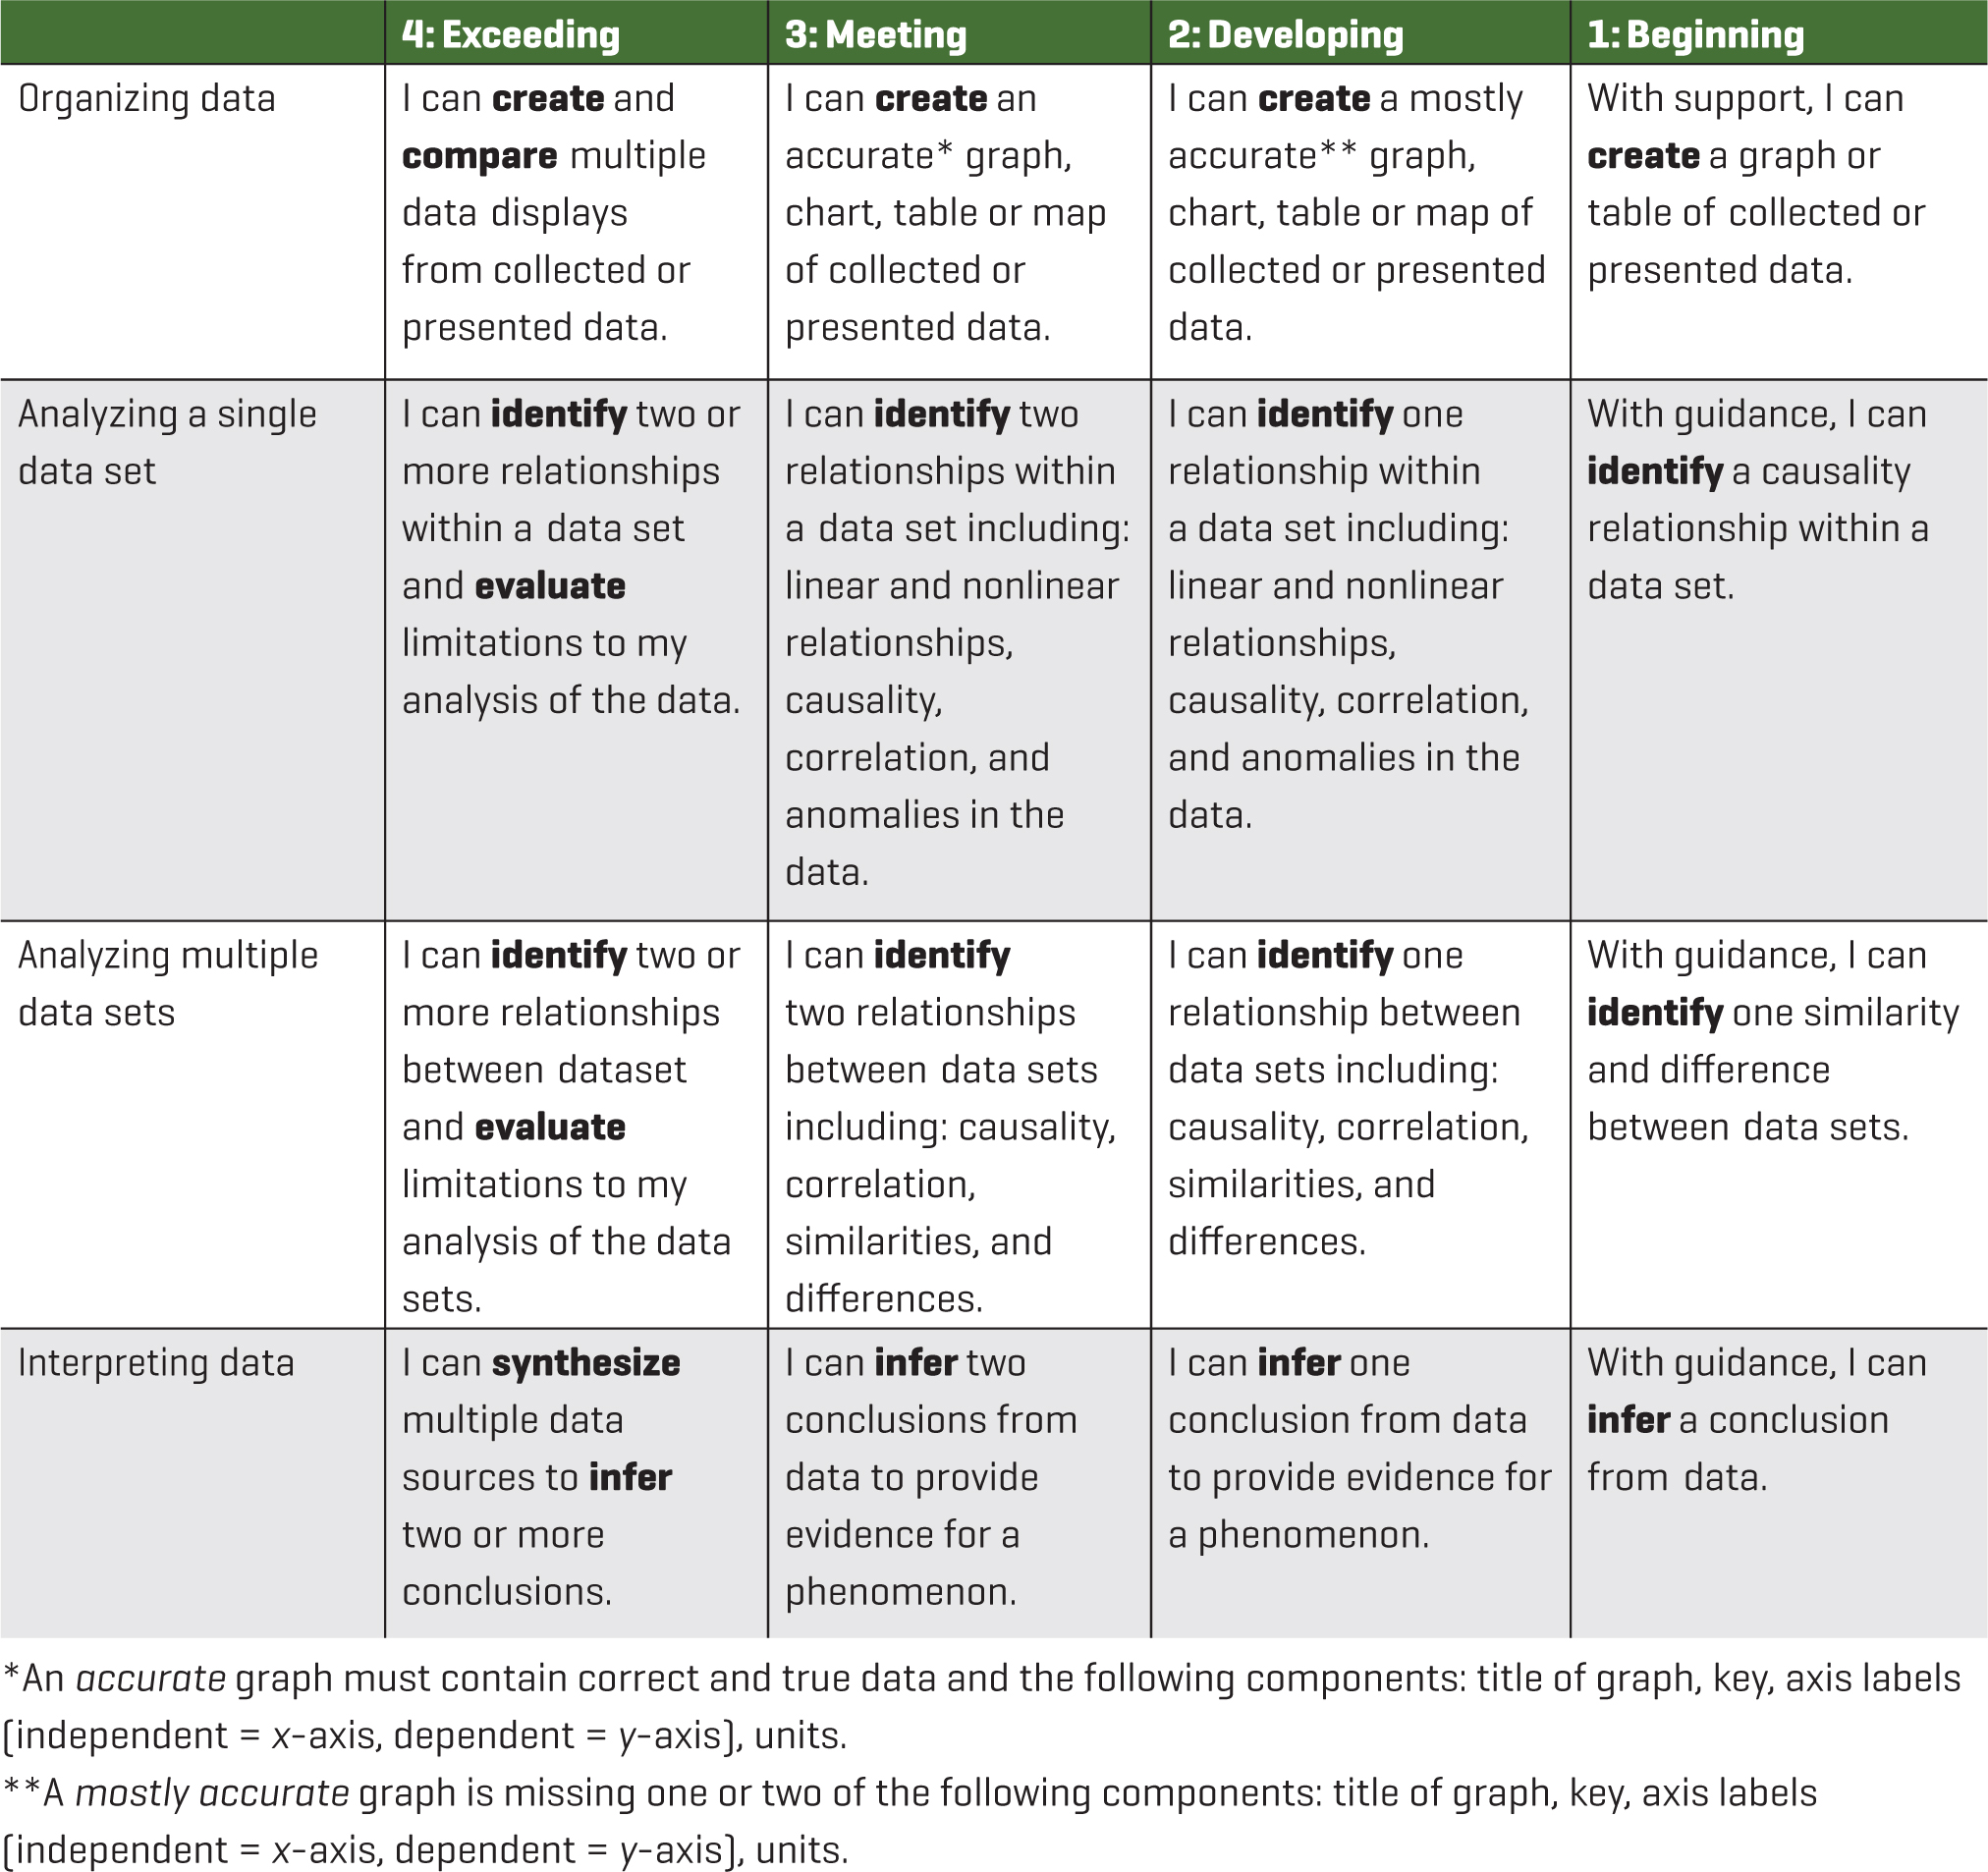
Given the large role that data analysis plays across these lessons, the charts that students create and their responses to the analysis questions provide a record of students’ abilities to organize, analyze, and interpret data. A skills-based rubric in the form of “I” statements was used to assess student’s ability to analyze and interpret data, and evaluate whether sufficient data are available to support a claim (see Figure 7, p. 49). Because these generic rubrics are used for various lessons throughout the year, students are familiar with them. However, they can also be edited to be more specific to suit your needs.
Finally, the posters can serve as a summative assessment. We like to develop a checklist of the required elements with students as we introduce the assignment, in order to capture their thoughts on what is most important to include. Then, this checklist also serves as a scoring guide. The checklist questions include: 1.What is AL? 2.How does AL end up in our rivers, lakes, and oceans? 3.How do people contribute to the problem? 4.Why should we care about AL? 5.How can we measure AL (what, where, how much)? 6.Why do we want to measure AL? 7.What action can we take every day to help minimize AL and its impacts?
Conclusion
Oftentimes, environmental issues can seem irrelevant to students’ lives, or too daunting for youth to overcome. This set of learning activities presents students with an issue that is highly relatable to their own lives and communities. Litter is something we all see every day. Moreover, the learning activities introduce partnership efforts between scientists, volunteers, and organizations in their community focused on solutions to the challenges presented by AL. Most importantly, the learning activities highlight actions that students can take in their daily routines to make a difference.
Connecting to the Next Generation Science Standards (NGSS Lead States 2013)
- The chart below makes one set of connections between the instruction outlined in this article and the <i/>. Other valid connections are likely; however, space restrictions prevent us from listing all possibilities.
- The materials, lessons, and activities outlined in the article are just one step toward reaching the performance expectation listed below.
Standard
MS-ESS 3 Earth and Human Activity
www.nextgenscience.org/dci-arrangement/ms-ess3-earth-and-human-activity
Performance Expectation
MS-ESS3-3. Apply scientific principles to design a method for monitoring and minimizing a human impact on the environment.
Connections to the Common Core State Standards (NGAC and CCSSO 2010)
ELA
RST.6-8.7. Integrate quantitative or technical information expressed in words in a text with a version of that information expressed visually (e.g., in a flowchart, diagram, model, graph, or table).
WHST.6-8.8. Gather relevant information from multiple print and digital sources, using search terms effectively; assess the credibility and accuracy of each source; and quote or paraphrase the data and conclusions of others while avoiding plagiarism and following a standard format for citation.