
Integrating Tech
Making Science Come Alive With Clouds
Making Science Come Alive With Clouds ( Issue 1)
By MARILÉ COLÓN ROBLES, JEFFREY BOUWMAN, AND CARYN SMITH-LONG
Hardware, software, and websites for use in the classroom
The Global Learning and Observations to Benefit the Environment program (GLOBE) has provided teachers and students with the opportunity to collect scientific data on the environment since 1994 (Berglund 1999; Muller et al. 2015). The program provides steps designed by scientists for students to collect environmental data, called protocols, to be used in research by scientists all over the world. The new GLOBE Observer mobile app (GO app) allows the general public to make observations of clouds (Nugent 2018; see Figure 1), map out habitats of disease-causing mosquitoes, measuring tree height, and identify land cover from any mobile device. Teachers use the new app because it is easy to use and easily incorporates technology in the classroom (Spellman et al. 2018). The app can run while the mobile device is not connected to WiFi, so teachers can go outside with students to make and store the observations.
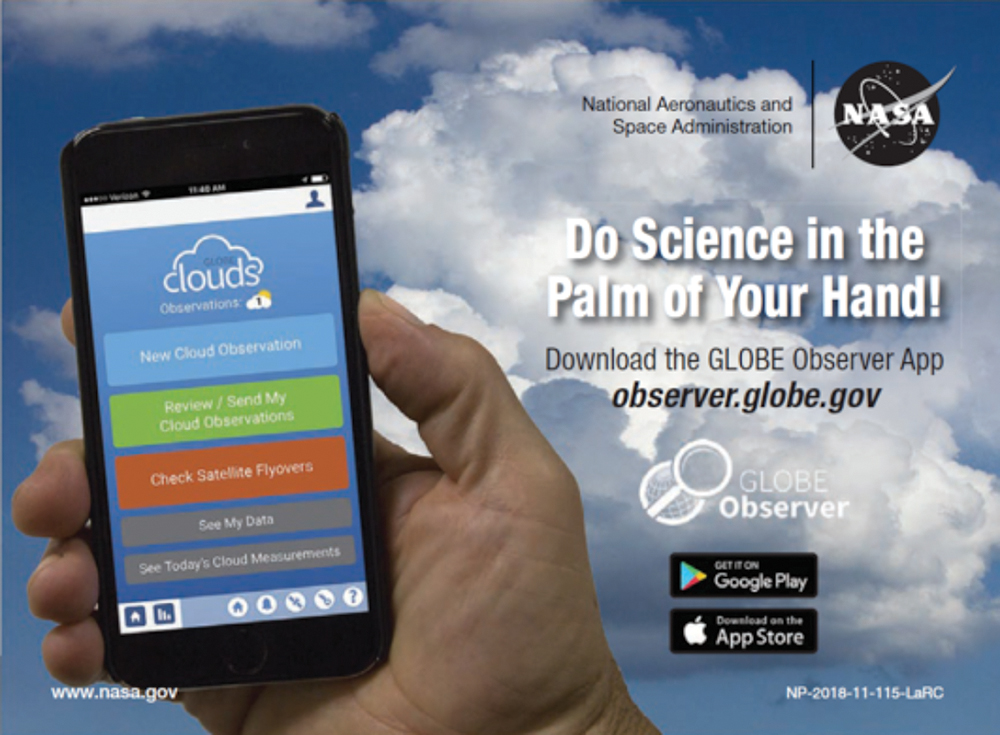
The GO app runs on any mobile device and is free at the Apple app store and Google Play. Note: current editions of the app do not work on Chrome books. An account is needed with an email address to record data within the GO app.
Investigations with the GLOBE Observer app
At Shumate Middle School in Gibraltar, Michigan, we have students use mobile devices and the GO app to help monitor, analyze, and report local cloud patterns. Students simply take a quick walk outside, turn on their mobile device, open the app, and follow a set of easy steps to take a cloud measurement. On average, it take students less than five minutes to complete the process, as the GO app easily guides users through a series of prompts to take pictures of the sky and to identify the sky condition (color and haze), percentage of cloud cover, types of clouds or contrails, visual opacity, and surface conditions.
When observations are entered into the app, the data is electronically submitted to the GLOBE Program. All data submitted to the GLOBE Program are also shared with NASA, and are readily available for students and scientists to access via the GLOBE Program’s electronic database.
During a normal school day at our middle school, small research teams (consisting of two or three students) observe current cloud and sky conditions outside on a school sidewalk. This small group setting allows students to collaborate, discuss, and ensure that they have taken accurate measurements. Students traveling outside to take measurements can be monitored by the teacher through a classroom window, and the students are reminded not to venture away from the school sidewalk area. Students are also monitored by a hall monitor and school security cameras.
To enhance citizen science while school is not in session during the summer months, our middle school encourages students to complete the GLOBE Observer Challenge. All student volunteers who want to take cloud measurements via their own mobile device receive a personal GLOBE Program student account (see Resources). The lead instructors set up the accounts and make sure all students are able to login and use the app correctly before summer vacation begins.
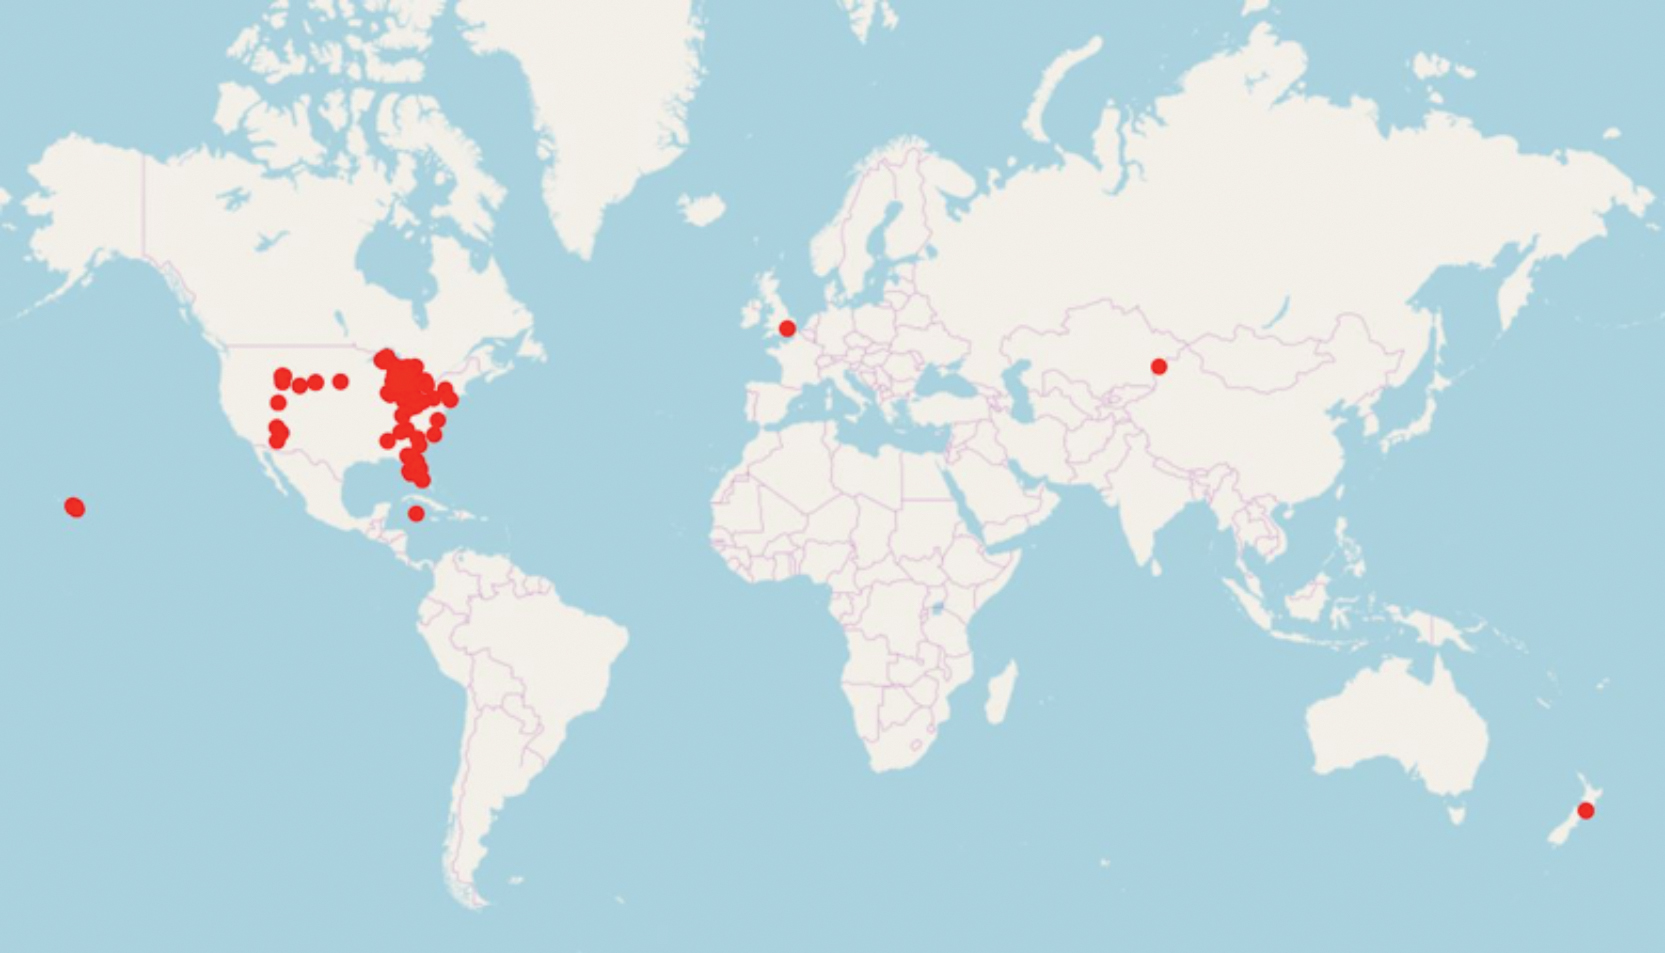
All challenge members take cloud measurements in their local neighborhoods and while traveling with their families. Some students take measurements out of state and even out of country (Figure 2). Once again, this is another example of how technology can be used to engage students.
Taking and submitting citizen science measurements is only one part of the process of truly understanding one’s environment. The GO app provides students with the opportunity to add their data to data collected by citizen scientists around the world via GLOBE’s electronic database. Using this extensive data set, students can create environmental research projects, many of which are submitted to the GLOBE program’s International Virtual Science Symposium or the Student Research Symposium (see Resources for links to these projects). Both events are hosted by the GLOBE program annually, and all research and projects are led by students who create their own research questions and hypotheses, learn how to use required scientific tools correctly, take accurate measurements, analyze and submit data to the GLOBE program, and assemble an environmental research report.
How you can participate
The GLOBE Program allows teachers to create free accounts. The program also provides training for various measurements, including clouds available through the online Protocol eTrainings, or face-to-face sessions (see Resources). Once a teacher is trained, they can add their school as an observing site and collect data. The observations are then displayed on GLOBE’s data visualization tools, highlighting the school’s location, and making the data available for other schools or researchers to use.
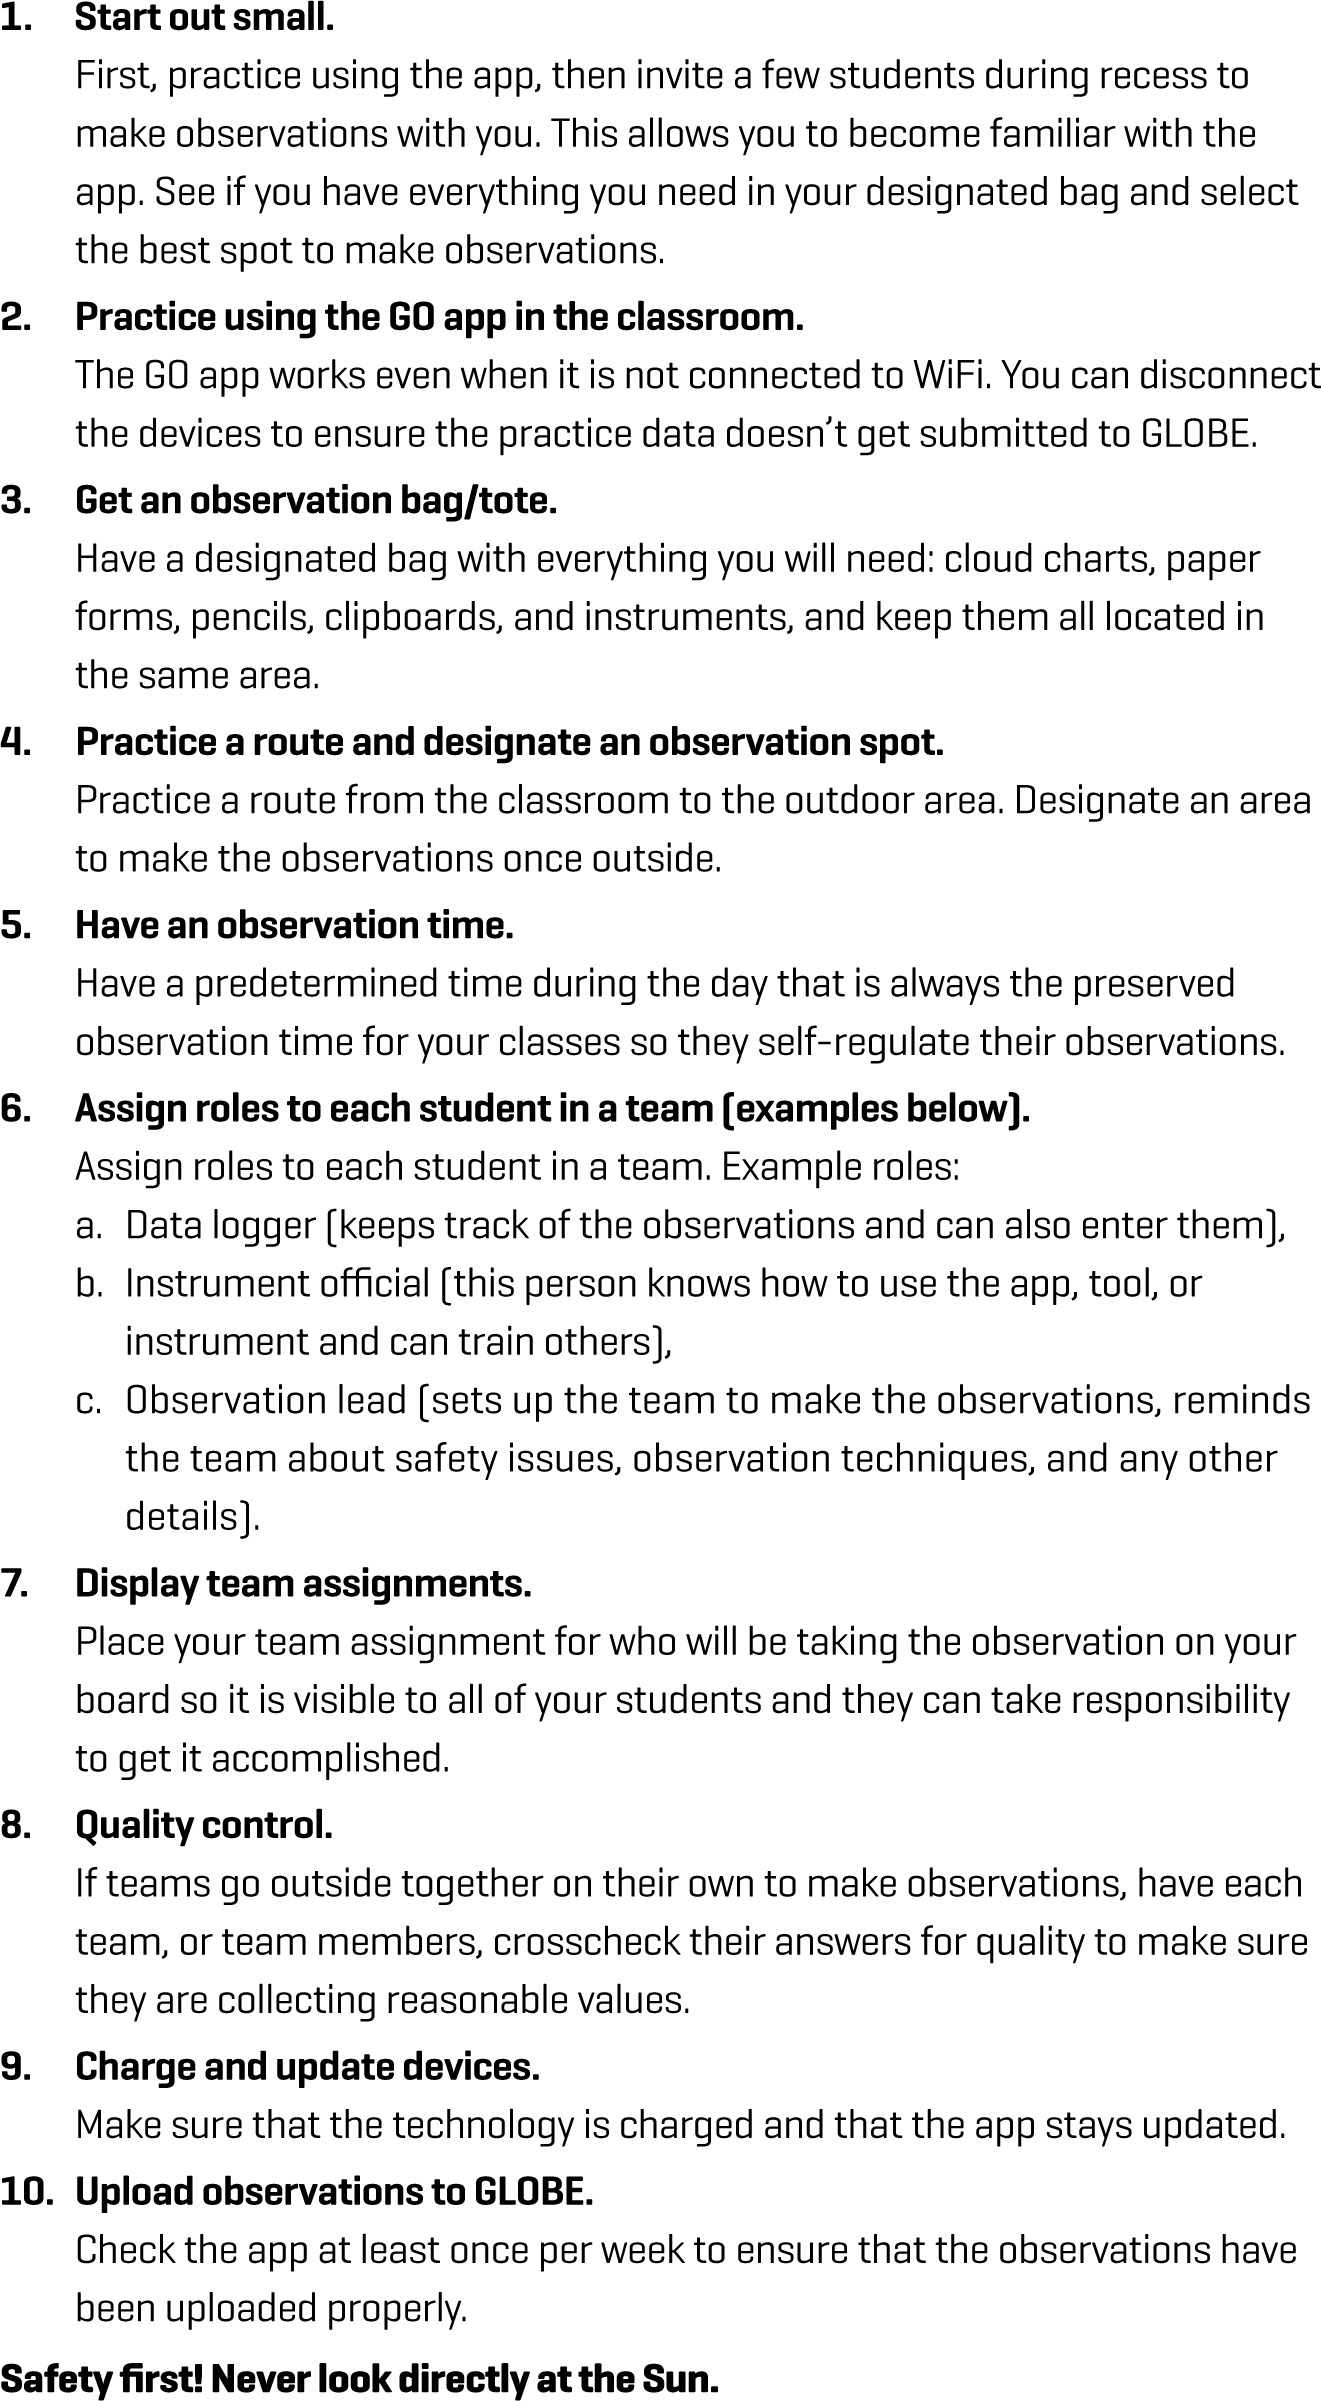
Teachers can synchronize their GO app with their GLOBE program account by using the same login information in both. The NASA Langley science education team, who lead the cloud observations in GLOBE, can be contacted using the team’s contact page (see Resources). Figure 3 lists some tips and tricks from the authors on making environmental observations with technology.
One step further: Receive emails from NASA
The NASA LaRC science education team sends an email for each cloud observation submitted through GLOBE or the GO app. The message contains a satellite match table (see Figure 4) that compares the cloud observations made by the citizen scientist with data from satellites at about the same time and location as the citizen scientist. Interested observers can use the app to learn of dates and times when different satellites will be over their area.
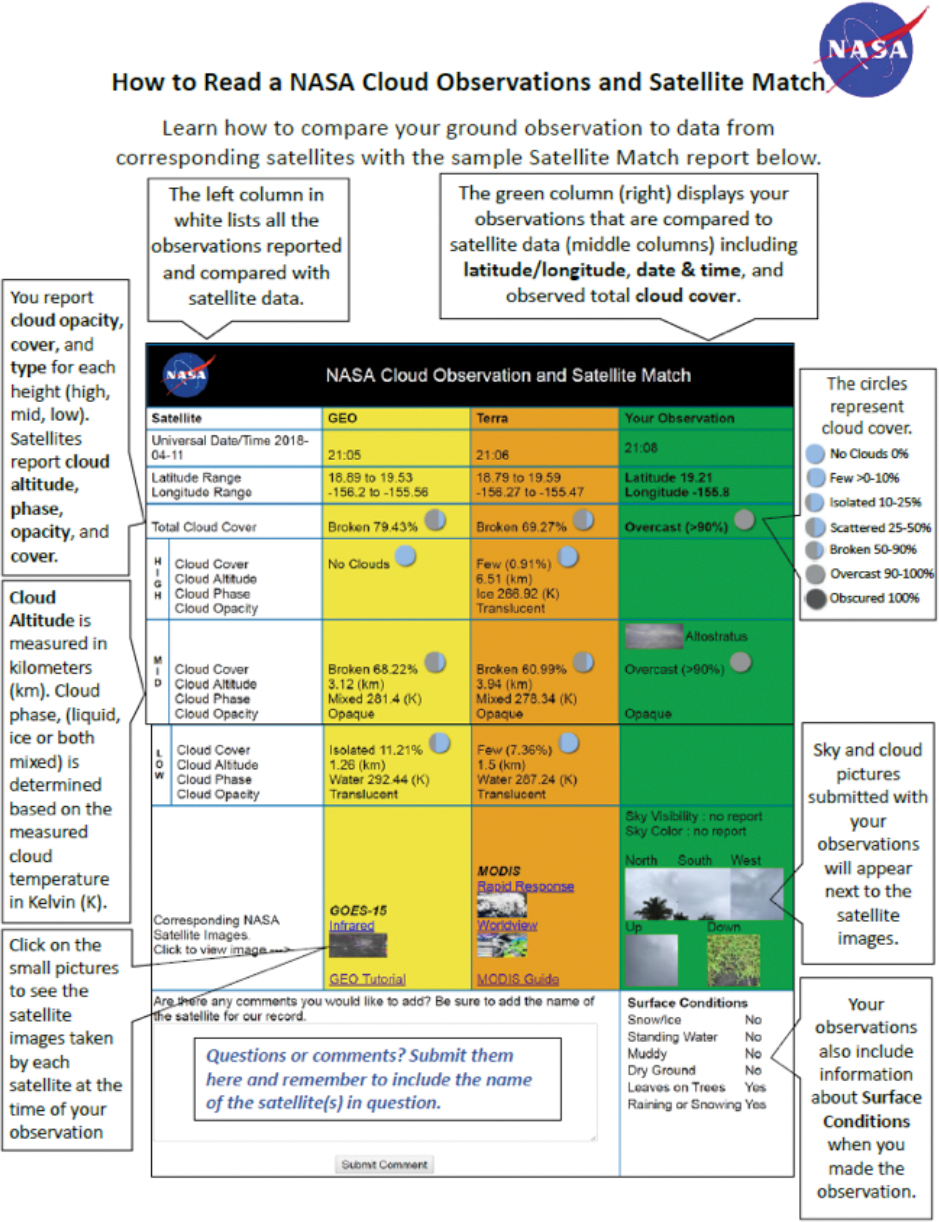
In addition, the satellite match table uses color combinations recommended for the visually impaired and is designed to easily note if the satellite was able to detect the same or similar clouds as the citizen scientist. This type of comparison is important for researchers who want to know times when the satellite was not able to detect clouds. Teachers can use this information to discuss how scientists are always observing and finding ways to collect better data.